


 |
市場調查報告書
商品編碼
2122582
實驗室過濾:市場佔有率分析、行業趨勢和統計數據、成長預測(2026-2031)Laboratory Filtration - Market Share Analysis, Industry Trends & Statistics, Growth Forecasts (2026 - 2031) |
||||||

※ 本網頁內容可能與最新版本有所差異。詳細情況請與我們聯繫。
據 Mordor Intelligence 稱,實驗室過濾市場預計在 2026 年價值 50.1 億美元,預計在預測期(2026-2031 年)內將以 8.63% 的複合年成長率成長,到 2031 年達到 75.8 億美元。
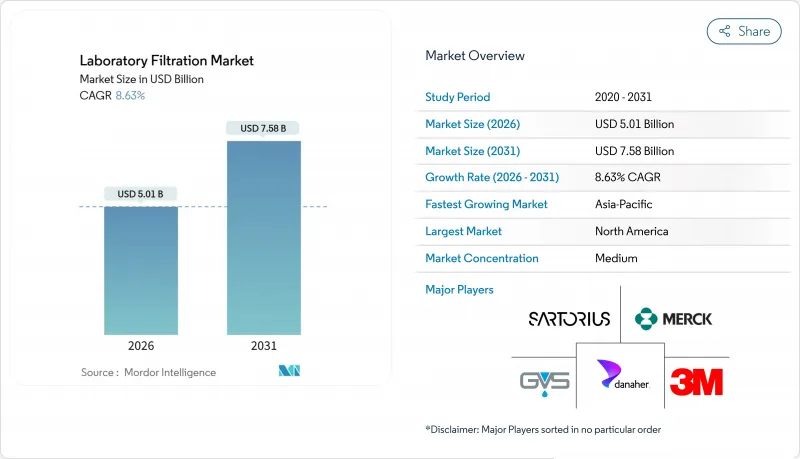
本報告按產品類型(過濾、過濾組件、過濾配件)、技術(過濾、超過濾等)、最終用戶(製藥和生物技術公司等)以及地區(北美、歐洲、亞太、中東和非洲、南美)進行細分。市場預測以美元計價。
全球實驗室過濾市場趨勢及洞察
增加生技製藥研發支出
預計2025年,全球醫藥研發支出將達2,440億美元,年增7.5%。其中,生物製藥將佔62%。目前,每份臨床實驗藥物申請需要進行15至20項無菌和病毒移除驗證測試,相當於3至5批次生產的膜面積。合約檢測實驗室的穩定性測試樣品處理量增加了28%,促使採購負責人協商長期過濾合約以確保價格和供應。監管機構不斷完善製程驗證指南,導致申辦方反覆進行測試以滿足不斷變化的無菌標準,從而持續消耗膜材料。因此,穩定的訂單基礎得以建立,使實驗室過濾市場能夠抵禦宏觀經濟波動的影響。
細胞和基因治療生產規模擴大
2025年底,預計將有37種細胞和基因治療產品獲得批准,180個項目進入II/III期臨床試驗,專門用於病毒載體研發的GMP設施數量已加倍。切向流過濾對於慢病毒和腺相關病毒(AAV)的純化至關重要,每個50公升生物反應器循環大約運作12平方公尺的中空纖維膜。賽多利亞斯公司報告稱,2023年至2025年間,細胞治療相關客戶佔其生物製程銷售額的11%至19%,凸顯了該領域訂單量的變化。為了實現商業化規模生產,到2028年,過濾能力需要提高十倍,這迫使合約研發生產機構(CDMO)對多家供應商進行預認證。能夠提供不同血清型病毒截留數據的供應商在實驗性過濾市場中獲得了更大的競爭優勢。
高等級薄膜聚合物供應鏈波動性
由於聚二氟亞乙烯(PVDF) 和聚醚碸(PES) 樹脂僅由亞洲三家製造商供應,任何供應中斷都會對成品捲材 8-12 週的前置作業時間產生影響。 2025 年 8 月,一場颱風導致台灣一家 PVDF 工廠停產,造成供應減少 18%,藥用級 PES 現貨價格上漲 23%。儘管主要供應商透過簽訂多年期訂單合約來規避風險,但中型組裝製造商卻面臨配額減少和利潤率下降的壓力。監管文件對膜的化學成分有明確規定,因此緊急替換成本高。垂直整合,例如 Sartorias 在 2024 年收購 PES 混配商,使大型公司能夠減輕部分影響,但供應衝擊仍然是實驗室過濾市場面臨的結構性阻力。
細分市場分析
預計到2025年,過濾介質將佔銷售額的57.31%,凸顯了膜卷、褶皺濾芯和膠囊過濾器在生物製程各個階段的核心作用。儘管0.22µm濾膜的商品化擠壓了利潤空間,但供應商透過親水塗層和靜電層等差異化因素,實現了20%的溢價。雖然過濾配件市場規模較小,但隨著實驗室液體處理自動化程度的提高,預計到2031年將以10.92%的複合年成長率成長。一台篩檢機器人每天即可處理10,000個注射器過濾器,配件已成為實驗室過濾市場中成長最快的細分市場。
儘管每個生物製藥批次都需要消耗數平方公尺的薄膜,濾材仍佔據主導地位,但配件如今已成為利潤成長的主要驅動力。將精密過濾器與移液器底座成套銷售,既能確保售後市場收入,也能抑制第三方替代品的使用。 「過濾組件」(包括即插即用的膠囊式過濾器和切向流撬裝設備)則介於兩者之間,並正獲得優先考慮快速技術轉移而非客製化設計的合約研發生產機構(CDMO)的支援。隨著一次性產品的普及,實驗室過濾組件市場預計將會擴張,但由於組件更換週期較長,其成長速度預計將落後於配件的快速成長。
區域分析
預計到2025年,北美將佔全球銷售額的36.24%,這得益於該地區擁有超過1200個GMP生產車間,以及全球細胞治療研發公司最密集的聚集地之一。美國合約研發生產機構(CDMO)正在快速試點下一代膜技術,供應商也向當地客戶提供試點批次的產品,這進一步鞏固了該地區作為早期採用者的地位。加拿大的疫苗舉措為一次性試點工廠提供津貼,推動了對相關配件的需求成長。
亞太地區是成長的主要驅動力,預計到2031年複合年成長率將達到11.63%。中國在2024年批准了47家生物相似藥生產設施,印度在2025年批准了29家生技藥品設施。這些設施正在對一次性生產線進行標準化改造,以滿足美國FDA的出口標準。三星生物製劑和無錫生物製劑透過選擇能夠在48小時內交貨的合作夥伴,提高了超過40萬公升的產能。在日本,混合型一次性模組正在改造到不銹鋼生產線上,以減少與清潔和驗證相關的停機時間,這推動了對膠囊過濾器的需求。
在歐洲,EMA關於連續生產的指導方針推動了穩步擴張,也增加了對線上過濾的需求。德國和瑞士正轉向內部CAR-T平台,這需要為每位患者配備專用過濾器,導致每批成本增加高達50%。在英國,脫歐後與歐盟標準的接軌減輕了供應商的合規負擔。中東和非洲地區目前規模較小,海灣國家承諾在2025年向當地生物製藥產業投資10億美元,並在建立本地製造地之前進口過濾組件。南美洲的巴西和阿根廷正在努力實現疫苗自給自足,Fiocruz計劃於2025年啟用一個5萬公升的綜合設施,配備切向流一次性過濾器。在所有地區,新建設設施都在迅速過渡到一次性設計,加速了實驗室過濾市場對高品質膠囊和組件的採用。
其他好處:
- Excel格式的市場預測(ME)表
- 3個月的分析師支持
目錄
第1章:引言
- 研究假設和市場定義
- 調查範圍
第2章:調查方法
第3章執行摘要
第4章 市場狀況
- 市場概覽
- 市場促進因素
- 增加生技製藥研發支出
- 擴大細胞和基因療法的生產規模
- 一次性過濾組件的迅速普及
- 小型化、高通量篩檢正在推動對過濾的需求。
- CRO 和 CDMO 的發展正在推動經濟高效的過濾組件的開發。
- 實驗室過濾技術的進步
- 市場限制因素
- 高品質薄膜聚合物的供應鏈波動性
- 與一次性塑膠相關的廢棄物處理的合規成本
- 注射器過濾器商品化導致價格承壓。
- 新的 PFAS 法規限制了 PTFE 過濾器的使用。
- 價值供應鏈分析
- 監理情勢
- 技術展望
- 波特五力分析
第5章 市場規模與成長預測
- 依產品類型
- 過濾介質
- 過濾組件
- 過濾配件
- 透過方法
- 微濾
- 超過濾
- 奈米過濾和逆滲透
- 真空/深度過濾
- 其他
- 最終用戶
- 製藥和生物技術公司
- 學術研究機構
- 食品飲料檢驗實驗室
- 環境檢測研究所
- 其他
- 按地區
- 北美洲
- 美國
- 加拿大
- 墨西哥
- 歐洲
- 德國
- 英國
- 法國
- 義大利
- 西班牙
- 其他歐洲國家
- 亞太地區
- 中國
- 日本
- 印度
- 澳洲
- 韓國
- 其他亞太國家
- 中東和非洲
- GCC
- 南非
- 其他中東和非洲國家
- 南美洲
- 巴西
- 阿根廷
- 其他南美國家
- 北美洲
第6章 競爭情勢
- 市場集中度
- 市佔率分析
- 公司簡介
- 3M
- Agilent Technologies Inc.
- Avantor Inc.(VWR)
- Clarcor Industrial Air
- Cobetter Filtration Group
- Cole-Parmer(Antylia Scientific)
- Corning Inc.
- Danaher Corp.(Cytiva & Pall)
- Donaldson Company Inc.
- Eaton Corporation
- GVS SpA
- Membrane Solutions LLC
- Merck KGaA(MilliporeSigma)
- Parker Hannifin Corp.
- Porvair plc
- Repligen Corporation
- Sartorius AG
- Sterlitech Corporation
- Thermo Fisher Scientific Inc.
第7章 市場機會與未來展望
According to Mordor Intelligence, the laboratory filtration market size is estimated at USD 5.01 billion in 2026, and is expected to reach USD 7.58 billion by 2031, at a CAGR of 8.63% during the forecast period (2026-2031).
This report is Segmented by Product Type (Filtration Media, Filtration Assemblies, Filtration Accessories), Technique (Microfiltration, Ultrafiltration, and More), End User (Pharmaceutical & Biotechnology Companies, and More), and Geography (North America, Europe, Asia-Pacific, Middle East & Africa, South America). The Market Forecasts are Provided in Terms of Value (USD).
Global Laboratory Filtration Market Trends and Insights
Accelerating Biopharma R&D Spend
Global pharmaceutical R&D reached USD 244 billion in 2025, a 7.5% increase year-over-year, with biologics accounting for 62% of this expenditure. Each investigational new drug submission now triggers 15-20 sterility and viral clearance validation runs, which translates into a membrane area equivalent to three to five production batches. Contract laboratories experienced a 28% increase in sample throughput for stability testing, prompting procurement managers to negotiate long-term filtration-media agreements that secure price and availability. Regulators continue to refine guidance on process validation, prompting sponsors to repeat studies to meet evolving sterility benchmarks, thereby sustaining membrane consumption. The upshot is a durable baseline of recurring orders that helps the laboratory filtration market weather macroeconomic swings.
Expansion of Cell & Gene Therapy Manufacturing
Approved cell- and gene-therapy products climbed to 37 by end-2025, and 180 programs advanced to Phase II/III, doubling the installed base of GMP suites dedicated to viral-vector work. Lentiviral and AAV purification depend on tangential-flow filtration, with each 50-L bioreactor run consuming around 12 m2 of hollow-fiber membrane. Sartorius reported that cell-therapy customers rose from 11% to 19% of its bioprocess revenue between 2023 and 2025, underlining how the segment reshapes order books. Commercial-scale expansion will require a tenfold increase in filtration capacity by 2028, compelling CDMOs to pre-qualify multiple suppliers. Vendors able to furnish viral-retention data across diverse serotypes enjoy a widening moat in the laboratory filtration market.
Supply-Chain Volatility for High-Grade Membrane Polymers
Polyvinylidene fluoride and polyethersulfone resins originate from just three Asian producers, so any disruption cascades through lead times of 8 to 12 weeks for finished rolls. A typhoon shut down a Taiwan PVDF plant in August 2025, reducing availability by 18% and driving up spot prices for pharmaceutical-grade PES by 23%. Large vendors hedge with multi-year offtake contracts, but mid-tier assemblers endure allocation cuts that erode margins. Regulatory dossiers name specific membrane chemistries, making emergency substitutions costly. Vertical integration, such as Sartorius' 2024 acquisition of a PES compounder, partially insulates top players; however, supply shocks remain a structural headwind for the laboratory filtration market.
Other drivers and restraints analyzed in the detailed report include:
- Rapid Adoption of Single-Use Filtration Assemblies
- Miniaturized High-Throughput Screening Driving Microfiltration Demand
- Waste-Disposal Compliance Costs for Single-Use Plastics
For complete list of drivers and restraints, kindly check the Table Of Contents.
Segment Analysis
Filtration Media captured 57.31% of revenue in 2025, underscoring the centrality of membrane rolls, pleated cartridges, and capsule filters to every stage of bioprocessing. Commoditization of 0.22-µm discs compresses margins, so suppliers differentiate through hydrophilic coatings and charged layers that command 20% premiums. Filtration Accessories, though smaller in value, are forecast to expand at a 10.92% CAGR to 2031 as laboratories automate liquid handling. A single screening robot can process 10,000 syringe filters per day, making accessories the fastest-growing segment of the laboratory filtration market.
Media stays on top because each biologics batch consumes square meters of membrane, but accessories now drive incremental profit. Bundling precision filters with pipetting decks locks in aftermarket revenue and discourages third-party alternatives. Filtration Assemblies, which include plug-and-play capsules and tangential-flow skids, sit between the two extremes, winning favor at CDMOs that prioritize rapid tech transfer over bespoke engineering. The laboratory filtration market size for assemblies is poised to increase in line with the uptake of single-use products; however, its growth rate lags behind the accessory boom due to longer unit replacement cycles.
Complete Report Scope:
- By Product Type
- Filtration Media
- Filtration Assemblies
- Filtration Accessories
- By Technique
- Microfiltration
- Ultrafiltration
- Nanofiltration & Reverse Osmosis
- Vacuum / Depth Filtration
- Others
- By End User
- Pharmaceutical & Biotechnology Companies
- Academic & Research Institutes
- Food & Beverage Testing Laboratories
- Environmental Testing Laboratories
- Others
- By Geography
- North America
- United States
- Canada
- Mexico
- Europe
- Germany
- United Kingdom
- France
- Italy
- Spain
- Rest of Europe
- Asia-Pacific
- China
- Japan
- India
- Australia
- South Korea
- Rest of Asia-Pacific
- Middle East & Africa
- GCC
- South Africa
- Rest of Middle East & Africa
- South America
- Brazil
- Argentina
- Rest of South America
- North America
Geography Analysis
North America held 36.24% revenue in 2025, backed by more than 1,200 GMP suites and the world's densest cluster of cell-therapy developers. U.S. CDMOs trial next-generation membranes first, so suppliers channel pilot lots to local customers, reinforcing the region's status as an early adopter. Canada's vaccine initiative funnels grants into single-use, ready-to-pilot plants, expanding the pull of accessories.
The Asia-Pacific region is the growth engine, with an 11.63% CAGR projected through 2031. China licensed 47 biosimilar plants in 2024, and India approved 29 biologics facilities in 2025 that standardized on disposable trains to satisfy U.S. FDA export norms. Samsung Biologics and WuXi Biologics added over 400,000 L of capacity, selecting partners who can deliver within 48 hours. Japan retrofits stainless steel lines with hybrid single-use modules to reduce cleaning and validation downtime, spurring demand for capsule filters.
Europe expands steadily, driven by EMA guidance on continuous manufacturing, which heightens the need for inline filtration. Germany and Switzerland are pivoting to autologous CAR-T platforms, so each patient lot requires dedicated filters, which lifts per-lot spend by up to 50%. The United Kingdom's post-Brexit convergence with EU standards eases supplier compliance. The Middle East & Africa are smaller today, yet Gulf states pledged USD 1 billion in 2025 for local biopharma, importing filtration assemblies until regional conversion plants emerge. South America's Brazil and Argentina push vaccine self-reliance; Fiocruz opened a 50,000-L complex in 2025 fitted with tangential-flow disposables. Across all regions, greenfield facilities leapfrog to single-use, accelerating the adoption of premium capsules and assemblies in the laboratory filtration market.
- 3M
- Agilent Technologies
- Avantor Inc. (VWR)
- Clarcor Industrial Air
- Cobetter Filtration Group
- Cole-Parmer (Antylia Scientific)
- Corning
- Danaher Corp. (Cytiva & Pall)
- Donaldson Company Inc.
- Eaton
- GVS
- Membrane Solutions LLC
- Merck KGaA (MilliporeSigma)
- Parker Hannifin
- Porvair plc
- Repligen
- Sartorius
- Sterlitech
- Thermo Fisher Scientific
Additional Benefits:
- The market estimate (ME) sheet in Excel format
- 3 months of analyst support
TABLE OF CONTENTS
1 Introduction
- 1.1 Study Assumptions & Market Definition
- 1.2 Scope of the Study
2 Research Methodology
3 Executive Summary
4 Market Landscape
- 4.1 Market Overview
- 4.2 Market Drivers
- 4.2.1 Accelerating Biopharma R&D Spend
- 4.2.2 Expansion of Cell & Gene Therapy Manufacturing
- 4.2.3 Rapid Adoption of Single-Use Filtration Assemblies
- 4.2.4 Miniaturized High-Throughput Screening Driving Microfiltration Demand
- 4.2.5 Growth of CROs & CDMOs Boosting Cost-Effective Filtration Assemblies
- 4.2.6 Technological Advancements in Laboratory Filtration
- 4.3 Market Restraints
- 4.3.1 Supply-Chain Volatility for High-Grade Membrane Polymers
- 4.3.2 Waste-Disposal Compliance Costs for Single-Use Plastics
- 4.3.3 Price Pressure from Commoditization of Syringe Filters
- 4.3.4 Emerging PFAS Regulations Limiting PTFE Filter Use
- 4.4 Value / Supply-Chain Analysis
- 4.5 Regulatory Landscape
- 4.6 Technological Outlook
- 4.7 Porter's Five Forces Analysis
- 4.7.1 Threat of New Entrants
- 4.7.2 Bargaining Power of Buyers
- 4.7.3 Bargaining Power of Suppliers
- 4.7.4 Threat of Substitutes
- 4.7.5 Competitive Rivalry
5 Market Size & Growth Forecasts
- 5.1 By Product Type
- 5.1.1 Filtration Media
- 5.1.2 Filtration Assemblies
- 5.1.3 Filtration Accessories
- 5.2 By Technique
- 5.2.1 Microfiltration
- 5.2.2 Ultrafiltration
- 5.2.3 Nanofiltration & Reverse Osmosis
- 5.2.4 Vacuum / Depth Filtration
- 5.2.5 Others
- 5.3 By End User
- 5.3.1 Pharmaceutical & Biotechnology Companies
- 5.3.2 Academic & Research Institutes
- 5.3.3 Food & Beverage Testing Laboratories
- 5.3.4 Environmental Testing Laboratories
- 5.3.5 Others
- 5.4 By Geography
- 5.4.1 North America
- 5.4.1.1 United States
- 5.4.1.2 Canada
- 5.4.1.3 Mexico
- 5.4.2 Europe
- 5.4.2.1 Germany
- 5.4.2.2 United Kingdom
- 5.4.2.3 France
- 5.4.2.4 Italy
- 5.4.2.5 Spain
- 5.4.2.6 Rest of Europe
- 5.4.3 Asia-Pacific
- 5.4.3.1 China
- 5.4.3.2 Japan
- 5.4.3.3 India
- 5.4.3.4 Australia
- 5.4.3.5 South Korea
- 5.4.3.6 Rest of Asia-Pacific
- 5.4.4 Middle East & Africa
- 5.4.4.1 GCC
- 5.4.4.2 South Africa
- 5.4.4.3 Rest of Middle East & Africa
- 5.4.5 South America
- 5.4.5.1 Brazil
- 5.4.5.2 Argentina
- 5.4.5.3 Rest of South America
- 5.4.1 North America
6 Competitive Landscape
- 6.1 Market Concentration
- 6.2 Market Share Analysis
- 6.3 Company Profiles (includes Global level Overview, Market-level Overview, Core Segments, Financials, Strategic Information, Market Rank/Share, Products & Services, Recent Developments)
- 6.3.1 3M
- 6.3.2 Agilent Technologies Inc.
- 6.3.3 Avantor Inc. (VWR)
- 6.3.4 Clarcor Industrial Air
- 6.3.5 Cobetter Filtration Group
- 6.3.6 Cole-Parmer (Antylia Scientific)
- 6.3.7 Corning Inc.
- 6.3.8 Danaher Corp. (Cytiva & Pall)
- 6.3.9 Donaldson Company Inc.
- 6.3.10 Eaton Corporation
- 6.3.11 GVS S.p.A
- 6.3.12 Membrane Solutions LLC
- 6.3.13 Merck KGaA (MilliporeSigma)
- 6.3.14 Parker Hannifin Corp.
- 6.3.15 Porvair plc
- 6.3.16 Repligen Corporation
- 6.3.17 Sartorius AG
- 6.3.18 Sterlitech Corporation
- 6.3.19 Thermo Fisher Scientific Inc.
7 Market Opportunities & Future Outlook
- 7.1 White-space & Unmet-need Assessment

 實驗室過濾市場:2026-2032年全球市場預測(按產品類型、過濾技術、過濾材料、應用和最終用戶分類)
 先進過濾材料市場預測至2034年—按材料類型、過濾類型、技術、應用、最終用戶和地區分類的全球分析
 實驗室過濾市場規模、佔有率和趨勢分析報告:按技術、產品、地區和細分市場分類(2026-2033 年)
 實驗室過濾市場:依技術、產品和地區分類
 實驗室過濾市場規模、佔有率、趨勢和預測:按產品類型、技術、最終用戶和地區分類,2026-2034年
 全球實驗室過濾設備市場規模、佔有率、趨勢和成長分析報告(2026-2034)雙蒸餾水蒸餾器市場:按產品類型、容量、技術、最終用戶、應用和分銷管道分類,全球預測(2026-2032年)
 實驗室過濾市場分析及預測(至2035年):依類型、產品、技術、應用、材質、最終用戶、製程、設備及功能分類
 實驗室過濾市場規模、佔有率和成長分析(按產品類型、技術、最終用戶和地區分類)-2026-2033年產業預測
 全球實驗室過濾市場,2025-2029