

 |
市場調查報告書
商品編碼
2122532
記憶體內:市場佔有率分析、行業趨勢和統計數據、成長預測(2026-2031 年)In-Memory Database - Market Share Analysis, Industry Trends & Statistics, Growth Forecasts (2026 - 2031) |
||||||

※ 本網頁內容可能與最新版本有所差異。詳細情況請與我們聯繫。
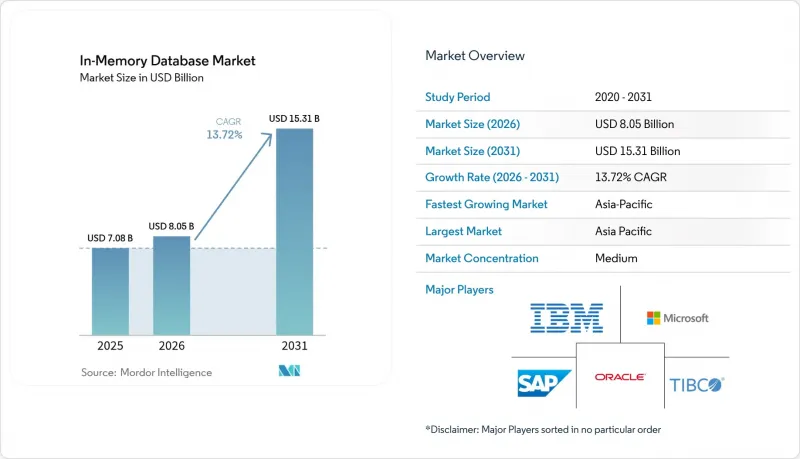
根據 Mordor Intelligence 預測,記憶體內市場規模將從 2025 年的 70.8 億美元成長到 2026 年的 80.5 億美元,然後在 2031 年達到 153.1 億美元,2026 年至 2031 年的複合年成長率為 13.72%。
本報告按處理方法(OLTP、OLAP、HTAP)、部署模式(本地部署等)、資料模型(SQL、NoSQL、多模型)、組織規模(中小企業和大型企業)、應用程式(即時交易處理等)、最終用戶業(銀行、金融服務和保險、電信和IT等)以及地區(北美、歐洲、亞太、南美、中東和非洲)進行分類。
全球記憶體內市場趨勢與洞察
需要亞毫秒延遲的雲端原生微服務
雲端原生技術的採用重新定義了效能標準,容器化微服務需要微秒的資料存取。會話儲存、個人化引擎和高頻交易平台從基於磁碟的資料庫遷移到以記憶體為中心的存儲,因為延遲每增加一毫秒都會降低轉換率和交易利潤。 Dragonfly 在 AWS Graviton3E 晶片上實現了每秒 643 萬次操作,凸顯了目前資料庫層效能的極限。從單體架構遷移到分散式系統的金融機構和數位商務企業,由於回應時間的縮短,收入顯著成長,這再次印證了這個促進因素在短期內的重要性。
DRAM 和持久性記憶體成本的下降正在擴大總體擁有成本 (TCO) 的差距。
儘管DDR4和DDR5記憶體模組的全球現貨價格持續下降,但三星的CXL混合記憶體模組原型憑藉其兼具DRAM級延遲和持久性的出色性價比脫穎而出。超大規模業者透過跨機架記憶體池化,減少了閒置容量和備援週期。隨著與固態硬碟陣列的價格差距縮小,各公司藍圖,轉向記憶體內部署,尤其是在服務等級協定(SLA)視窗要求嚴格的分析工作負載方面。這種趨勢在亞太地區的製造地尤其明顯,這些工廠正在將大規模歷史資料集載入記憶體中,用於即時數位孿生分析。
圍繞專有格式的供應商鎖定問題令人擔憂
2024 年 Redis 授權協議的變更加劇了買家對專有格式的擔憂,促使 AWS、Google 和 Oracle 轉而支持 Linux 基金會的 Valkey 分支。企業在為多年資料庫專案製定預算時,由於需要考慮遷移成本,因此放慢了採購週期。一些企業採用了多資料庫編配層來降低風險,但這種抽象增加了延遲,部分抵消了記憶體速度的優勢。
細分市場分析
2025年,OLTP(線上事務處理)領域佔據了記憶體內市場佔有率的44.85%,凸顯了銀行、電子商務和ERP系統整體高度一致的事務性工作負載的持續依賴。由於關鍵任務記錄仍需符合ACID標準,且企業願意為實現亞毫秒的資料提交支付更高的效能溢價,因此市場需求依然強勁。雖然OLAP(線上分析處理)的採用解決了現有商業智慧的前端問題,但隨著分析轉向更靈活的引擎,其成長速度有所放緩。
隨著企業尋求透過單一平台實現簡化,HTAP 預計將在 2026 年至 2031 年間以 20.68% 的複合年成長率成長。 GridGain 的平台速度比基於磁碟的系統快 1000 倍,同時保持對 ANSI SQL-99 的支援。 HTAP 是即時風險計算和供應鏈孿生模型的理想架構,這些應用需要同時進行讀寫操作。這種融合釋放了先前各自獨立的營運和分析部門的預算,推動記憶體內市場朝向整合設計方向發展。
在受監管行業,對資料儲存位置的完全控制以及客製化高可用性 (HA) 架構的需求,導致本地部署在 2025 年的收入佔比高達 55.15%。傳統企業軟體堆疊與本地資料庫緊密整合,即使公共雲端成熟,它們仍然是支出的主要來源。然而,隨著數位化原生企業採用託管服務以避免基礎架構管理,雲端採用率也不斷提高。
在聯網汽車和工業物聯網閘道器的推動下,邊緣和嵌入式環境中的部署預計將以 22.55% 的複合年成長率成長。現代汽車每年產生約 300 TB 的數據,因此車載處理對於自動駕駛功能至關重要。 TDengine 在智慧汽車遙測資料方面實現了比 Elasticsearch 高 10 倍的壓縮率,從而降低了上行傳輸頻寬。製造商正在生產線上採用類似的策略來即時檢測缺陷。這種轉變表明,效能提升(曾經僅限於資料中心)如今在邊緣端也至關重要,從而推動了記憶體內市場佔有率的擴大。
區域分析
預計到2025年,亞太地區將錄得31.95%的最大區域銷售成長,複合年成長率(CAGR)為16.65%。中國、日本和印度的國家級「工業4.0」計畫加速了工廠自動化進程,這需要記憶體內歷史資料庫來實現亞秒的MES回饋迴路。通用汽車(GM)在其MES 4.0實施中連接了超過10萬個營運技術(OT)介面,展示了邊緣部署的規模。 Nautilus Technologies等本土供應商提供的先進關係型引擎正在減少對外國智慧財產權(IP)的依賴。
北美已形成一個成熟且充滿創新活力的市場,Oracle核心業務包括金融服務、超大規模雲端運算和自動駕駛汽車研發。 Oracle 和 Google 加強了夥伴關係,使Oracle資料庫服務能夠在 Google Cloud 上原生運行,將企業級 SQL 功能與人工智慧加速器結合。該地區的創業投資資金推動了競爭,並扶持了像 Dragonfly 這樣的新興企業。
在歐洲,遵守基於GDPR的資料主權法規成為首要任務,加速了混合雲端的普及,同時,本地叢集與本地資料中心託管服務的結合也備受青睞。為了滿足資料居住法規的要求, Oracle將Database@Azure的覆蓋範圍擴展到了歐盟的更多地區。同樣在歐洲大陸,醫療保健產業對HTAP資料庫的採用也在穩步推進,以在嚴格的隱私框架下實現人工智慧診斷。
在中東和非洲,為智慧城市建設而進行的光纖和5G骨幹網路投資,推動了工業物聯網(IIoT)試點部署,而這些部署需要即時分析功能。在南美洲,採礦業和數位銀行業取得了進展,對低延遲詐欺偵測的需求促使高效能、以記憶體為中心的系統得到應用。儘管這兩個地區的絕對支出仍然不高,但這兩位數的成長率擴大了全球記憶體內市場的多元化。
其他好處:
- Excel格式的市場預測(ME)表
- 3個月的分析師支持
目錄
第1章:引言
- 研究假設和市場定義
- 調查範圍
第2章:調查方法
第3章執行摘要
第4章 市場狀況
- 市場概覽
- 市場促進因素
- 需要亞毫秒延遲的雲端原生微服務
- DRAM 和持久記憶體價格的下降正在拉大與磁碟的總擁有成本差距。
- 金融服務業 (BFSI) 以及通訊業中用於詐欺預防和網路服務品質 (QoS) 的串流分析的引入。
- HTAP架構加速AI/ML模型在醫療領域的交付
- 邊緣運算需要嵌入式IMDB的應用案例(聯網汽車、工業物聯網)
- 市場限制因素
- 擔心專有記憶體內格式會導致廠商鎖定。
- 超過 40 TB 的叢集中高可用性設計的複雜性
- 限制全球複製的資料主權法律(例如,中國的《網路安全法》、歐盟的《一般資料保護條例》等)
- 價值鏈分析
- 監管和技術展望
- 波特五力分析
- 宏觀經濟因素對市場的影響
第5章 市場規模與成長預測
- 透過加工方法
- OLTP
- OLAP
- 混合事務/分析處理(HTAP)
- 部署模式
- 現場
- 雲
- 邊緣/嵌入式
- 按資料模型
- 關係型(SQL)
- NoSQL(鍵值、文件、圖)
- 多重模型
- 按組織規模
- 中小企業
- 大公司
- 透過使用
- 即時交易處理
- 營運分析和商業智慧儀錶板
- 人工智慧/機器學習模型服務
- 快取和會話存儲
- 按最終用戶行業分類
- BFSI
- 通訊/IT
- 零售與電子商務
- 醫療保健和生命科學
- 製造和工業IoT
- 媒體與娛樂
- 政府/國防
- 其他(能源、教育等)
- 按地區
- 北美洲
- 美國
- 加拿大
- 墨西哥
- 歐洲
- 德國
- 法國
- 英國
- 北歐的
- 其他歐洲國家
- 亞太地區
- 中國
- 台灣
- 韓國
- 日本
- 印度
- 其他亞太國家
- 南美洲
- 巴西
- 墨西哥
- 阿根廷
- 其他南美國家
- 中東和非洲
- 中東
- 沙烏地阿拉伯
- 阿拉伯聯合大公國
- 土耳其
- 其他中東國家
- 非洲
- 南非
- 其他非洲國家
- 中東
- 北美洲
第6章 競爭情勢
- 市場集中度
- 策略趨勢
- 市佔率分析
- 公司簡介
- SAP SE
- Oracle Corp.
- Microsoft Corp.
- IBM Corp.
- Redis Ltd.(Redis Enterprise)
- Aerospike Inc.
- VoltDB Inc.
- Couchbase Inc.
- DataStax Inc.
- Hazelcast Inc.
- MemVerge Inc.
- Altibase Corp.
- GridGain Systems Inc.
- Raima Inc.
- McObject LLC
- Pivotal(VMware Tanzu GemFire)
- Amazon Web Services(Amazon ElastiCache & MemoryDB)
- Google Cloud(AlloyDB, Memorystore)
- Alibaba Cloud(ApsaraDB Tair)
- Huawei Cloud(GaussDB IM)
- Tencent Cloud(Tendis)
第7章 市場機會與未來展望
According to Mordor Intelligence, the in-Memory database market size is expected to grow from USD 7.08 billion in 2025 to USD 8.05 billion in 2026 and is forecast to reach USD 15.31 billion by 2031 at 13.72% CAGR over 2026-2031.
This report is Segmented by Processing Type (OLTP, OLAP, and HTAP), Deployment Mode (On-Premise, and More), Data Model (SQL, Nosql, and Multi-Model), Organization Size (SMEs, and Large Enterprises), Application (Real-Time Transaction Processing, and More), End-User Industry (BFSI, Telecommunications and IT, and More), and Geography (North America, Europe, Asia-Pacific, South America, and Middle East and Africa).
Global In-Memory Database Market Trends and Insights
Cloud-Native Microservices Demanding Sub-Millisecond Latency
Cloud-native adoption reshaped performance baselines as containerized microservices needed data access in microseconds. Session stores, personalization engines, and high-frequency trading platforms shifted from disk-backed databases to memory-centric stores because every millisecond of delay reduced conversion rates or trading profit. Dragonfly demonstrated 6.43 million operations per second on AWS Graviton3E silicon, highlighting the ceiling now expected from database tiers. Financial institutions and digital commerce operators that migrated monoliths to distributed systems saw response-time improvements translate into tangible revenue gains, reinforcing the driver's near-term importance.
Falling DRAM and Persistent Memory Costs Widening TCO Gap
Global spot pricing of DDR4 and DDR5 modules continued to slide, while Samsung's CXL Memory Module Hybrid prototype showed DRAM-class latency with persistence, creating a compelling cost profile. Hyperscale operators pooled memory across racks, reducing stranded capacity and backup cycles. Enterprises pivoted roadmaps toward in-memory deployment because the premium over SSD arrays narrowed, especially for analytics workloads with tight SLA windows. The effect is visible in Asia-Pacific manufacturing hubs where large historian datasets are moved into memory for real-time digital-twin analytics.
Vendor Lock-in Concerns Around Proprietary Formats
Redis's license change in 2024 heightened buyer wariness of proprietary formats, spurring AWS, Google, and Oracle to back the Valkey fork under the Linux Foundation. Enterprises budgeting multi-year database projects factored in exit costs, slowing purchase cycles. To mitigate risk, some adopted multi-database orchestration layers, but those abstractions introduced latency penalties that partially offset memory-speed gains.
Other drivers and restraints analyzed in the detailed report include:
- Streaming Analytics Adoption in BFSI and Telecom
- HTAP Architectures Accelerating AI/ML Model Serving
- High-Availability Design Complexity for Large Clusters
For complete list of drivers and restraints, kindly check the Table Of Contents.
Segment Analysis
The OLTP segment held 44.85% of the In-Memory Database market share in 2025, underscoring continued reliance on high-integrity transactional workloads across banking, e-commerce, and ERP systems. Demand persisted because mission-critical records still required ACID compliance, with enterprises paying a performance premium for sub-millisecond commits. OLAP deployments addressed established business-intelligence front ends but grew slowly as analytics shifted toward more flexible engines.
HTAP climbed with a 20.68% CAGR forecast from 2026 to 2031 as firms sought single-platform simplicity. GridGain's platform showed up to 1,000X speed-ups over disk-based systems while retaining ANSI SQL-99 support. Real-time risk calculations and supply-chain twins needed simultaneous read-write access, making HTAP the preferred architecture. The convergence unlocked incremental budget from departments earlier siloed between operations and analytics, pushing the In-Memory Database market toward unified designs.
On-premise installations captured 55.15% of 2025 revenue because regulated sectors required full control over data residency and tailored HA architectures. Legacy enterprise software stacks tightly integrated with on-premise databases, anchoring spending even as public clouds mature. Cloud deployments, nonetheless, have advanced as digital-native firms adopted managed services to avoid infrastructure administration.
Edge and embedded deployments displayed a 22.55% CAGR outlook, fueled by connected cars and IIoT gateways. Modern vehicles generate around 300 TB annually, which demands in-vehicle processing for autonomous features. TDengine achieved 10X compression over Elasticsearch in smart-vehicle telemetry, cutting bandwidth for upstream transfers. Manufacturers applied similar strategies on production lines to detect defects instantly. The shift signaled that performance gains once reserved for data centers were now indispensable at the edge, expanding the In-Memory Database market footprint.
Complete Report Scope:
- By Processing Type
- OLTP
- OLAP
- Hybrid Transactional/Analytical Processing (HTAP)
- By Deployment Mode
- On-premise
- Cloud
- Edge/Embedded
- By Data Model
- Relational (SQL)
- NoSQL (Key-Value, Document, Graph)
- Multi-model
- By Organization Size
- Small and Medium Enterprises (SMEs)
- Large Enterprises
- By Application
- Real-time Transaction Processing
- Operational Analytics and BI Dashboards
- AI/ML Model Serving
- Caching and Session Stores
- By End-user Industry
- BFSI
- Telecommunications and IT
- Retail and E-commerce
- Healthcare and Life Sciences
- Manufacturing and Industrial IoT
- Media and Entertainment
- Government and Defense
- Others (Energy, Education, etc.)
- By Geography
- North America
- United States
- Canada
- Mexico
- Europe
- Germany
- France
- United Kingdom
- Nordics
- Rest of Europe
- Asia-Pacific
- China
- Taiwan
- South Korea
- Japan
- India
- Rest of Asia-Pacific
- South America
- Brazil
- Mexico
- Argentina
- Rest of South America
- Middle East and Africa
- Middle East
- Saudi Arabia
- United Arab Emirates
- Turkey
- Rest of Middle East
- Africa
- South Africa
- Rest of Africa
- Middle East
- North America
Geography Analysis
Asia-Pacific recorded the largest regional revenue at 31.95% in 2025 and maintained a 16.65% CAGR outlook. National Industry 4.0 programs in China, Japan, and India spurred factory automation that required in-memory historian databases for sub-second MES feedback loops. General Motors linked more than 100,000 operational technology connections in its MES 4.0 rollout, illustrating the scale of edge deployments. Local vendors such as Nautilus Technologies' advanced indigenous relational engines, reducing reliance on foreign IP.
North America formed a mature but innovation-rich market centered on financial services, hyperscale clouds, and autonomous-vehicle R&D. Oracle and Google deepened their partnership to run Oracle Database services natively on Google Cloud, marrying enterprise SQL capabilities with AI accelerators. The region's venture funding supported emerging players such as Dragonfly, intensifying competitive churn.
Europe prioritized data-sovereignty compliance under GDPR, driving hybrid cloud adoption and favoring on-premise clusters combined with managed services in local data centers. Oracle expanded Database@Azure coverage to additional EU regions to satisfy residency rules. The continent also saw healthcare deployments of HTAP databases to power AI diagnostics under strict privacy frameworks.
The Middle East and Africa invested in smart-city fiber and 5G backbones, leading to pilot IIoT deployments that require real-time analytics. South America gained traction in mining operations and digital banking, where low-latency fraud detection justified premium memory-centric systems. Though absolute spend in these two regions remained modest, double-digit growth expanded the In-Memory Database market's global diversity.
- SAP SE
- Oracle Corp.
- Microsoft Corp.
- IBM Corp.
- Redis Ltd. (Redis Enterprise)
- Aerospike Inc.
- VoltDB Inc.
- Couchbase Inc.
- DataStax Inc.
- Hazelcast Inc.
- MemVerge Inc.
- Altibase Corp.
- GridGain Systems Inc.
- Raima Inc.
- McObject LLC
- Pivotal (VMware Tanzu GemFire)
- Amazon Web Services (Amazon ElastiCache & MemoryDB)
- Google Cloud (AlloyDB, Memorystore)
- Alibaba Cloud (ApsaraDB Tair)
- Huawei Cloud (GaussDB IM)
- Tencent Cloud (Tendis)
Additional Benefits:
- The market estimate (ME) sheet in Excel format
- 3 months of analyst support
TABLE OF CONTENTS
1 INTRODUCTION
- 1.1 Study Assumptions and Market Definition
- 1.2 Scope of the Study
2 RESEARCH METHODOLOGY
3 EXECUTIVE SUMMARY
4 MARKET LANDSCAPE
- 4.1 Market Overview
- 4.2 Market Drivers
- 4.2.1 Cloud-native micro-services demanding sub-millisecond latency
- 4.2.2 Falling DRAM and persistent-memory USD/GB widening TCO gap vs. disk
- 4.2.3 Streaming analytics adoption in BFSI and telecom for fraud and network QoS
- 4.2.4 HTAP architectures accelerating AI/ML model-serving in healthcare
- 4.2.5 Edge-compute use-cases (connected vehicles, IIoT) requiring embedded IMDB
- 4.3 Market Restraints
- 4.3.1 Vendor lock-in concerns around proprietary in-memory formats
- 4.3.2 High-availability design complexity for >40 TB clusters
- 4.3.3 Data-sovereignty laws (e.g., China CSL, EU GDPR) limiting global replication
- 4.4 Value Chain Analysis
- 4.5 Regulatory or Technological Outlook
- 4.6 Porter's Five Forces Analysis
- 4.6.1 Threat of New Entrants
- 4.6.2 Bargaining Power of Buyers/Consumers
- 4.6.3 Bargaining Power of Suppliers
- 4.6.4 Threat of Substitute Products
- 4.6.5 Intensity of Competitive Rivalry
- 4.7 Impact of macroeconomoic factors on the market
5 MARKET SIZE AND GROWTH FORECASTS (VALUE)
- 5.1 By Processing Type
- 5.1.1 OLTP
- 5.1.2 OLAP
- 5.1.3 Hybrid Transactional/Analytical Processing (HTAP)
- 5.2 By Deployment Mode
- 5.2.1 On-premise
- 5.2.2 Cloud
- 5.2.3 Edge/Embedded
- 5.3 By Data Model
- 5.3.1 Relational (SQL)
- 5.3.2 NoSQL (Key-Value, Document, Graph)
- 5.3.3 Multi-model
- 5.4 By Organization Size
- 5.4.1 Small and Medium Enterprises (SMEs)
- 5.4.2 Large Enterprises
- 5.5 By Application
- 5.5.1 Real-time Transaction Processing
- 5.5.2 Operational Analytics and BI Dashboards
- 5.5.3 AI/ML Model Serving
- 5.5.4 Caching and Session Stores
- 5.6 By End-user Industry
- 5.6.1 BFSI
- 5.6.2 Telecommunications and IT
- 5.6.3 Retail and E-commerce
- 5.6.4 Healthcare and Life Sciences
- 5.6.5 Manufacturing and Industrial IoT
- 5.6.6 Media and Entertainment
- 5.6.7 Government and Defense
- 5.6.8 Others (Energy, Education, etc.)
- 5.7 By Geography
- 5.7.1 North America
- 5.7.1.1 United States
- 5.7.1.2 Canada
- 5.7.1.3 Mexico
- 5.7.2 Europe
- 5.7.2.1 Germany
- 5.7.2.2 France
- 5.7.2.3 United Kingdom
- 5.7.2.4 Nordics
- 5.7.2.5 Rest of Europe
- 5.7.3 Asia-Pacific
- 5.7.3.1 China
- 5.7.3.2 Taiwan
- 5.7.3.3 South Korea
- 5.7.3.4 Japan
- 5.7.3.5 India
- 5.7.3.6 Rest of Asia-Pacific
- 5.7.4 South America
- 5.7.4.1 Brazil
- 5.7.4.2 Mexico
- 5.7.4.3 Argentina
- 5.7.4.4 Rest of South America
- 5.7.5 Middle East and Africa
- 5.7.5.1 Middle East
- 5.7.5.1.1 Saudi Arabia
- 5.7.5.1.2 United Arab Emirates
- 5.7.5.1.3 Turkey
- 5.7.5.1.4 Rest of Middle East
- 5.7.5.2 Africa
- 5.7.5.2.1 South Africa
- 5.7.5.2.2 Rest of Africa
- 5.7.5.1 Middle East
- 5.7.1 North America
6 COMPETITIVE LANDSCAPE
- 6.1 Market Concentration
- 6.2 Strategic Moves
- 6.3 Market Share Analysis
- 6.4 Company Profiles (includes Global level Overview, Market level overview, Core Segments, Financials as available, Strategic Information, Market Rank/Share for key companies, Products and Services, and Recent Developments)
- 6.4.1 SAP SE
- 6.4.2 Oracle Corp.
- 6.4.3 Microsoft Corp.
- 6.4.4 IBM Corp.
- 6.4.5 Redis Ltd. (Redis Enterprise)
- 6.4.6 Aerospike Inc.
- 6.4.7 VoltDB Inc.
- 6.4.8 Couchbase Inc.
- 6.4.9 DataStax Inc.
- 6.4.10 Hazelcast Inc.
- 6.4.11 MemVerge Inc.
- 6.4.12 Altibase Corp.
- 6.4.13 GridGain Systems Inc.
- 6.4.14 Raima Inc.
- 6.4.15 McObject LLC
- 6.4.16 Pivotal (VMware Tanzu GemFire)
- 6.4.17 Amazon Web Services (Amazon ElastiCache & MemoryDB)
- 6.4.18 Google Cloud (AlloyDB, Memorystore)
- 6.4.19 Alibaba Cloud (ApsaraDB Tair)
- 6.4.20 Huawei Cloud (GaussDB IM)
- 6.4.21 Tencent Cloud (Tendis)
7 MARKET OPPORTUNITIES AND FUTURE OUTLOOK
- 7.1 White-space and Unmet-Need Assessment

 2026年全球記憶體內資料庫市場報告
 記憶體內資料庫市場報告:按資料類型、應用程式、最終用戶、產業和地區分類(2026-2034 年)
 記憶體內市場:按處理類型、資料類型、資料結構、應用、部署模式、組織規模和產業分類-2026-2032年全球市場預測
 記憶體內市場規模、佔有率和成長分析(按應用程式、資料類型、處理類型、部署模式、組織規模、垂直產業和地區分類)-2026-2033年產業預測
 記憶體內全球市場規模、佔有率和趨勢分析:按處理類型、部署模型、應用程式、公司規模、行業、地區、前景和預測,2024-2031
 全球記憶體資料庫市場規模(按地區、範圍和預測)