


 |
市場調查報告書
商品編碼
2122520
透明電子產品:市場佔有率分析、產業趨勢與統計、成長預測(2026-2031)Transparent Electronics - Market Share Analysis, Industry Trends & Statistics, Growth Forecasts (2026 - 2031) |
||||||

※ 本網頁內容可能與最新版本有所差異。詳細情況請與我們聯繫。
據 Mordor Intelligence 稱,2025 年透明電子產品市場價值 27.8 億美元,預計到 2031 年將從 2026 年的 33.7 億美元成長到 88.6 億美元,預測期(2026-2031 年)複合年成長率為 21.30%。
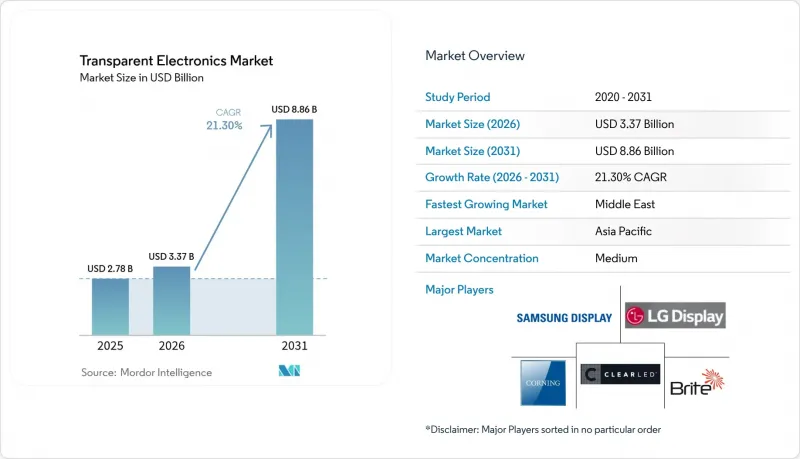
本報告按產品類型(透明顯示器、透明太陽能板、智慧產品等)、材料類型(氧化銦錫 (ITO)、其他透明導電氧化物 (AZO、FTO) 等)、技術(LCD/TFT 等)、終端用戶應用(消費電子、汽車與交通運輸、航太與國防等)以及地區進行細分。市場預測以美元 (USD) 為單位。
全球透明電子產品市場趨勢與洞察
淨零排放建築標準促進了智慧窗戶的普及。
歐洲法規要求所有新建建築到2030年達到「近零能耗」標準,這迫使建築師採用能夠動態調節太陽輻射熱增益的電致變色玻璃。德國和斯堪地那維亞的試點計畫表明,冷凍能耗降低了20%以上,最新的流體電致變色設計還具備根據季節將室內溫度調節5度度C的功能。與大樓自動化系統的整合正逐漸成為標準配置,這不僅為面板製造商開闢了新的收入來源,也為感測器和控制設備供應商帶來了新的商機。國家維修計畫為建築外圍護結構維修(包括智慧窗戶)撥出專案預算,進一步增強了中期成長前景。
自動駕駛汽車正在加速透明顯示器的普及應用。
汽車製造商正致力於推出大型透明抬頭顯示器(HUD),將導航、駕駛輔助和資訊娛樂數據直接投射到擋風玻璃上。近期推出的微型LED原型產品在保持1000尼特亮度的同時,實現了85%的透明度,克服了傳統抬頭顯示器在陽光變化時產生的眩光問題。這項性能符合美國、日本和歐盟嚴格的駕駛員分心預防和安全標準,因此有望應用於計劃於2026年上市的中型電動車(EV)。隨著L3級自動駕駛技術的普及,對抬頭顯示器的短期需求進一步成長,因為L3級自動駕駛需要更廣闊的視野來顯示系統狀態資訊。
銦供應的脆弱性威脅著生產的穩定性。
ITO仍然是主要的透明導電材料,但由於超過一半的精煉銦來自單一國家,因此面板製造商面臨著每年超過30%的現貨價格劇烈波動。這些價格上漲正在擠壓顯示器製造商的利潤空間,並推遲他們擴大產能的決策。為了應對這項挑戰,材料製造商提案了銀奈米線作為替代方案,其透光率可達90%,電阻低於30Ω/sq,並能承受1000次彎曲循環。然而,這種轉變需要新的固化溫度和圖形化化學品,量產認證週期也正在延長。
細分市場分析
2025年,透明顯示器佔據了最大的銷售佔有率,達到42.65%。但受鼓勵自發電的建築規範推動,預計到2031年,透明太陽能板的複合年成長率將達到25.05%。一家瑞士創投公司推出了一款400瓦的類玻璃光電模組,可與標準建築立面無縫融合,且不影響美觀。太陽能板中透明電子元件的市場規模預計到2031年將達到22.6億美元,這反映了其兼具發電和聚光功能的雙重作用。產品多元化發展至今,已擴展到可作為觸控感測器和加熱器基材的透明導電薄膜,以及用於航太領域屏蔽的堅固透明陶瓷。具有動態著色功能的智慧窗戶單元在商業房地產領域持續受到青睞,這得益於其營運成本的降低以及在氣候溫暖地區不到五年的投資回收期。
在透明電子市場,產品類型之間的互通性變得日益重要。新興的串聯太陽能電池共用微型LED背板和沈積設備,從而實現了多用途生產線。整合到汽車擋風玻璃中的透明感測器開始向高級駕駛輔助系統(ADAS)提供乘員和環境數據,這表明產品價值正從單一組件轉向整合功能。
截至2025年,氧化銦錫(ITO)將佔據透明電子市場51.35%的佔有率,鞏固其在液晶顯示器/薄膜電晶體(LCD/TFT)和觸控面板供應鏈中的穩固地位。然而,銀奈米線複合材料和金屬網格預計將逐步蠶食ITO的主導地位,到2031年,其市場佔有率將以21.90%的複合年成長率成長。實驗室裝置已證明,在90%透光率下,ITO的薄片電阻為26 Ω/sq,即使在120%的應變下,電阻漂移也僅為10%,使其適用於折疊式智慧型手機和電子皮膚貼片等應用。針對特定應用進行最佳化是材料選擇的指南。導電聚合物,例如聚對苯二甲酸乙二醇酯(PEDOT)和聚苯乙烯磺酸鈉(PSS),目前正被塗覆在射出成型成型的塑膠基板上,用於製造低成本的軟性顯示器;而石墨烯則可解決穿戴式生物感測器中的溫度控管和訊號均勻性難題。透明陶瓷在惡劣環境下的光學應用中已佔據一席之地,而奈米碳管混合物正逐漸成為電磁屏蔽層的可行選擇,因為在電磁屏蔽層中光學透明度至關重要。
區域分析
亞太地區擁有大型顯示器製造工廠,並擁有全球規模最大的建築光伏一體化(BIPV)項目,預計到2025年將佔全球銷售額的42.80%。政府將城市空氣品質目標與可再生能源裝置容量掛鉤的獎勵,正在推動上海、深圳等主要城市採用透明太陽能帷幕。日本和韓國公司在OLED研發方面主導,不斷推出在透光率和像素密度方面樹立新標竿的原型產品。
在北美,該公司憑藉其在自動駕駛汽車軟體領域的領先地位,正在加速推動市場對透明抬頭顯示器(HUD)和配備眾多感測器的擋風玻璃的需求。儘管各州的建築節能法規有所不同,但總體而言,這些法規正在推動商業建築維修中電致變色玻璃的應用。歐洲嚴格的2030年氣候議程將智慧玻璃和建築整合太陽能(BIPV)置於維修資金的核心位置,促使幕牆建造商和材料專家之間進行大量跨國合作。
在中東和非洲地區,將數位電子看板、自適應遮陽系統和太陽能玻璃融入地標性項目的智慧城市投資預計將在2026年至2031年間以22.15%的複合年成長率成長。沙烏地阿拉伯的「2030願景」已撥款數十億美元用於身臨其境型文化遺產地,將透明顯示牆與互動內容相結合。拉丁美洲陽光充足,且都市區高層建築建築中已廣泛採用透明太陽能,這代表著一個尚未開發的市場,但供應鏈挑戰和資金籌措成本阻礙了短期內的普及。
其他好處:
- Excel格式的市場預測(ME)表
- 3個月的分析師支持
目錄
第1章:引言
- 研究假設和市場定義
- 調查範圍
第2章:調查方法
第3章執行摘要
第4章 市場狀況
- 市場概覽
- 市場促進因素
- 歐盟的淨零能耗建築規範正在加速智慧窗戶的普及。
- 自動駕駛汽車和電動車駕駛座抬頭顯示器的快速普及(北美)
- 具有擴增實境(AR)功能的透明零售指示牌在亞洲主要城市迅速普及。
- 中國強制推行建築光伏一體化(BIPV)政策,正在推動透明太陽能板的普及。
- 需要軟性、透明導電材料的穿戴式醫療感測器。
- 市場限制因素
- 銦價格波動與供應集中度
- 低良率阻礙了大面積透明OLED面板的大規模生產。
- 歐洲有關重金屬氧化物薄膜的電子廢棄物法規
- 對磁控濺鍍和原子層沉積設備的高資本投入
- 產業生態系分析
- 技術展望
- 波特五力分析
第5章 市場規模與成長預測
- 依產品類型
- 透明顯示器
- 透明太陽能板
- 智慧窗戶/智慧玻璃
- 透明導電膜
- 透明陶瓷和鋁
- 透明感測器及其他
- 依材料類型
- 氧化銦錫(ITO)
- 替代 TCO(AZO、FTO)
- 銀奈米線和金屬網
- 碳基奈米材料(石墨烯、碳奈米管)
- 導電聚合物(PEDOT:PSS)
- 透過技術
- LCD/TFT
- OLED 和微型 OLED
- 量子點和微型LED
- 薄膜太陽能電池(CIGS、鈣鈦礦)
- 電致變色和SPD
- 透過最終用戶應用程式
- 家用電子產品
- 汽車和運輸業
- 架構和基礎設施
- 能源與公共產業(光伏建築整合、農業光伏)
- 航太/國防
- 醫療保健和穿戴式設備
- 零售數位電子看板
- 按地區
- 北美洲
- 美國
- 加拿大
- 墨西哥
- 歐洲
- 德國
- 英國
- 法國
- 義大利
- 西班牙
- 北歐國家(丹麥、瑞典、挪威、芬蘭)
- 其他歐洲國家
- 亞太地區
- 中國
- 日本
- 韓國
- 印度
- 東南亞
- 澳洲
- 其他亞太國家
- 南美洲
- 巴西
- 阿根廷
- 其他南美國家
- 中東
- 波灣合作理事會(GCC)成員國
- 土耳其
- 其他中東國家
- 非洲
- 南非
- 奈及利亞
- 其他非洲國家
- 北美洲
第6章 競爭情勢
- 市場集中度
- 策略趨勢
- 市佔率分析
- 公司簡介
- BOE Technology Group Co., Ltd.
- LG Display Co., Ltd.
- Samsung Display Co., Ltd.
- Corning Incorporated
- AGC Inc.
- NSG Group(Pilkington)
- Saint-Gobain SA
- Ubiquitous Energy Inc.
- Brite Solar Inc.
- ClearLED Ltd.
- Panasonic Holdings Corp.
- Cambrios Technology Corp.
- Surmet Corporation
- 3M Company
- DuPont de Nemours Inc.
- PPG Industries Inc.
- Guardian Industries Holdings
- Shenzhen Nexnovo Technology Co., Ltd.
- Shenzhen AuroLED Technology Co., Ltd.
- Street Communication Inc.
- Apple Inc.(Transparent AR Glass R&D)
- JX Nippon Mining and Metals Corp.
- Heraeus Holding GmbH
- American Elements Corp.
第7章 市場機會與未來展望
According to Mordor Intelligence, the transparent electronics market size was valued at USD 2.78 billion in 2025 and estimated to grow from USD 3.37 billion in 2026 to reach USD 8.86 billion by 2031, at a CAGR of 21.30% during the forecast period (2026-2031).
This report is Segmented by Product (Transparent Displays, Transparent Solar Panels, Smart, and More), Material Type (Indium Tin Oxide (ITO), Alternative TCOs (AZO, FTO), and More), Technology (LCD/TFT, and More), End-User Application (Consumer Electronics, Automotive and Transportation, Aerospace and Defense, and More), and Geography. The Market Forecasts are Provided in Terms of Value (USD).
Global Transparent Electronics Market Trends and Insights
Net-zero building codes driving smart-window integration
European legislation that mandates nearly zero-energy performance for all new structures by 2030 is pushing architects toward electrochromic glazing that dynamically modulates solar gain. Pilot installations across Germany and Scandinavia have shown cooling-energy cuts exceeding 20%, and newer liquid-flow electrochromic designs added the ability to shift interior temperatures 5 °C seasonally. Integration with building-automation systems is becoming standard, opening revenue streams for sensor and controls suppliers alongside panel manufacturers. Medium-term growth prospects are reinforced by funding under national renovation programs, which reserve dedicated budgets for envelope upgrades that include smart windows.
Autonomous vehicles accelerating transparent display adoption
Automakers are turning to large-format transparent head-up displays (HUDs) that project navigation, driver-assist, and infotainment data directly onto windshields. Recent micro-LED prototypes have achieved 85% transparency while retaining 1,000-nit brightness, overcoming prior glare limitations in variable daylight. This capability satisfies stringent driver-distraction and safety norms in the United States, Japan, and the EU, triggering design wins in mid-segment electric vehicles slated for 2026 release. Short-term demand is amplified by the transition to autonomous Level 3 functions, which require larger visual fields for system-status information.
Indium supply vulnerabilities threatening production stability
ITO remains the workhorse transparent conductor, yet more than half of refined indium originates from a single country, exposing panel producers to sudden spot-price swings above 30% per annum. These spikes compress display-maker margins and delay capacity-expansion decisions. Materials firms are responding with silver-nanowire alternatives that exhibit sub-30 Ω/sq resistance at 90% transmittance while tolerating 1,000 bending cycles. The transition, however, requires new curing temperatures and patterning chemistries, prolonging qualification cycles for high-volume production.
Other drivers and restraints analyzed in the detailed report include:
- Retail transformation through transparent digital signage
- Building-integrated photovoltaics expanding transparent solar innovation
For complete list of drivers and restraints, kindly check the Table Of Contents.
Segment Analysis
Transparent displays generated the largest revenue share in 2025 at 42.65%, yet transparent solar panels are projected to grow at a 25.05% CAGR to 2031, propelled by building codes that reward on-site generation. A Swiss venture introduced a 400 W glass-like BIPV module that blends into standard facades without altering exterior aesthetics. The transparent electronics market size for solar panels is forecast to reach USD 2.26 billion by 2031, reflecting their dual role as power generators and daylighting surfaces. Product diversification now extends to transparent conductive films that underpin touch sensors and heaters, as well as rugged transparent ceramics for aerospace shielding. Smart-window units equipped with dynamic tinting continue to gain traction in commercial real estate, aided by operating-cost reductions that shorten payback periods to under five years in warm climates.
The transparent electronics market increasingly values interoperability between product categories. Emerging tandem solar cells share deposition tools with micro-LED backplanes, enabling multi-purpose manufacturing lines. Transparent sensors embedded in vehicle windshields are beginning to feed occupancy and environment data into advanced driver-assistance systems, illustrating how value migrates from stand-alone components to integrated functions.
Indium tin oxide accounted for 51.35% of transparent electronics market share in 2025, underscoring its entrenched position across LCD/TFT and touch-panel supply chains. Nevertheless, silver-nanowire composites and metal meshes are expected to erode this lead, climbing at 21.90% CAGR through 2031. Lab devices have demonstrated 26 Ω/sq sheet resistance at 90% transmittance, with only 10% resistance drift under 120% strain, making them viable for foldable phones and e-skin patches. Application-specific optimisation guides material choice. Conductive polymers such as PEDOT:PSS now coat injection-moulded plastic substrates for low-cost, flexible displays, while graphene manages heat and signal-uniformity challenges in wearable biosensors. Transparent ceramics secure niche demand in harsh-environment optics, and carbon-nanotube hybrids are emerging in electromagnetic-shielding layers where optical transparency is non-negotiable.
Complete Report Scope:
- By Product
- Transparent Displays
- Transparent Solar Panels
- Smart Windows/Smart Glass
- Transparent Conductive Films
- Transparent Ceramics and Aluminum
- Transparent Sensors and Others
- By Material Type
- Indium Tin Oxide (ITO)
- Alternative TCOs (AZO, FTO)
- Silver Nanowire and Metal Mesh
- Carbon-Based Nanomaterials (Graphene, CNT)
- Conductive Polymers (PEDOT:PSS)
- By Technology
- LCD/TFT
- OLED and micro-OLED
- Quantum-Dot and micro-LED
- Thin-Film Photovoltaic (CIGS, Perovskite)
- Electrochromic and SPD
- By End-user Application
- Consumer Electronics
- Automotive and Transportation
- Building and Infrastructure
- Energy and Utilities (BIPV, Agrivoltaics)
- Aerospace and Defense
- Healthcare and Wearables
- Retail and Digital Signage
- By Geography
- North America
- United States
- Canada
- Mexico
- Europe
- Germany
- United Kingdom
- France
- Italy
- Spain
- Nordics (Denmark, Sweden, Norway, Finland)
- Rest of Europe
- Asia-Pacific
- China
- Japan
- South Korea
- India
- Southeast Asia
- Australia
- Rest of Asia-Pacific
- South America
- Brazil
- Argentina
- Rest of South America
- Middle East
- Gulf Cooperation Council Countries
- Turkey
- Rest of Middle East
- Africa
- South Africa
- Nigeria
- Rest of Africa
- North America
Geography Analysis
Asia Pacific commanded 42.80% of 2025 revenue, anchored by high-volume fabs for displays and the world's largest BIPV programme in China. Government incentives that link urban air-quality targets to renewable-energy capacity fuel adoption of transparent solar facades in megacities such as Shanghai and Shenzhen. Japanese and South Korean firms dominate OLED research, regularly showcasing prototypes that set new benchmarks in transmittance and pixel density.
North America leverages its leadership in autonomous-vehicle software to accelerate demand for transparent HUDs and sensor-rich windshields. Building-energy rules vary by state, yet collectively favour electrochromic adoption in commercial retrofits. Europe's strict 2030 climate agenda places smart glass and BIPV at the centre of renovation funding, driving a surge of cross-border partnerships between facade contractors and materials specialists.
The Middle East and Africa is forecast to grow at 22.15% CAGR from 2026 to 2031 as smart-city investments integrate digital signage, adaptive shading and solar glass in landmark projects. Saudi Arabia's Vision 2030 allocates multi-billion-dollar budgets to immersive heritage sites that blend transparent display walls with interactive content. Latin America represents an untapped frontier where abundant solar irradiance aligns with transparent PV adoption in urban high-rise developments, although supply-chain hurdles and financing costs temper near-term uptake.
- BOE Technology Group Co., Ltd.
- LG Display Co., Ltd.
- Samsung Display Co., Ltd.
- Corning Incorporated
- AGC Inc.
- NSG Group (Pilkington)
- Saint-Gobain SA
- Ubiquitous Energy Inc.
- Brite Solar Inc.
- ClearLED Ltd.
- Panasonic Holdings Corp.
- Cambrios Technology Corp.
- Surmet Corporation
- 3M Company
- DuPont de Nemours Inc.
- PPG Industries Inc.
- Guardian Industries Holdings
- Shenzhen Nexnovo Technology Co., Ltd.
- Shenzhen AuroLED Technology Co., Ltd.
- Street Communication Inc.
- Apple Inc. (Transparent AR Glass R&D)
- JX Nippon Mining and Metals Corp.
- Heraeus Holding GmbH
- American Elements Corp.
Additional Benefits:
- The market estimate (ME) sheet in Excel format
- 3 months of analyst support
TABLE OF CONTENTS
1 INTRODUCTION
- 1.1 Study Assumptions and Market Definition
- 1.2 Scope of the Study
2 RESEARCH METHODOLOGY
3 EXECUTIVE SUMMARY
4 MARKET LANDSCAPE
- 4.1 Market Overview
- 4.2 Market Drivers
- 4.2.1 Net-Zero Building Codes Accelerating Smart-Window Adoption in EU
- 4.2.2 Rapid Uptake of Head-Up Displays in Autonomous and EV Cockpits (North America)
- 4.2.3 AR-Enabled Transparent Retail Signage Surge in Asia's Tier-1 Cities
- 4.2.4 Building-Integrated PV Mandates Spurring Transparent Solar Panels in China
- 4.2.5 Wearable Medical Sensors Requiring Flexible Transparent Conductors
- 4.3 Market Restraints
- 4.3.1 Indium Price Volatility and Supply Concentration
- 4.3.2 Low Yield Scaling Large-Area Transparent OLED Panels
- 4.3.3 E-waste Rules on Heavy-Metal Oxide Films in Europe
- 4.3.4 High CapEx for Magnetron Sputtering and ALD Equipment
- 4.4 Industry Ecosystem Analysis
- 4.5 Technological Outlook
- 4.6 Porter's Five Forces Analysis
- 4.6.1 Threat of New Entrants
- 4.6.2 Bargaining Power of Buyers/Consumers
- 4.6.3 Bargaining Power of Suppliers
- 4.6.4 Threat of Substitute Products
- 4.6.5 Intensity of Competitive Rivalry
5 MARKET SIZE AND GROWTH FORECASTS (VALUES)
- 5.1 By Product
- 5.1.1 Transparent Displays
- 5.1.2 Transparent Solar Panels
- 5.1.3 Smart Windows/Smart Glass
- 5.1.4 Transparent Conductive Films
- 5.1.5 Transparent Ceramics and Aluminum
- 5.1.6 Transparent Sensors and Others
- 5.2 By Material Type
- 5.2.1 Indium Tin Oxide (ITO)
- 5.2.2 Alternative TCOs (AZO, FTO)
- 5.2.3 Silver Nanowire and Metal Mesh
- 5.2.4 Carbon-Based Nanomaterials (Graphene, CNT)
- 5.2.5 Conductive Polymers (PEDOT:PSS)
- 5.3 By Technology
- 5.3.1 LCD/TFT
- 5.3.2 OLED and micro-OLED
- 5.3.3 Quantum-Dot and micro-LED
- 5.3.4 Thin-Film Photovoltaic (CIGS, Perovskite)
- 5.3.5 Electrochromic and SPD
- 5.4 By End-user Application
- 5.4.1 Consumer Electronics
- 5.4.2 Automotive and Transportation
- 5.4.3 Building and Infrastructure
- 5.4.4 Energy and Utilities (BIPV, Agrivoltaics)
- 5.4.5 Aerospace and Defense
- 5.4.6 Healthcare and Wearables
- 5.4.7 Retail and Digital Signage
- 5.5 By Geography
- 5.5.1 North America
- 5.5.1.1 United States
- 5.5.1.2 Canada
- 5.5.1.3 Mexico
- 5.5.2 Europe
- 5.5.2.1 Germany
- 5.5.2.2 United Kingdom
- 5.5.2.3 France
- 5.5.2.4 Italy
- 5.5.2.5 Spain
- 5.5.2.6 Nordics (Denmark, Sweden, Norway, Finland)
- 5.5.2.7 Rest of Europe
- 5.5.3 Asia-Pacific
- 5.5.3.1 China
- 5.5.3.2 Japan
- 5.5.3.3 South Korea
- 5.5.3.4 India
- 5.5.3.5 Southeast Asia
- 5.5.3.6 Australia
- 5.5.3.7 Rest of Asia-Pacific
- 5.5.4 South America
- 5.5.4.1 Brazil
- 5.5.4.2 Argentina
- 5.5.4.3 Rest of South America
- 5.5.5 Middle East
- 5.5.5.1 Gulf Cooperation Council Countries
- 5.5.5.2 Turkey
- 5.5.5.3 Rest of Middle East
- 5.5.6 Africa
- 5.5.6.1 South Africa
- 5.5.6.2 Nigeria
- 5.5.6.3 Rest of Africa
- 5.5.1 North America
6 COMPETITIVE LANDSCAPE
- 6.1 Market Concentration
- 6.2 Strategic Moves
- 6.3 Market Share Analysis
- 6.4 Company Profiles (includes Global level Overview, Market level overview, Core Segments, Financials as available, Strategic Information, Market Rank/Share for key companies, Products and Services, and Recent Developments)
- 6.4.1 BOE Technology Group Co., Ltd.
- 6.4.2 LG Display Co., Ltd.
- 6.4.3 Samsung Display Co., Ltd.
- 6.4.4 Corning Incorporated
- 6.4.5 AGC Inc.
- 6.4.6 NSG Group (Pilkington)
- 6.4.7 Saint-Gobain SA
- 6.4.8 Ubiquitous Energy Inc.
- 6.4.9 Brite Solar Inc.
- 6.4.10 ClearLED Ltd.
- 6.4.11 Panasonic Holdings Corp.
- 6.4.12 Cambrios Technology Corp.
- 6.4.13 Surmet Corporation
- 6.4.14 3M Company
- 6.4.15 DuPont de Nemours Inc.
- 6.4.16 PPG Industries Inc.
- 6.4.17 Guardian Industries Holdings
- 6.4.18 Shenzhen Nexnovo Technology Co., Ltd.
- 6.4.19 Shenzhen AuroLED Technology Co., Ltd.
- 6.4.20 Street Communication Inc.
- 6.4.21 Apple Inc. (Transparent AR Glass R&D)
- 6.4.22 JX Nippon Mining and Metals Corp.
- 6.4.23 Heraeus Holding GmbH
- 6.4.24 American Elements Corp.
7 MARKET OPPORTUNITIES AND FUTURE OUTLOOK
- 7.1 White-space and Unmet-Need Assessment

 透明電子產品市場報告:按產品類型、應用和地區分類(2026-2034 年)
 2026年全球透明電子產品市場報告2026年全球電氣和電子材料市場報告
 奈米銀透明導電薄膜市場:按應用、終端用戶產業、產品類型、製造技術和薄膜形態分類-2026-2032年全球預測透明電子產品市場按產品類型、材料、終端用戶產業、應用和技術分類,全球預測(2026-2032年)
 透明電子產品市場規模、佔有率及成長分析(按材料、裝置類型、外形規格、應用和地區分類)-2026-2033年產業預測
 透明電子市場,按產品類型、按材料、按泡沫係數、按最終用戶、按國家和地區 - 2025 年至 2032 年全球行業分析、市場規模、市場佔有率和預測
 全球透明電子市場