


 |
市場調查報告書
商品編碼
2122508
自主配送機器人:市場佔有率分析、產業趨勢與統計及成長預測(2026-2031)Autonomous Delivery Robots - Market Share Analysis, Industry Trends & Statistics, Growth Forecasts (2026 - 2031) |
||||||

※ 本網頁內容可能與最新版本有所差異。詳細情況請與我們聯繫。
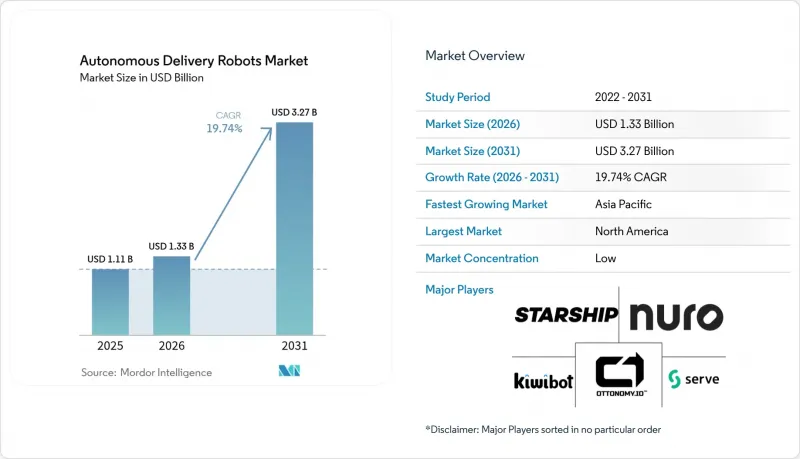
根據 Mordor Intelligence 預測,自動送貨機器人市場規模將從 2025 年的 11.1 億美元成長到 2026 年的 13.3 億美元,然後在 2031 年達到 32.7 億美元,2026 年至 2031 年的複合年成長率為 19.74%。
本報告按機器人類型(室內、室外、混合型)、應用領域(食品、雜貨、小包裹等)、有效載荷能力(10公斤以下、10-25公斤、25-80公斤、80公斤以上)、最終用戶(醫療保健、酒店、零售等)、組件(硬體、軟體等)、推進方式(電動、氫燃料、電池、混合動力)、硬體和區域電池進行細分。市場預測以美元計價。
全球自主配送機器人市場趨勢及洞察
按需雜貨配送業務快速擴張
按需雜貨配送服務如今正為大量自主機器人建立永續的單位經濟效益奠定基礎,因為高訂單密度抵消了傳統駕駛者的人事費用。克羅格已在其達拉斯營運中心部署了無人駕駛卡車,以加快訂單處理速度並降低物流成本。零售商也正在部署店內貨架掃描機器人,經證實,這些機器人已將缺貨造成的銷售損失減少了4.5%。 Simbe Robotics在60家SpartanNash門市的部署就充分證明了這一點。這些舉措表明,連鎖超市正在將機器人技術從試點階段推進到核心基礎設施階段,擴大了最後一公里配送機器人能夠處理的訂單量。
人手不足加劇和薪資上漲
北美訂單處理中心正面臨嚴重的人手不足,促使企業轉向自動化。預計到2030年,美國製造業將面臨200萬名工人缺口,而最後一公里配送司機的高離職率進一步加劇了成本壓力。工業機器人的價格在過去十年中下降了50%,安永會計師事務所預測價格將進一步下降,增加了投資的合理性。此外,都市區的高配送密度使營運商能夠更快地達到運轉率目標,並收回對自動化資產的投資。
LiDAR和感測器套件的初始成本很高
導航硬體通常是送貨機器人最大的資本支出項目。新興的超音波技術,例如 Sonair,可以在保持 180x180 度檢測範圍的同時,將感測器成本降低高達 80%。 Cartken 的無雷射雷達視覺系統已在公共人行道上盈利,這表明經濟高效的感測技術也能滿足可靠性標準。然而,這些新型感測器組合的全面部署仍需等待監管部門的批准。
細分市場分析
預計到2025年,戶外機器人將佔總銷售額的57.20%,並憑藉檢驗的人行道營運模式,在自動配送機器人市場奠定基礎。這一主導地位得益於與外送平台和當地監管機構建立的可靠夥伴關係,從而實現了在城市地區的規模部署。營運商正都市區不斷改進底盤,使其能夠適應路緣、人行橫道和行人互動,都市區。
隨著零售和酒店業客戶對無縫銜接的門到門服務的需求日益成長,混合動力全地形車正以26.65%的複合年成長率快速擴張。供應商們正積極響應這一趨勢,將四輪轉向、模組化貨艙和強勁的懸吊系統整合到車輛中,Avride轉向NVIDIA驅動的四輪平台便是這一趨勢的典型例證。室內服務機器人則在校園和醫院等可控路徑中佔據獨特的地位,即使沒有完整的街道感知能力,高度自主性也是可以接受的。
預計到2025年,食品配送業將維持42.10%的銷售額佔有率,證實了頻繁的小額訂單仍然是自動配送機器人市場的基礎。重複訂單的高頻率最佳化了資產利用率,簡化了路線學習,從而提高了Serve Robotics等平台上整個配送車隊的盈利。
隨著零售商力求實現一小時內送達,雜貨店和便利商店的年成長率高達23.70%。機器人負責搬運溫控托特包和送貨上門,擴大了購物車容量,並透過小費收入提高了盈利。小包裹遞送服務也不斷發展,但由於負載容量的限制,重型商品的配送仍受到限制,目前重點仍放在較輕的電商訂單上。
區域分析
預計到2025年,北美將維持31.60%的市場佔有率,這反映出高工資成長和複雜的州級監管環境所形成的有利條件。加州和德克薩斯州正在進行規模最大的都市區試點項目,Serve Robotics計畫在Uber Eats框架下,於2025年底前部署2,000台機器人。大學城的機器人部署也不斷擴大,Grubhub和Yandex計畫在250個校園部署機器人,這有望打造全球最密集的機器人網路之一。
亞太地區緊隨其後,佔25.40%,其中日本和韓國正在加速推進醫療保健和智慧城市計畫。韓國的法規考慮到行人使用情況,將機器人的最高速度限制在15公里/小時,重量限制在500公斤,這使得在多用戶住宅和醫院進行商業測試成為可能。豐田的「Potaro」系統展示了一種醫院應用模式,凸顯了亞太地區為應對人口老化而對物流的重視。
歐洲正在建立穩固的收入基礎,這得益於嚴格的ESG(環境、社會和治理)法規,這些法規對城市地區的柴油貨車進行處罰。 Starship Technologies公司在德國和英國運營,並獲得了監管豁免,允許低速機器人與行人共用區域。儘管營運商仍需要應對複雜的多司法管轄區核准流程,這阻礙了規模化發展,但環保方面的利好因素正在穩步推動其普及。
其他好處:
- Excel格式的市場預測(ME)表
- 3個月的分析師支持
目錄
第1章:引言
- 研究假設和市場定義
- 調查範圍
第2章:調查方法
第3章執行摘要
第4章 市場狀況
- 市場概覽
- 市場促進因素
- 亞洲都市區按需送餐宅配服務的快速擴張
- 北美履約業勞動力短缺問題日益嚴重,工資卻不斷上漲。
- 歐盟以環境、社會和治理(ESG)為導向的零排放「最後一公里」車輛戰略
- 隨著日本人口老化,醫院內部配送自動化進程正在加速。
- 中東豪華飯店對全天候非接觸式服務的需求
- 5G邊緣運算提高了高密度城區機器人的自主性。
- 市場限制因素
- 美國各城市人行道管理規定的差異
- 有限的裝載能力限制了散貨運輸的投資報酬率(ROI)。
- LiDAR和感測器套件的初始成本很高
- 南美洲大都會圈的故意破壞和盜竊事件
- 價值鏈分析
- 技術展望
- 宏觀經濟趨勢分析的影響
- 監理展望
- 波特五力分析
- 投資和資金籌措分析
第5章 市場規模與成長預測
- 按機器人類型
- 室內服務機器人
- 戶外自主配送機器人
- 混合型全地形機器人
- 透過使用
- 外賣
- 食品雜貨和便利商店商品宅配
- 小包裹與宅配(電子商務)
- 醫療用品和藥品
- 飯店業的客房服務
- 工業園區物流
- 負載能力
- 10公斤或以下
- 10~25 kg
- 25~80 kg
- 80公斤或以上
- 按最終用戶行業分類
- 醫療機構
- 飯店及餐飲服務
- 零售與電子商務物流
- 企業和大學校園
- 機場和交通樞紐
- 智慧城市和地方政府
- 按組件
- 硬體
- 軟體/人工智慧堆疊
- 售後服務與車隊管理
- 依推進類型
- 電池
- 氫燃料電池
- 混合能源採集
- 依自主程度
- 半自動(需人工監督)
- 完全自動駕駛(L4級)
- 集群/集群型自治網路(第 5 級)
- 按地區
- 北美洲
- 美國
- 加拿大
- 墨西哥
- 南美洲
- 巴西
- 阿根廷
- 智利
- 歐洲
- 德國
- 英國
- 法國
- 義大利
- 西班牙
- 中東
- 阿拉伯聯合大公國
- 沙烏地阿拉伯
- 土耳其
- 非洲
- 南非
- 肯亞
- 亞太地區
- 中國
- 澳洲
- 日本
- 新加坡
- 印度
- 韓國
- 北美洲
第6章 競爭情勢
- 市場集中度
- 策略趨勢
- 市佔率分析
- 公司簡介
- Starship Technologies
- Nuro Inc.
- Kiwibot
- Serve Robotics Inc.
- Ottonomy.IO
- Relay Robotics Inc.
- Postmates Inc.(Serve by Uber)
- Aethon Inc.
- Segway Robotics Inc.
- Neolix
- Udelv Inc.
- JD Logistics(Jian Robots)
- Alibaba Cainiao(Xiaomanlv)
- Yandex Rover
- FedEx Roxo
- Amazon Scout
- Rival Robotics Inc.
- TeleRetail(Aitonomi AG)
- Daxbot
- Locus Robotics(campus variant)
- Kiwi Campus SAS
第7章 市場機會與未來展望
According to Mordor Intelligence, the autonomous delivery robots market size is expected to grow from USD 1.11 billion in 2025 to USD 1.33 billion in 2026 and is forecast to reach USD 3.27 billion by 2031 at 19.74% CAGR over 2026-2031.
This report is Segmented by Robot Type (Indoor, Outdoor, Hybrid), Application (Food, Grocery, Parcel, and More), Load Capacity (Up To 10kg, 10-25kg, 25-80kg, Above 80kg), End-User (Healthcare, Hotels, Retail, and More), Component (Hardware, Software and More), Propulsion (Electric, Hydrogen, Hybrid), Level of Autonomy, and Geography. The Market Forecasts are Provided in Terms of Value (USD).
Global Autonomous Delivery Robots Market Trends and Insights
Rapid Expansion of On-Demand Grocery Delivery
On-demand grocery services now anchor sustainable unit economics for autonomous fleets because high order density offsets traditional driver costs. Kroger integrated driverless trucks into its Dallas operations to accelerate fulfillment and trim logistics spend. Retailers also embed in-store shelf-scanning robots to reduce the documented 4.5% revenue leakage linked to stock-outs, as shown by Simbe Robotics' rollout across 60 SpartanNash stores. Together these moves confirm that grocery chains are shifting robotics from pilot status to core infrastructure, widening order volumes available to last-mile robots.
Rising Labor Shortages and Wage Inflation
North American fulfillment centers face acute staffing gaps that push companies toward automated alternatives. The U.S. manufacturing sector projects a 2 million-worker shortage by 2030, and last-mile driver turnover amplifies cost pressure. Falling industrial robot prices-down 50% in the past decade-and further declines predicted by EY strengthen the investment case. High urban delivery density then allows operators to hit utilization targets that yield faster payback on autonomous assets.
High Upfront Cost of LiDAR and Sensor Suites
Navigation hardware often accounts for the largest capital item in a delivery robot. Emerging ultrasonic alternatives such as Sonair cut sensor spend by up to 80% while keeping a 180 X 180 degree detection envelope. Cartken's lidar-free vision stack already operates profitably on public sidewalks, proving that cost-efficient sensing can meet reliability thresholds. Even so, broad rollout waits on regulatory validation of these novel sensor mixes.
Other drivers and restraints analyzed in the detailed report include:
- ESG-Driven Push for Zero-Emission Last-Mile Vehicles
- Aging Population Spurring Intra-Hospital Delivery Automation
- Vandalism and Theft Incidents in South-American Metros
For complete list of drivers and restraints, kindly check the Table Of Contents.
Segment Analysis
Outdoor robots generated 57.20% of 2025 revenue, anchoring the autonomous delivery robots market through well-tested sidewalk operations. This dominance reflects reliable partnerships with food aggregators and local regulators that allow scalable city deployments. Operators continue to refine chassis for curbs, crosswalks, and pedestrian interaction, reinforcing their urban stronghold.
Hybrid all-terrain units expand rapidly at 26.65% CAGR because retail and hospitality customers ask for seamless door-to-door service that crosses thresholds. Suppliers respond by integrating four-wheel steering, modular cargo pods, and ruggedized suspension, a trend evident in Avride's pivot to NVIDIA-powered four-wheel platforms. Indoor service robots maintain niche roles in campuses and hospitals where controlled corridors permit higher autonomy without full street-grade sensing.
Food delivery retained 42.10% revenue share in 2025, proving that frequent small-ticket orders still underpin the autonomous delivery robots market. High repetition optimizes asset utilization and simplifies route learning, supporting fleet-level profitability for platforms such as Serve Robotics.
Grocery and convenience segments rise 23.70% annually as retailers chase sub-hour fulfillment. Robots accommodate temperature-controlled totes and door-step protocols that boost basket size and tip-influenced economics. Parcel courier services also advance, but payload ceilings still limit heavier SKUs, keeping focus on lightweight e-commerce orders for now.
Complete Report Scope:
- By Robot Type
- Indoor Service Robots
- Outdoor Autonomous Delivery Robots
- Hybrid All-Terrain Robots
- By Application
- Food Delivery
- Grocery and Convenience Deliveries
- Parcel and Courier (E-commerce)
- Healthcare Supply and Medication
- Hospitality Room-Service
- Industrial Campus Logistics
- By Load Capacity
- Up to 10 kg
- 10 - 25 kg
- 25 - 80 kg
- Above 80 kg
- By End-User Industry
- Healthcare Facilities
- Hospitality and Hotels
- Retail and E-commerce Logistics
- Corporates and Academic Campuses
- Airports and Transportation Hubs
- Smart Cities and Municipal Agencies
- By Component
- Hardware
- Software / AI Stack
- After-Sales Services and Fleet Management
- By Propulsion Type
- Electric Battery
- Hydrogen Fuel Cell
- Hybrid Energy Harvesting
- By Level of Autonomy
- Semi-Autonomous (Human-Supervised)
- Fully Autonomous (Level 4)
- Swarm/Clustered Autonomous Network (Level 5)
- By Geography
- North America
- United States
- Canada
- Mexico
- South America
- Brazil
- Argentina
- Chile
- Europe
- Germany
- United Kingdom
- France
- Italy
- Spain
- Middle East
- United Arab Emirates
- Saudi Arabia
- Turkey
- Africa
- South Africa
- Kenya
- Asia-Pacific
- China
- Australia
- Japan
- Singapore
- India
- South Korea
- North America
Geography Analysis
North America retained 31.60% share in 2025, reflecting high wage inflation and a supportive patchwork of state-level rules. California and Texas host the largest urban pilots, with Serve Robotics targeting 2,000 units by year-end 2025 under an Uber Eats framework. College-town deployments add scale; Grubhub and Yandex plan rollouts across 250 campuses, potentially forming the world's densest robot network.
Asia-Pacific followed with a 25.40% stake as Japan and South Korea accelerate healthcare and smart-city programs. South Korea's sidewalk-friendly legislation caps robot speed at 15 km/h and weight at 500 kg, unlocking commercial trials in apartment complexes and hospitals. Toyota's Potaro system shows the model for intra-hospital use, highlighting APAC's focus on aging-related logistics.
Europe contributes a solid revenue base, aided by stringent ESG mandates that penalize diesel vans in city centers. Starship Technologies operates in Germany and the UK under regulatory exemptions that let slow-moving robots share pedestrian zones. Operators still navigate complex, multi-jurisdiction approval processes, slowing scale, yet the environmental tailwinds keep adoption on a steady path.
- Starship Technologies
- Nuro Inc.
- Kiwibot
- Serve Robotics Inc.
- Ottonomy.IO
- Relay Robotics Inc.
- Postmates Inc. (Serve by Uber)
- Aethon Inc.
- Segway Robotics Inc.
- Neolix
- Udelv Inc.
- JD Logistics (Jian Robots)
- Alibaba Cainiao (Xiaomanlv)
- Yandex Rover
- FedEx Roxo
- Amazon Scout
- Rival Robotics Inc.
- TeleRetail (Aitonomi AG)
- Daxbot
- Locus Robotics (campus variant)
- Kiwi Campus SAS
Additional Benefits:
- The market estimate (ME) sheet in Excel format
- 3 months of analyst support
TABLE OF CONTENTS
1 INTRODUCTION
- 1.1 Study Assumptions and Market Definition
- 1.2 Scope of the Study
2 RESEARCH METHODOLOGY
3 EXECUTIVE SUMMARY
4 MARKET LANDSCAPE
- 4.1 Market Overview
- 4.2 Market Drivers
- 4.2.1 Rapid expansion of on-demand grocery delivery in urban Asia
- 4.2.2 Rising labor shortages and wage inflation in North-American fulfilment
- 4.2.3 ESG-driven push for zero-emission last-mile vehicles in the EU
- 4.2.4 Aging population spurring intra-hospital delivery automation in Japan
- 4.2.5 24/7 contact-free services demand in Middle-East luxury hotels
- 4.2.6 5G edge-compute enabling higher robot autonomy in dense city cores
- 4.3 Market Restraints
- 4.3.1 Municipal sidewalk regulation variability in US cities
- 4.3.2 Limited payload capacity restricting ROI for bulk goods
- 4.3.3 High upfront cost of LiDAR and sensor suites
- 4.3.4 Vandalism and theft incidents in S-American metros
- 4.4 Value-Chain Analysis
- 4.5 Technological Outlook
- 4.6 Impact of Macro-Trend Analysis
- 4.7 Regulatory Outlook
- 4.8 Porter's Five Forces Analysis
- 4.8.1 Threat of New Entrants
- 4.8.2 Bargaining Power of Buyers
- 4.8.3 Bargaining Power of Suppliers
- 4.8.4 Threat of Substitutes
- 4.8.5 Intensity of Competitive Rivalry
- 4.9 Investment and Funding Analysis
5 MARKET SIZE AND GROWTH FORECASTS (VALUE)
- 5.1 By Robot Type
- 5.1.1 Indoor Service Robots
- 5.1.2 Outdoor Autonomous Delivery Robots
- 5.1.3 Hybrid All-Terrain Robots
- 5.2 By Application
- 5.2.1 Food Delivery
- 5.2.2 Grocery and Convenience Deliveries
- 5.2.3 Parcel and Courier (E-commerce)
- 5.2.4 Healthcare Supply and Medication
- 5.2.5 Hospitality Room-Service
- 5.2.6 Industrial Campus Logistics
- 5.3 By Load Capacity
- 5.3.1 Up to 10 kg
- 5.3.2 10 - 25 kg
- 5.3.3 25 - 80 kg
- 5.3.4 Above 80 kg
- 5.4 By End-User Industry
- 5.4.1 Healthcare Facilities
- 5.4.2 Hospitality and Hotels
- 5.4.3 Retail and E-commerce Logistics
- 5.4.4 Corporates and Academic Campuses
- 5.4.5 Airports and Transportation Hubs
- 5.4.6 Smart Cities and Municipal Agencies
- 5.5 By Component
- 5.5.1 Hardware
- 5.5.2 Software / AI Stack
- 5.5.3 After-Sales Services and Fleet Management
- 5.6 By Propulsion Type
- 5.6.1 Electric Battery
- 5.6.2 Hydrogen Fuel Cell
- 5.6.3 Hybrid Energy Harvesting
- 5.7 By Level of Autonomy
- 5.7.1 Semi-Autonomous (Human-Supervised)
- 5.7.2 Fully Autonomous (Level 4)
- 5.7.3 Swarm/Clustered Autonomous Network (Level 5)
- 5.8 By Geography
- 5.8.1 North America
- 5.8.1.1 United States
- 5.8.1.2 Canada
- 5.8.1.3 Mexico
- 5.8.2 South America
- 5.8.2.1 Brazil
- 5.8.2.2 Argentina
- 5.8.2.3 Chile
- 5.8.3 Europe
- 5.8.3.1 Germany
- 5.8.3.2 United Kingdom
- 5.8.3.3 France
- 5.8.3.4 Italy
- 5.8.3.5 Spain
- 5.8.4 Middle East
- 5.8.4.1 United Arab Emirates
- 5.8.4.2 Saudi Arabia
- 5.8.4.3 Turkey
- 5.8.5 Africa
- 5.8.5.1 South Africa
- 5.8.5.2 Kenya
- 5.8.6 Asia-Pacific
- 5.8.6.1 China
- 5.8.6.2 Australia
- 5.8.6.3 Japan
- 5.8.6.4 Singapore
- 5.8.6.5 India
- 5.8.6.6 South Korea
- 5.8.1 North America
6 COMPETITIVE LANDSCAPE
- 6.1 Market Concentration
- 6.2 Strategic Moves
- 6.3 Market Share Analysis
- 6.4 Company Profiles {(includes Global level Overview, Market level overview, Core Segments, Financials as available, Strategic Information, Market Rank/Share for key companies, Products and Services, and Recent Developments)}
- 6.4.1 Starship Technologies
- 6.4.2 Nuro Inc.
- 6.4.3 Kiwibot
- 6.4.4 Serve Robotics Inc.
- 6.4.5 Ottonomy.IO
- 6.4.6 Relay Robotics Inc.
- 6.4.7 Postmates Inc. (Serve by Uber)
- 6.4.8 Aethon Inc.
- 6.4.9 Segway Robotics Inc.
- 6.4.10 Neolix
- 6.4.11 Udelv Inc.
- 6.4.12 JD Logistics (Jian Robots)
- 6.4.13 Alibaba Cainiao (Xiaomanlv)
- 6.4.14 Yandex Rover
- 6.4.15 FedEx Roxo
- 6.4.16 Amazon Scout
- 6.4.17 Rival Robotics Inc.
- 6.4.18 TeleRetail (Aitonomi AG)
- 6.4.19 Daxbot
- 6.4.20 Locus Robotics (campus variant)
- 6.4.21 Kiwi Campus SAS
7 MARKET OPPORTUNITIES AND FUTURE OUTLOOK
- 7.1 White-space and Unmet-Need Assessment


