


 |
市場調查報告書
商品編碼
2122502
網際網路協定電視(IPTV):市場佔有率分析、產業趨勢與統計資料、成長預測(2026-2031)Internet Protocol Television (IPTV) - Market Share Analysis, Industry Trends & Statistics, Growth Forecasts (2026 - 2031) |
||||||

※ 本網頁內容可能與最新版本有所差異。詳細情況請與我們聯繫。
根據 Mordor Intelligence 預測,網際網路協定電視 (IPTV) 市場規模將從 2025 年的 557.1 億美元成長到 2026 年的 666.3 億美元,然後在 2031 年達到 1372.2 億美元,2026 年至 2031 年的複合年成長率為 15.5%。
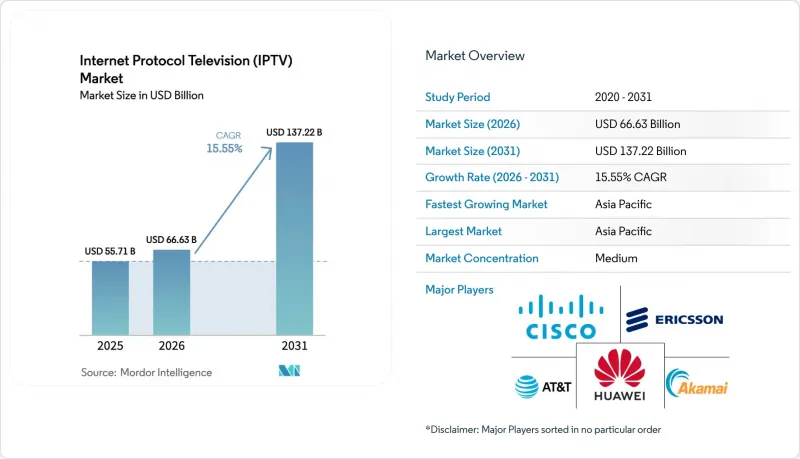
本報告按組件(硬體和服務)、收入模式(訂閱模式等)、串流媒體類型(直播/線性電視、時移/重播電視、視訊點播)、裝置/存取平台(智慧電視、手機和平板電腦、PC/筆記型電腦、其他)、傳輸方式(多播IPTV、單播IPTV)和地區進行細分。市場預測以美元(USD)計價。
全球網際網路協定電視(IPTV)市場趨勢與洞察
光纖到戶部署將滿足4K和8K的需求。
2025年底,全球光纖線路數量將超過6億條,為分別消耗25 Mbps和100 Mbps頻寬的4K和8K資料通訊密集型串流媒體提供所需的吞吐量空間。電信公司目前正以30%至50%的溢價提供超高清套餐,在不增加相應行銷成本的情況下提升收入。沙烏地阿拉伯的STC利用其覆蓋500萬戶家庭的光纖網路,於2024年推出了8K體育套餐。法國Orange也透過向新光纖用戶免費提供4K相容機上盒來降低解約率。到2025年中期,NTT東日本和西日本68%的光纖用戶將每週觀看4K IPTV。由於郊區和農村地區的網路基礎設施仍在不斷擴展,這一因素在中期內仍將是一個強大的驅動力。
超級聚合平台正在蓬勃發展。
整合了地面電波頻道、Netflix、Disney+ 和廣告支援的免費串流媒體服務的統一指南正在緩解用戶對應用程式的疲勞感。 Viaccess-Orca 的平台將於 2025 年底前由 15 家歐洲營運商部署,部署後平均每月解約率將降低 18%。 Comcast 和 Rogers 已將第三方應用程式整合到其機上盒韌體中,恢復了網路營運商的內容髮現功能。德勤的一項調查顯示,42% 的美國觀眾希望透過單一介面管理他們的內容,而提供這種服務的營運商的訂閱業務盈利正在復甦。由於該方案所需的資本支出 (CAPEX) 極低,且可快速部署軟體,因此其短期影響顯著。
持續“停掉有線電視服務”,邁向純粹的OTT服務
美國付費電視業者在2024年流失了590萬用戶,使其用戶總數數十年來首次跌破7,000萬。 [2] 根據英國通訊監理局(Ofcom)的報告,英國傳統電視訂閱用戶當年減少了140萬,其中62%的家庭僅使用串流服務。 Ampere Analysis發現,歐洲付費電視用戶下降了3.2%,西班牙和義大利受到的衝擊尤其嚴重。如今,IPTV業者不僅要與有線電視業者競爭,還要與更靈活的直接面對消費者(DTC)服務供應商競爭,後者正在加大對原創內容的投入。這種限制在成熟地區短期內最為嚴峻,迫使營運商專注於獨家體育賽事轉播、整合套餐和提供優質的客戶支援。
細分市場分析
預計到2025年,硬體收入將佔總收入的63.20%,主要驅動力來自機上盒、中間件伺服器、編碼器和條件接收硬體。同時,業務收益正以15.80%的複合年成長率成長,反映出營運商傾向於選擇能夠降低營運成本(OPEX)的託管平台。隨著營運商從愛立信、思科和華為等公司獲得雲端中間件的授權,網路協定電視(IPTV)市場預計將進一步擴張,從而實現每週功能部署,無需現場維護。託管服務還包括全天候監控、災難復原和分析,幫助小規模業者應對技能短缺問題。
由於三星和LG的智慧電視作業系統能夠原生運行IPTV應用,機上盒出貨量正在下降。同時,隨著業者從永久授權合約轉向訂閱模式,中間件授權費用正在上漲。將傳輸設備升級到HEVC和AV1可以減少4K頻寬40%,使營運商能夠在現有CDN預算內增加頻道。條件接收正在從USB加密狗轉向雲端密鑰伺服器,從而確保任何裝置上的串流媒體安全。由於圍繞IP多播和單播共存的整合項目,諮詢業務依然強勁,這將推動服務提供商在整個預測期內佔據更大的網際網路協議電視(IPTV)市場佔有率。
預計到2025年,訂閱套餐將佔總收入的71.40%,主要驅動力為體育賽事直播和OTT捆綁套餐。廣告支援的視訊點播(AVoD)正以16.3%的複合年成長率成長,隨著對成本敏感的家庭選擇包含每小時4-6分鐘廣告的免費套餐,市場規模預計將穩步擴大。 AVoD網路協定電視市場正在低收入地區擴張,尤其是在印度、巴西和印尼。業者正在投放針對特定家庭人口統計的定向廣告,其每千次展示成本(CPM)是傳統電視廣播的三倍。
隨著格鬥賽事和演唱會轉向訂閱和廣告支援的視訊點播(AVoD)配套服務,按次付費(PPV)模式正在衰落。由於經濟壓力,許多美國觀眾在過去一年中至少取消了一項付費服務,因此費用更低、廣告更少的混合模式越來越受歡迎。 Akamai 和 Broadpeak 等整合廣告平台正在將程式化需求整合到直播和點播內容中,從而提升銷售額,並鞏固其在網際網路協議電視(IPTV)市場數位廣告價值鏈中的地位。
區域分析
預計到2025年,亞太地區將佔全球營收的45.89%,並在2026年至2031年間以16.3%的複合年成長率成長。這項成長主要得益於中國3.8億IPTV用戶以及印度和日本光纖網路的快速擴張。中國電信的1.95億用戶、中國移動的1.1億用戶以及中國聯通的7,500萬用戶將持續支持中國的IPTV市場。預計2025年中期,印度的光纖網路規模將超過3,500萬,每月可新增200萬IPTV用戶。
在歐洲,「停掉有線電視服務」(放棄有線電視)的趨勢日益明顯,而像MagentaTV這樣的平台透過將Netflix和Disney+整合到一個統一的介面中,穩定了用戶數量。德國電信在經歷了多年的用戶下滑後,於2024年新增了40萬用戶。在北美,隨著AT&T和Verizon用戶數量的下降,整體用戶用戶有所減少,但光纖寬頻覆蓋範圍的擴大為電信公司提供了向提升銷售純串流媒體套餐的機會。
在非洲,奈及利亞、埃及和南非的行動營運商正將固定無線家庭寬頻與IPTV結合,以應對銅纜短缺的問題。根據奈及利亞通訊委員會(NCC)預測,到2025年中期,寬頻連線數預計將達到820萬,高於兩年前的510萬。南美洲則以巴西為代表,預計2024年底,巴西將有2,800萬戶家庭接入光纖網路,Claro和Vivo等公司也開始提供4K IPTV服務。在中東,沙烏地阿拉伯的STC和阿拉伯聯合大公國的Etisalat正在將IPTV與5G結合,預計在2024年至2025年間將新增350萬用戶。
其他好處:
- Excel格式的市場預測(ME)表
- 3個月的分析師支持
目錄
第1章:引言
- 研究假設和市場定義
- 調查範圍
第2章:調查方法
第3章執行摘要
第4章 市場狀況
- 市場概覽
- 市場促進因素
- 「光纖到戶」部署與 4K/8K 內容需求的整合。
- 歐洲和北美超級聚合平台的興起
- 亞洲電信業者將IPTV與固網/行動融合套餐商品搭售
- 透過廣告支援的視訊點播 (AVoD) 實現盈利正在取得進展。
- 新興市場寬頻普及率的成長
- 廣播公司向基於IP的分發基礎設施轉型
- 市場限制因素
- 在成熟市場中,持續進行「停掉有線電視服務」以提供純粹的OTT服務
- 體育賽事尖峰時段期單播頻寬瓶頸
- 跨國內容版權監管的碎片化
- 盜版和非法 IPTV配送網路
- 產業價值鏈分析
- 監理情勢
- 技術展望
- 宏觀經濟因素的影響
- 波特五力分析
第5章 市場規模與成長預測
- 按組件
- 硬體
- 機上盒(STB)
- 中介軟體
- 傳輸和編碼設備
- 條件存取系統
- 服務
- 託管式 IPTV 服務
- 整合與諮詢
- 支援與維護
- 硬體
- 按收入模式
- 基於訂閱
- 按次付費觀看
- 廣告支持型廣告(AVoD)
- 按串流媒體類型
- 直播/線性電視
- 時移/重播電視
- 視訊點播
- 按設備/訪問平台
- 智慧電視
- 手機和平板電腦
- 桌上型電腦/筆記型電腦
- 機上盒和串流媒體裝置
- 透過供應方法
- 多播IPTV
- 單播IPTV
- 按地區
- 北美洲
- 美國
- 加拿大
- 墨西哥
- 南美洲
- 巴西
- 阿根廷
- 其他南美國家
- 歐洲
- 德國
- 英國
- 法國
- 義大利
- 西班牙
- 其他歐洲國家
- 亞太地區
- 中國
- 印度
- 日本
- 韓國
- 澳洲和紐西蘭
- 其他亞太國家
- 中東
- 沙烏地阿拉伯
- 阿拉伯聯合大公國
- 土耳其
- 其他中東國家
- 非洲
- 南非
- 奈及利亞
- 埃及
- 其他非洲國家
- 北美洲
第6章 競爭情勢
- 市場集中度
- 策略趨勢
- 市佔率分析
- 公司簡介
- AT&T Inc.
- Verizon Communications Inc.
- Deutsche Telekom AG
- China Telecom Corp. Ltd.
- Orange SA
- British Telecom plc
- Telefonica SA
- DISH Network Corp.
- Comcast Corp.
- Vodafone Group plc
- Akamai Technologies Inc.
- Cisco Systems Inc.
- Huawei Technologies Co. Ltd.
- Ericsson AB
- ARRIS(CommScope Holding Co.)
- Sagemcom Broadband SAS
- ZTE Corp.
- Imagine Communications Corp.
- Broadpeak SA
- Amino Technologies plc
- Tripleplay Services Ltd.
- Sterlite Technologies Ltd.
- Moftak Solutions
第7章 市場機會與未來展望
According to Mordor Intelligence, the internet protocol television market size is expected to grow from USD 55.71 billion in 2025 to USD 66.63 billion in 2026 and is forecast to reach USD 137.22 billion by 2031 at 15.55% CAGR over 2026-2031.
This report is Segmented by Component (Hardware, and Services), Revenue Model (Subscription-Based, and More), Streaming Type (Live/Linear TV, Time-Shifted/Replay TV, and Video-On-Demand), Device/Access Platform (Smart TV, Mobile and Tablet, PC/Laptop, and More), Delivery Method (Multicast IPTV, and Unicast IPTV), and Geography. The Market Forecasts are Provided in Terms of Value (USD).
Global Internet Protocol Television (IPTV) Market Trends and Insights
Fiber-to-Home Rollouts Meet 4K and 8K Demand
Global fiber lines surpassed 600 million by late 2025, creating the throughput headroom needed for data-hungry 4K and 8K streams that consume 25 Mbps and 100 Mbps. Operators now price ultra-high-definition tiers at 30%-50% premiums, adding incremental revenue without proportional marketing spend. Saudi Arabia's STC used its five-million-home fiber build to launch an 8K sports pack in 2024, and France's Orange gave new fiber customers 4K boxes at no surcharge, cutting churn. By mid-2025, 68% of NTT East and West fiber customers were watching 4K IPTV weekly. Construction is still underway in suburbs and rural areas, so this driver will remain potent in the medium term.
Super-Aggregation Platforms Gain Traction
Unified guides that merge linear channels with Netflix, Disney+, and free ad-supported streams are reversing app fatigue. Viaccess-Orca's platform served 15 European operators by late 2025, dropping average monthly churn by 18% after rollout. Comcast and Rogers embedded third-party apps in set-top firmware, restoring the discovery layer to the network operator. Deloitte found 42% of U.S. viewers would rather manage content from a single interface, so telcos that offer one are reclaiming subscription economics. Minimal capex needs and rapid software rollout drive its high short-term impact.
Persistent Cord-Cutting Toward Pure OTT Services
U.S. pay-TV providers lost 5.9 million subscribers in 2024, dropping the base below 70 million for the first time in decades[2]. Ofcom reported 1.4 million fewer traditional TV homes in the United Kingdom that year, while streaming-only households hit 62%. Ampere Analysis showed a 3.2% decline in European pay-TV subscribers, with Spain and Italy hardest hit. IPTV operators now fight not just cable but also agile direct-to-consumer services that outspend them on original content. The restraint bites hardest in the short term in mature regions, pushing operators to emphasize exclusive sports, convergent bundles, and superior customer support.
Other drivers and restraints analyzed in the detailed report include:
- Telco Bundles of IPTV With Convergent Plans
- AVoD Monetization Accelerates
- Unicast Bandwidth Bottlenecks During Peak Sporting Events
For complete list of drivers and restraints, kindly check the Table Of Contents.
Segment Analysis
Hardware generated 63.20% of revenue in 2025, driven by set-top boxes, middleware servers, encoders, and conditional-access hardware. Services revenue, however, is climbing at 15.80% CAGR, reflecting operator preference for opex-friendly managed platforms. The Internet Protocol Television market size for services is projected to expand as operators license cloud middleware from Ericsson, Cisco, and Huawei, enabling weekly feature rollouts without truck rolls. Managed services also cover 24-hour monitoring, fault remediation, and analytics, shielding smaller telcos from skill shortages.
Set-top shipments are sliding because Samsung and LG smart-TV operating systems run IPTV apps natively, while middleware license fees rise as operators shift from perpetual to subscription contracts. Transmission equipment upgrades to HEVC and AV1 cut 4K bandwidth by 40%, letting operators add channels inside existing CDN budgets. Conditional access is moving from USB dongles to cloud key servers that secure streams on any device. Integration projects around IP multicast and unicast coexistence keep consulting pipelines full, pushing services toward a larger slice of the Internet Protocol Television market share over the forecast horizon.
Subscription packages accounted for 71.40% of revenue in 2025, driven by live sports and bundled OTT offers. Advertising-supported video-on-demand is growing at 16.3% CAGR and will add clear scale because cost-sensitive households opt for free tiers with four to six minutes of ads per hour. The internet protocol television market size for AVoD is widening in regions where average incomes lag, notably India, Brazil, and Indonesia. Operators overlay addressable ads that target household demographics, tripling CPMs relative to broadcast television.
Pay-per-view is slipping as combat sports and concerts migrate to subscription or AVoD bundles. A significant number of U.S. viewers canceled at least one paid service in the past year due to wallet strain, so hybrid models that pair small fees with lighter ad loads are gaining favor. Unified ad platforms from Akamai and Broadpeak stitch programmatic demand into live and on-demand feeds, boosting sell-through rates and keeping operators active in the internet protocol television market's digital ad value chain.
Complete Report Scope:
- By Component
- Hardware
- Set-Top Box (STB)
- Middleware
- Transmission and Encoding Equipment
- Conditional Access Systems
- Services
- Managed IPTV Services
- Integration and Consulting
- Support and Maintenance
- Hardware
- By Revenue Model
- Subscription-Based
- Pay-Per-View
- Advertising-Supported (AVoD)
- By Streaming Type
- Live/Linear TV
- Time-Shifted/Replay TV
- Video-on-Demand
- By Device/Access Platform
- Smart TV
- Mobile and Tablet
- PC/Laptop
- Set-Top Box and Media Streamer
- By Delivery Method
- Multicast IPTV
- Unicast IPTV
- By Geography
- North America
- United States
- Canada
- Mexico
- South America
- Brazil
- Argentina
- Rest of South America
- Europe
- Germany
- United Kingdom
- France
- Italy
- Spain
- Rest of Europe
- Asia-Pacific
- China
- India
- Japan
- South Korea
- Australia and New Zealand
- Rest of Asia-Pacific
- Middle East
- Saudi Arabia
- United Arab Emirates
- Turkey
- Rest of Middle East
- Africa
- South Africa
- Nigeria
- Egypt
- Rest of Africa
- North America
Geography Analysis
Asia-Pacific accounted for 45.89% of global revenue in 2025 and is expected to grow at a 16.3% CAGR from 2026 to 2031, led by 380 million Chinese IPTV subscriptions and rapid fiber rollouts in India and Japan. The internet protocol television market size in China remains anchored by China Telecom's 195 million subscribers, China Mobile's 110 million, and China Unicom's 75 million. India's fiber base crossed 35 million lines by mid-2025, supporting 2 million new IPTV additions each month.
Europe faces cord-cutting, yet platforms such as MagentaTV stabilized counts by bundling Netflix and Disney+ under one interface. Deutsche Telekom added 400,000 subscribers in 2024 after years of decline. North America saw total subscriber losses, as AT&T and Verizon reported declines, but fiber broadband footprints grew, giving operators headroom to upsell streaming-only bundles.
In Africa, Nigeria, Egypt, and South Africa see mobile operators pair fixed-wireless home broadband with IPTV, bypassing the scarcity of copper. The Nigerian Communications Commission tallied 8.2 million broadband lines by mid-2025, up from 5.1 million two years earlier. South America relies on Brazil, where 28 million homes had fiber by late 2024, enabling Claro and Vivo to launch 4K IPTV. The Middle East follows with Saudi Arabia's STC and UAE's Etisalat bundling IPTV and 5G to secure 3.5 million subs across 2024-2025.
- AT&T Inc.
- Verizon Communications Inc.
- Deutsche Telekom AG
- China Telecom Corp. Ltd.
- Orange S.A.
- British Telecom plc
- Telefonica S.A.
- DISH Network Corp.
- Comcast Corp.
- Vodafone Group plc
- Akamai Technologies Inc.
- Cisco Systems Inc.
- Huawei Technologies Co. Ltd.
- Ericsson AB
- ARRIS (CommScope Holding Co.)
- Sagemcom Broadband SAS
- ZTE Corp.
- Imagine Communications Corp.
- Broadpeak S.A.
- Amino Technologies plc
- Tripleplay Services Ltd.
- Sterlite Technologies Ltd.
- Moftak Solutions
Additional Benefits:
- The market estimate (ME) sheet in Excel format
- 3 months of analyst support
TABLE OF CONTENTS
1 INTRODUCTION
- 1.1 Study Assumptions and Market Definition
- 1.2 Scope of the Study
2 RESEARCH METHODOLOGY
3 EXECUTIVE SUMMARY
4 MARKET LANDSCAPE
- 4.1 Market Overview
- 4.2 Market Drivers
- 4.2.1 Convergence of Fiber-to-Home Roll-outs With 4K/8K Content Demand
- 4.2.2 Emergence of Super-Aggregation Platforms in Europe and North America
- 4.2.3 Telco Bundling of IPTV With Fixed-Mobile Convergent Plans in Asia
- 4.2.4 Advertising-Supported Video-on-Demand (AVoD) Monetization Gains
- 4.2.5 Broadband Penetration Growth in Emerging Markets
- 4.2.6 Migration of Broadcasters to IP-based Delivery Infrastructure
- 4.3 Market Restraints
- 4.3.1 Persistent Cord-Cutting Toward Pure-OTT Services in Mature Markets
- 4.3.2 Unicast Bandwidth Bottlenecks During Peak Sporting Events
- 4.3.3 Regulatory Fragmentation in Multinational Content Rights
- 4.3.4 Piracy and Illegal IPTV Distribution Networks
- 4.4 Industry Value Chain Analysis
- 4.5 Regulatory Landscape
- 4.6 Technological Outlook
- 4.7 Impact of Macroeconomic Factors
- 4.8 Porter's Five Forces Analysis
- 4.8.1 Threat of New Entrants
- 4.8.2 Bargaining Power of Suppliers
- 4.8.3 Bargaining Power of Buyers
- 4.8.4 Threat of Substitutes
- 4.8.5 Competitive Rivalry
5 MARKET SIZE AND GROWTH FORECASTS (VALUE)
- 5.1 By Component
- 5.1.1 Hardware
- 5.1.1.1 Set-Top Box (STB)
- 5.1.1.2 Middleware
- 5.1.1.3 Transmission and Encoding Equipment
- 5.1.1.4 Conditional Access Systems
- 5.1.2 Services
- 5.1.2.1 Managed IPTV Services
- 5.1.2.2 Integration and Consulting
- 5.1.2.3 Support and Maintenance
- 5.1.1 Hardware
- 5.2 By Revenue Model
- 5.2.1 Subscription-Based
- 5.2.2 Pay-Per-View
- 5.2.3 Advertising-Supported (AVoD)
- 5.3 By Streaming Type
- 5.3.1 Live/Linear TV
- 5.3.2 Time-Shifted/Replay TV
- 5.3.3 Video-on-Demand
- 5.4 By Device/Access Platform
- 5.4.1 Smart TV
- 5.4.2 Mobile and Tablet
- 5.4.3 PC/Laptop
- 5.4.4 Set-Top Box and Media Streamer
- 5.5 By Delivery Method
- 5.5.1 Multicast IPTV
- 5.5.2 Unicast IPTV
- 5.6 By Geography
- 5.6.1 North America
- 5.6.1.1 United States
- 5.6.1.2 Canada
- 5.6.1.3 Mexico
- 5.6.2 South America
- 5.6.2.1 Brazil
- 5.6.2.2 Argentina
- 5.6.2.3 Rest of South America
- 5.6.3 Europe
- 5.6.3.1 Germany
- 5.6.3.2 United Kingdom
- 5.6.3.3 France
- 5.6.3.4 Italy
- 5.6.3.5 Spain
- 5.6.3.6 Rest of Europe
- 5.6.4 Asia-Pacific
- 5.6.4.1 China
- 5.6.4.2 India
- 5.6.4.3 Japan
- 5.6.4.4 South Korea
- 5.6.4.5 Australia and New Zealand
- 5.6.4.6 Rest of Asia-Pacific
- 5.6.5 Middle East
- 5.6.5.1 Saudi Arabia
- 5.6.5.2 United Arab Emirates
- 5.6.5.3 Turkey
- 5.6.5.4 Rest of Middle East
- 5.6.6 Africa
- 5.6.6.1 South Africa
- 5.6.6.2 Nigeria
- 5.6.6.3 Egypt
- 5.6.6.4 Rest of Africa
- 5.6.1 North America
6 COMPETITIVE LANDSCAPE
- 6.1 Market Concentration
- 6.2 Strategic Moves
- 6.3 Market Share Analysis
- 6.4 Company Profiles (includes Global level Overview, Market level overview, Core Segments, Financials as available, Strategic Information, Market Rank/Share for key companies, Products and Services, and Recent Developments)
- 6.4.1 AT&T Inc.
- 6.4.2 Verizon Communications Inc.
- 6.4.3 Deutsche Telekom AG
- 6.4.4 China Telecom Corp. Ltd.
- 6.4.5 Orange S.A.
- 6.4.6 British Telecom plc
- 6.4.7 Telefonica S.A.
- 6.4.8 DISH Network Corp.
- 6.4.9 Comcast Corp.
- 6.4.10 Vodafone Group plc
- 6.4.11 Akamai Technologies Inc.
- 6.4.12 Cisco Systems Inc.
- 6.4.13 Huawei Technologies Co. Ltd.
- 6.4.14 Ericsson AB
- 6.4.15 ARRIS (CommScope Holding Co.)
- 6.4.16 Sagemcom Broadband SAS
- 6.4.17 ZTE Corp.
- 6.4.18 Imagine Communications Corp.
- 6.4.19 Broadpeak S.A.
- 6.4.20 Amino Technologies plc
- 6.4.21 Tripleplay Services Ltd.
- 6.4.22 Sterlite Technologies Ltd.
- 6.4.23 Moftak Solutions
7 MARKET OPPORTUNITIES AND FUTURE OUTLOOK
- 7.1 White-Space and Unmet-Need Assessment

 網際網路協定電視(IPTV)市場-2026-2032年全球市場預測
 IPTV(網際網路協定電視)市場規模、佔有率、趨勢和預測:按合約類型、傳輸方式、終端類型、串流媒體方式、服務類型、最終用戶和地區分類,2026-2034年
 IPTV市場:按最終用戶和地區分類
 網路協定電視市場規模、佔有率、成長及全球產業分析:按類型、應用和地區分類的洞察,2026-2034 年預測
 2026年IPTV全球市場報告
 IPTV市場分析及預測(至2035年):依類型、產品、服務、技術、組件、應用、最終用戶、部署方式及設備分類網際網路通訊協定電視 (IPTV) CDN 市場分析及預測(至 2035 年):按類型、產品類型、服務、技術、組件、應用、部署類型、最終用戶、設備和解決方案分類全球IPTV市場規模、佔有率、趨勢和成長分析報告(2026-2034年)
 IPTV市場規模、佔有率和成長分析(按服務類型、組件、收入模式、最終用戶產業、設備類型和地區分類)-2026-2033年產業預測
 IPTV市場-全球產業規模、佔有率、趨勢、機會及預測(按組件、設備類型、產品/服務、傳輸方式、終端用戶產業、地區及競爭格局分類),2021-2031年