


 |
市場調查報告書
商品編碼
2122501
產業分析:市場佔有率分析、產業趨勢與統計、成長預測(2026-2031)Industrial Analytics - Market Share Analysis, Industry Trends & Statistics, Growth Forecasts (2026 - 2031) |
||||||

※ 本網頁內容可能與最新版本有所差異。詳細情況請與我們聯繫。
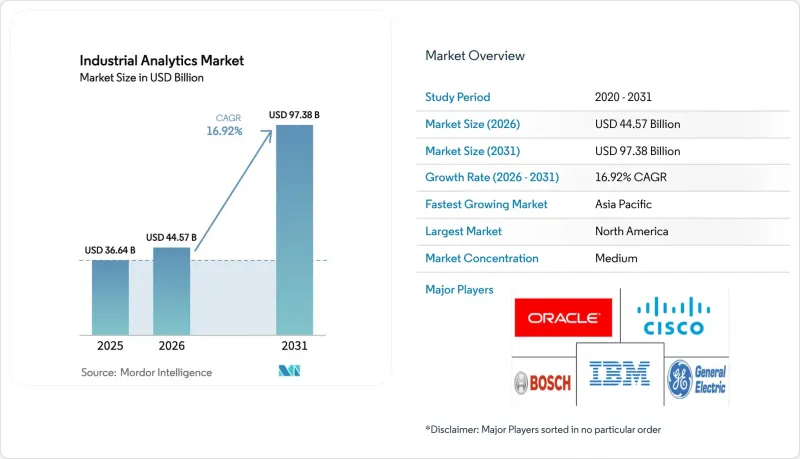
據 Mordor Intelligence 稱,2025 年工業分析市場價值為 366.4 億美元,預計到 2031 年將達到 973.8 億美元,而 2026 年為 445.7 億美元,預測期(2026-2031 年)的複合年成長率為 16.92%。
本報告按部署類型(本地部署和雲端部署)、元件(軟體和服務)、分析類型(預測分析等)、最終用戶產業(製造業、建設業等)、組織規模(中小企業等)、應用程式(資產績效管理等)和地區進行細分。市場預測以美元計價。
全球工業分析市場趨勢與洞察
擴展邊緣運算能力
邊緣局部推理消除了網路瓶頸,尤其適用於對延遲敏感的任務,例如機器人路徑規劃、基於視覺的品質檢查和變電站故障定位。Honeywell和谷歌雲端部署了微節點,用於現場處理感測器資料流,從而降低了 30% 的頻寬成本。 IBM 交付了一款 15 瓦的邊緣設備,該設備在連接不穩定的離岸平台上運行預測模型。微軟 Azure Stack 與西門子工業邊緣運算平台無縫整合,使製造商能夠集中訓練模型,然後將壓縮後的權重推送至現場閘道器。此類架構使即時控制迴路能夠在個位數毫秒的時限內運行,即使在網路故障期間也不會中斷運行。由此帶來的生產力提升使邊緣運算成為工業分析市場中最具影響力的驅動力之一。
將工業人工智慧整合到低程式碼平台中
拖放式工作流程可將分析功能無縫整合到維護、品管和物流流程中,無需掌握 Python 或 SQL 技能。貝恩公司的一項研究表明,在工廠中使用低程式碼工具代替傳統程式設計可將部署時間縮短 60%。 Microsoft Power Platform 標配針對幫浦、馬達和壓縮機最佳化的異常偵測模型。 IFS 和 ServiceNow 將感測器事件整合到工單建立過程中,使技術人員能夠立即獲得指導性操作。麥肯錫的「2025 燈塔網路」研究發現,實施低程式碼的工廠可將根本原因分析速度提高 25%。易於設定降低了小規模工廠的進入門檻,並加速了工業分析市場最佳實踐的採用。
跨境雲端採用中的資料主權問題
中國的資料安全法規定跨國公司必須將營運資料儲存在國內伺服器上,這阻礙了全球資料湖的整合。歐盟的GDPR限制了用於存取控制的員工生物識別資料的出口,迫使供應商建構區域推理叢集。印度的《數位個人資料保護法》草案也可能採用類似的在地化條款。這些資料孤島增加了基礎設施成本,分散了模型訓練,並減緩了功能的部署。對於工業分析市場而言,這會造成摩擦,供應商只能透過邊緣或混合架構來緩解這種摩擦。
細分市場分析
到 2025 年,在製造商採用付費使用制和預訓練模型的推動下,基於雲端的部署將佔據工業分析市場佔有率的 59.12%。在與 Microsoft Azure、AWS IoT SiteWise 和 Google Cloud Vertex AI 整合的推動下,雲端部署的工業分析市場預計將以 17.09% 的複合年成長率成長。本地部署系統繼續服務於國防和製藥行業對延遲要求極高的工作流程,佔市場需求的 40.88%。混合應用場景正在穩步成長。施耐德Schneider Electric的 EcoStruxure 支援雙向模型同步,允許受監管的資料保留在本地,同時受益於基於雲端的重新訓練。 ABB 的 Ability Genix 也提供類似的優勢,展示了聯邦架構如何在單一堆堆疊中滿足主權、運作和可擴展性要求。
隨著本地閘道器和集中式 MLOps 管道網路的擴展,企業可以在維護敏感資料的同時,將自身效能與雲端匿名化的同類指標進行比較和評估。這種混合方法深受跨國製造商的青睞,尤其是在跨多個司法管轄區開展業務的情況下。隨著編配工具的日趨成熟,混合架構有望成為主流,並鞏固其作為未來工業分析市場成長核心驅動力的地位。
儘管預計到2025年軟體收入將佔總收入的62.34%,但服務業正在迅速追趕,預計到2031年將以17.21%的複合年成長率成長。企業正將感測器整合、特徵工程和持續的模型調優等工作外包給Accenture、德勤和普華永道等合作夥伴。因此,工業分析市場的服務業成長速度超過了軟體產業。從SAP和IBM到西門子等供應商,都在提供包含設備設定檔庫、異常閾值校準和安全性修補程式等服務的打包解決方案。
工業資產會隨著時間劣化而老化,舉措變數也會波動,因此需要不斷調整分析方案。客戶依賴系統整合商來整合變更管理和領域專業知識。這種以服務為中心的模式正在將分析從資本支出轉變為營運支出,加深供應商與客戶之間的關係,並培育永續的收入來源,這將塑造到2031年的工業分析市場格局。
區域分析
到2025年,北美將佔據工業分析市場38.29%的佔有率。這主要得益於《晶片與科學法案》相關投資對半導體、汽車以及石油和天然氣產業的推動。聯邦政府的獎勵強制推行數位孿生技術,加速了新工廠(待開發區)分析技術的部署。加拿大的戰略創新基金正在支持航太和電動車電池領域的試點項目,而墨西哥的一個近岸外包項目則採用雲邊混合架構來加速工廠試運行。儘管各省隱私法的差異增加了合規負擔,但也刺激了對管治模組的需求,從而間接惠及軟體供應商。
預計到2031年,亞太地區的複合年成長率將達到17.96%。中國正將補貼與智慧製造指標掛鉤,鼓勵工廠實施數位孿生技術並維修生產線。印度的生產連結獎勵計畫計劃(PLI)要求即時品質分析是獲得補貼的必要條件,這促進了工業分析市場的協同效應。日本的「社會5.0」計畫正在利用疲勞預測模型推廣人機協作,而韓國的智慧工廠計畫則為中小企業採用分析技術津貼。澳洲礦業公司正在利用邊緣分析技術來提高運輸卡車的效率,東南亞出口企業正在實施合規性儀錶板以滿足歐盟的實質審查要求。
歐洲成長的關鍵在於永續發展合規。企業永續發展報告指令 (CSRD) 正在推動工廠層級的能源審計,德國的工業 4.0津貼鼓勵中型製造商採用數位孿生技術。法國的「未來工業」稅收優惠和英國的「智慧製造」津貼進一步擴大了市場需求。儘管東歐市場仍在發展中,俄羅斯本土供應商正透過提供符合國內標準的解決方案來規避進口限制,從而為工業分析市場增添區域特色。
中東、非洲和南美洲正成為新興的成長中心。沙烏地阿拉伯的「2030願景」正在推動石化和公共產業領域的分析技術應用,而南非的礦業公司正在實施安全分析技術以檢測氣體洩漏。巴西的農產品正在整合精密農業和食品加工分析技術,阿根廷的鋰生產商則利用相關模式來減少用水量。儘管全部區域的絕對支出低於已開發地區,但先導計畫正在加速推進,從而擴大了工業分析市場的全球覆蓋範圍。
其他好處:
- Excel格式的市場預測(ME)表
- 3個月的分析師支持
目錄
第1章:引言
- 研究假設和市場定義
- 調查範圍
第2章:調查方法
第3章執行摘要
第4章 市場狀況
- 市場概覽
- 市場促進因素
- 擴展邊緣運算能力
- 將工業人工智慧整合到低程式碼平台中
- 5G賦能的工業IoT網路的普及
- 促進節能運作方面的法規
- 資產密集產業數位孿生的標準化
- 計量收費分析模式的主流化
- 市場限制因素
- 跨境雲端採用中的資料主權問題
- 工業領域專業資料科學家短缺
- OT網路中的網實整合安全漏洞
- 整合舊設備的成本
- 產業價值鏈分析
- 監理情勢
- 技術展望
- 宏觀經濟因素對市場的影響
- 波特五力分析
第5章 市場規模與成長預測
- 不同的發展
- 現場
- 雲
- 按組件
- 軟體
- 服務
- 按分析類型
- 說明分析
- 預測分析
- 指示性分析
- 按最終用戶行業分類
- 製造業
- 建造
- 礦業
- 運輸/物流
- 公用事業
- 其他終端用戶產業
- 按組織規模
- 大公司
- 小型企業
- 透過使用
- 資產績效管理
- 品質和流程最佳化
- 供應鍊和庫存分析
- 能源管理
- 安全與風險分析
- 按地區
- 北美洲
- 美國
- 加拿大
- 墨西哥
- 歐洲
- 德國
- 英國
- 法國
- 俄羅斯
- 其他歐洲國家
- 亞太地區
- 中國
- 日本
- 印度
- 韓國
- 澳洲
- 其他亞太國家
- 中東和非洲
- 中東
- 沙烏地阿拉伯
- 阿拉伯聯合大公國
- 其他中東國家
- 非洲
- 南非
- 埃及
- 其他非洲國家
- 中東
- 南美洲
- 巴西
- 阿根廷
- 其他南美國家
- 北美洲
第6章 競爭情勢
- 市場集中度
- 策略趨勢
- 市佔率分析
- 公司簡介
- Cisco Systems
- IBM Corporation
- General Electric Company
- Amazon Web Services Inc.
- Oracle Corporation
- Hewlett-Packard Enterprise
- Robert Bosch GmbH
- Microsoft Corporation
- SAP SE
- ABB Ltd.
- Siemens AG
- Hitachi Ltd.
- Honeywell International Inc.
- Schneider Electric SE
- SAS Institute Inc.
- Splunk Inc.
- Rockwell Automation Inc.
- PTC Inc.
- Intel Corporation
- Uptake Technologies Inc.
第7章 市場機會與未來展望
According to Mordor Intelligence, the industrial analytics market size was valued at USD 36.64 billion in 2025 and is estimated to grow from USD 44.57 billion in 2026 to reach USD 97.38 billion by 2031, at a CAGR of 16.92% during the forecast period (2026-2031).
This report is Segmented by Deployment (On-Premises, and Cloud), Component (Software, and Services), Analytics Type (Predictive Analytics, and More), End-User Industry (Manufacturing, Construction, and More), Organization Size (Small and Medium-Sized Enterprises, and More), Application (Asset Performance Management, and More), and Geography. The Market Forecasts are Provided in Terms of Value (USD).
Global Industrial Analytics Market Trends and Insights
Expansion of Edge Computing Capabilities
Edge-localized inference eliminates network bottlenecks for latency-sensitive tasks such as robotic path planning, vision-based quality checks, and substation fault isolation. Honeywell and Google Cloud deployed micro-nodes that process sensor streams on-site, reducing bandwidth costs by 30%. IBM shipped 15-watt edge devices that run predictive models on offshore platforms where connectivity is sporadic. Microsoft Azure Stack integrates seamlessly with Siemens Industrial Edge, allowing manufacturers to train centrally and then push compressed weights to shop-floor gateways. Such architectures ensure uninterrupted operations when networks fail and allow real-time control loops to operate within single-digit millisecond windows. Resulting productivity gains make edge computing one of the highest-impact catalysts for the industrial analytics market.
Integration of Industrial AI in Low-Code Platforms
Drag-and-drop workflows seamlessly embed analytics into maintenance, quality, and logistics processes, eliminating the need for Python or SQL skills. Bain research showed a 60% reduction in deployment time when plants used low-code tools versus traditional programming. Microsoft Power Platform now ships with anomaly-detection models tuned for pumps, motors, and compressors. IFS and ServiceNow link sensor events to work-order generation, allowing technicians to receive prescriptive actions instantly. McKinsey's 2025 Lighthouse Network found that factories that embraced low-code recorded 25% faster root-cause analyses. The ease of configuration lowers barriers for small plants and accelerates the diffusion of industrial analytics market best practices.
Data-Sovereignty Concerns in Cross-Border Cloud Deployments
China's Data Security Law forces multinationals to store operational data on domestic servers, preventing global data-lake consolidation. The EU's GDPR restricts the exporting of employee biometrics used in access control, driving vendors to set up regional inference clusters. India's draft Digital Personal Data Protection Act may adopt similar localization clauses. Each silo raises infrastructure costs, fragments model training, and slows feature rollouts. For the industrial analytics market, this introduces friction that vendors can only mitigate with edge or hybrid architectures.
Other drivers and restraints analyzed in the detailed report include:
- Proliferation of 5G-Enabled Industrial IoT Networks
- Regulatory Push for Energy-Efficient Operations
- Shortage of Industrial-Domain-Specific Data Scientists
For complete list of drivers and restraints, kindly check the Table Of Contents.
Segment Analysis
Cloud-based implementations accounted for 59.12% of the industrial analytics market share in 2025, as manufacturers adopted consumption pricing and pre-trained models. The industrial analytics market size for cloud deployments is projected to expand at a 17.09% CAGR, driven by integrations with Microsoft Azure, AWS IoT SiteWise, and Google Cloud Vertex AI. On-premises systems continue to serve latency-critical workflows in defense and pharmaceutical industries, accounting for 40.88% of demand. Hybrid use cases are multiplying. Schneider Electric's EcoStruxure synchronizes models bi-directionally, allowing regulatory data to remain on-site while benefiting from cloud-based retraining. ABB's Ability Genix offers similar advantages, demonstrating how federated architectures can satisfy sovereignty, uptime, and scalability within a single stack.
The growing mesh of local gateways and centralized MLOps pipelines enables firms to retain sensitive data while benchmarking performance against anonymized peer metrics in the cloud. This blended approach resonates with multinational manufacturers juggling multiple jurisdictions. As orchestration tooling matures, hybrid architectures are expected to dominate new deployments, cementing their role at the core of future industrial analytics market growth.
Software represented 62.34% revenue in 2025, but services are catching up fast with a 17.21% CAGR through 2031. Enterprises outsource sensor integration, feature engineering, and continuous model tuning to partners such as Accenture, Deloitte, and PwC. As a result, the industrial analytics market size for services is expanding faster than the software layer. Vendors, ranging from SAP and IBM to Siemens, bundle managed offerings that include equipment profile libraries, anomaly threshold calibration, and security patching.
Because industrial assets age and process variables drift, analytics initiatives require perpetual recalibration. Customers rely on system integrators to embed change management and domain expertise. This service-centric model transforms analytics from a capital purchase into an operational expenditure, deepening vendor-client relationships and fostering recurring revenue streams that will shape the industrial analytics market through 2031.
Complete Report Scope:
- By Deployment
- On-Premises
- Cloud
- By Component
- Software
- Services
- By Analytics Type
- Descriptive Analytics
- Predictive Analytics
- Prescriptive Analytics
- By End-User Industry
- Manufacturing
- Construction
- Mining
- Transportation and Logistics
- Utilities
- Other End-User Industry
- By Organization Size
- Large Enterprises
- Small and Medium-Sized Enterprises
- By Application
- Asset Performance Management
- Quality and Process Optimization
- Supply-Chain and Inventory Analytics
- Energy Management
- Safety and Risk Analytics
- By Geography
- North America
- United States
- Canada
- Mexico
- Europe
- Germany
- United Kingdom
- France
- Russia
- Rest of Europe
- Asia-Pacific
- China
- Japan
- India
- South Korea
- Australia
- Rest of Asia-Pacific
- Middle East and Africa
- Middle East
- Saudi Arabia
- United Arab Emirates
- Rest of Middle East
- Africa
- South Africa
- Egypt
- Rest of Africa
- Middle East
- South America
- Brazil
- Argentina
- Rest of South America
- North America
Geography Analysis
North America contributed 38.29% of the industrial analytics market share in 2025, driven by investments in the semiconductor, automotive, and oil and gas sectors, linked to the CHIPS and Science Act. Federal incentives stipulate digital-twin capabilities, catalyzing analytics deployments across greenfield fabs. Canada's Strategic Innovation Fund backed aerospace and EV battery pilots, while Mexican nearshoring projects embraced cloud-edge hybrids to accelerate plant commissioning. Fragmented state privacy laws raise compliance overhead but also spur demand for governance modules, indirectly benefiting software vendors.
Asia-Pacific is forecast to record a 17.96% CAGR through 2031. China ties subsidies to smart-manufacturing metrics, pushing factories to retrofit lines with digital twins. India's Production-Linked Incentive scheme requires real-time quality analytics for reimbursement eligibility, creating a multiplier effect for the industrial analytics market. Japan's Society 5.0 promotes human-robot collaboration powered by fatigue-prediction models, while South Korea's smart-factory program subsidizes the adoption of SME analytics. Australia's mining sites utilize edge analytics to enhance haul-truck efficiency, while Southeast Asian exporters implement compliance dashboards to meet EU due diligence requirements.
Europe's growth story revolves around sustainability compliance. The Corporate Sustainability Reporting Directive promotes equipment-level energy audits, while Germany's Industrie 4.0 grants encourage mid-size manufacturers to adopt digital twins. France's Industry of the Future tax incentives and the United Kingdom's Made Smarter grants further expand demand. Eastern markets remain nascent, but local vendors in Russia tailor offerings to national standards to circumvent import restrictions, adding regional flavor to the industrial analytics market.
The Middle East and Africa, along with South America, represent emerging growth pockets. Saudi Arabia's Vision 2030 drives analytics for petrochemicals and utilities, and South Africa's mines deploy safety analytics to detect gas leaks. Brazil's agribusiness chains integrate precision agriculture with food-processing analytics, and Argentina's lithium producers utilize models to reduce water usage. Although absolute spend is lower than in developed regions, pilot projects are accelerating across these territories, widening the global footprint of the industrial analytics market.
- Cisco Systems
- IBM Corporation
- General Electric Company
- Amazon Web Services Inc.
- Oracle Corporation
- Hewlett-Packard Enterprise
- Robert Bosch GmbH
- Microsoft Corporation
- SAP SE
- ABB Ltd.
- Siemens AG
- Hitachi Ltd.
- Honeywell International Inc.
- Schneider Electric SE
- SAS Institute Inc.
- Splunk Inc.
- Rockwell Automation Inc.
- PTC Inc.
- Intel Corporation
- Uptake Technologies Inc.
Additional Benefits:
- The market estimate (ME) sheet in Excel format
- 3 months of analyst support
TABLE OF CONTENTS
1 INTRODUCTION
- 1.1 Study Assumptions and Market Definition
- 1.2 Scope of the Study
2 RESEARCH METHODOLOGY
3 EXECUTIVE SUMMARY
4 MARKET LANDSCAPE
- 4.1 Market Overview
- 4.2 Market Drivers
- 4.2.1 Expansion of Edge Computing Capabilities
- 4.2.2 Integration of Industrial AI in Low-Code Platforms
- 4.2.3 Proliferation of 5G-Enabled Industrial IoT Networks
- 4.2.4 Regulatory Push for Energy-Efficient Operations
- 4.2.5 Standardization of Digital Twins Across Asset-Intensive Sectors
- 4.2.6 Mainstream Adoption of Pay-per-Use Analytics Models
- 4.3 Market Restraints
- 4.3.1 Data-Sovereignty Concerns in Cross-Border Cloud Deployments
- 4.3.2 Shortage of Industrial-Domain-Specific Data Scientists
- 4.3.3 Cyber-physical Security Vulnerabilities in OT Networks
- 4.3.4 Legacy Equipment Integration Costs
- 4.4 Industry Value Chain Analysis
- 4.5 Regulatory Landscape
- 4.6 Technological Outlook
- 4.7 Impact of Macroeconomic Factors on the Market
- 4.8 Porter's Five Forces Analysis
- 4.8.1 Bargaining Power of Suppliers
- 4.8.2 Bargaining Power of Buyers
- 4.8.3 Threat of New Entrants
- 4.8.4 Threat of Substitutes
- 4.8.5 Intensity of Competitive Rivalry
5 MARKET SIZE AND GROWTH FORECASTS (VALUE)
- 5.1 By Deployment
- 5.1.1 On-Premises
- 5.1.2 Cloud
- 5.2 By Component
- 5.2.1 Software
- 5.2.2 Services
- 5.3 By Analytics Type
- 5.3.1 Descriptive Analytics
- 5.3.2 Predictive Analytics
- 5.3.3 Prescriptive Analytics
- 5.4 By End-User Industry
- 5.4.1 Manufacturing
- 5.4.2 Construction
- 5.4.3 Mining
- 5.4.4 Transportation and Logistics
- 5.4.5 Utilities
- 5.4.6 Other End-User Industry
- 5.5 By Organization Size
- 5.5.1 Large Enterprises
- 5.5.2 Small and Medium-Sized Enterprises
- 5.6 By Application
- 5.6.1 Asset Performance Management
- 5.6.2 Quality and Process Optimization
- 5.6.3 Supply-Chain and Inventory Analytics
- 5.6.4 Energy Management
- 5.6.5 Safety and Risk Analytics
- 5.7 By Geography
- 5.7.1 North America
- 5.7.1.1 United States
- 5.7.1.2 Canada
- 5.7.1.3 Mexico
- 5.7.2 Europe
- 5.7.2.1 Germany
- 5.7.2.2 United Kingdom
- 5.7.2.3 France
- 5.7.2.4 Russia
- 5.7.2.5 Rest of Europe
- 5.7.3 Asia-Pacific
- 5.7.3.1 China
- 5.7.3.2 Japan
- 5.7.3.3 India
- 5.7.3.4 South Korea
- 5.7.3.5 Australia
- 5.7.3.6 Rest of Asia-Pacific
- 5.7.4 Middle East and Africa
- 5.7.4.1 Middle East
- 5.7.4.1.1 Saudi Arabia
- 5.7.4.1.2 United Arab Emirates
- 5.7.4.1.3 Rest of Middle East
- 5.7.4.2 Africa
- 5.7.4.2.1 South Africa
- 5.7.4.2.2 Egypt
- 5.7.4.2.3 Rest of Africa
- 5.7.4.1 Middle East
- 5.7.5 South America
- 5.7.5.1 Brazil
- 5.7.5.2 Argentina
- 5.7.5.3 Rest of South America
- 5.7.1 North America
6 COMPETITIVE LANDSCAPE
- 6.1 Market Concentration
- 6.2 Strategic Moves
- 6.3 Market Share Analysis
- 6.4 Company Profiles (includes Global Level Overview, Market Level Overview, Core Segments, Financials as available, Strategic Information, Market Rank/Share for key companies, Products and Services, and Recent Developments)
- 6.4.1 Cisco Systems
- 6.4.2 IBM Corporation
- 6.4.3 General Electric Company
- 6.4.4 Amazon Web Services Inc.
- 6.4.5 Oracle Corporation
- 6.4.6 Hewlett-Packard Enterprise
- 6.4.7 Robert Bosch GmbH
- 6.4.8 Microsoft Corporation
- 6.4.9 SAP SE
- 6.4.10 ABB Ltd.
- 6.4.11 Siemens AG
- 6.4.12 Hitachi Ltd.
- 6.4.13 Honeywell International Inc.
- 6.4.14 Schneider Electric SE
- 6.4.15 SAS Institute Inc.
- 6.4.16 Splunk Inc.
- 6.4.17 Rockwell Automation Inc.
- 6.4.18 PTC Inc.
- 6.4.19 Intel Corporation
- 6.4.20 Uptake Technologies Inc.
7 MARKET OPPORTUNITIES AND FUTURE OUTLOOK
- 7.1 White-Space and Unmet-Need Assessment


