


 |
市場調查報告書
商品編碼
2122414
人工智慧在金融科技領域的應用:市場佔有率分析、產業趨勢與統計數據以及成長預測(2026-2031 年)AI In Fintech - Market Share Analysis, Industry Trends & Statistics, Growth Forecasts (2026 - 2031) |
||||||

※ 本網頁內容可能與最新版本有所差異。詳細情況請與我們聯繫。
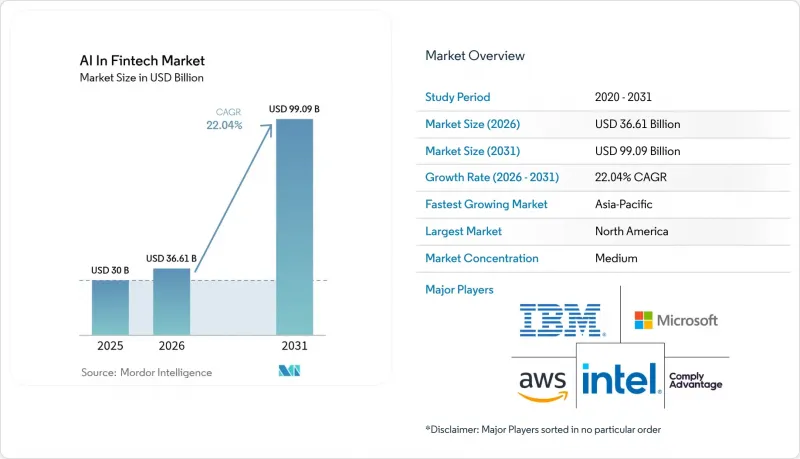
據 Mordor Intelligence 稱,2025 年金融科技領域的 AI 市值為 300 億美元,預計到 2031 年將達到 990.9 億美元,而 2026 年為 366.1 億美元,預測期內(2026-2031 年)的複合年成長率預計為 22.04%。
[1] 微軟,「Azure AI 如何重新定義金融服務業的生產力」(microsoft.com)。這項成長的驅動力來自強制性的開放銀行政策(該政策解鎖了詳細的客戶資料)、即時支付基礎設施的成熟以及雲端原生 AI 平台(這些平台降低了中型銀行的營運成本)。 [2] IBM,「金融服務業的生成式 AI-加速風險模式部署」(ibm.com)。與生成式 AI 協同工作,將模型風險管理所需的時間從數月縮短至數天,使金融機構能夠以前所未有的速度發布合規的風險模型。本報告按類型(解決方案、服務)、部署模式(雲端、本地部署)、應用程式(詐騙風險管理、聊天機器人和虛擬助理、其他)、組織規模(大型企業、中小企業和新型銀行)、最終用戶(零售銀行、保險、其他)和地區進行細分。
全球金融科技人工智慧市場趨勢與洞察
強制性開放銀行加速了人工智慧主導的流程自動化。
諸如PSD3之類的強制性資料共用法規使人工智慧引擎能夠獲得跨多家金融機構的一致且經授權的記錄進入許可權,從而實現即時信用評分和高度個人化的優惠。隨著PSD3於2024年生效,歐洲各銀行正在重新設計其產品開發流程,專注於「API優先」架構,將先前孤立的資料集輸入機器學習模型。中型金融機構正透過將監管合規成本轉化為收入成長的驅動力來提升競爭力,因為合規方面的投資也成為了創新的催化劑。在開放銀行採用率超過87%的金融機構的市場中,人工智慧服務的滲透率已經遠高於此。
即時支付資料流的爆炸性成長
VisaNet+AI 在每個核准流程中實現了 98% 的穩定性預測準確率,其「智慧結算預測」功能透過增加 7 天現金流預測,有助於減少流動性緩衝。即時結算網路能夠發送批量處理系統通常會遺漏的行為模式訊號,使 AI 能夠在交易開始後的幾毫秒內偵測出詐欺行為。研究表明,94% 的支付專業人士認為 AI 對於預防詐欺至關重要,77% 的消費者希望金融機構採用 AI 技術。紐約梅隆銀行已將其後勤部門結算指令處理的 90% 自動化,使分析師能夠專注於更高價值的任務。數據的即時可用性也使得基於動態現金流指標的即時信貸決策成為可能。
特定領域人工智慧專業人才短缺
對具備機器學習能力和深厚監管知識的專家的需求是供應量的兩到四倍,74%的雇主表示招聘困難。據歐洲銀行稱,只有25%的銀行設有正式的GenAI培訓項目,這加劇了技能缺口。與傳統金融職位相比,薪資高出40%至60%,使得科技巨頭和一級銀行更青睞這類人才。由於人才短缺,中型金融機構面臨專案工作量和成本飆升以及專案實施停滯的風險。
細分市場分析
預計到2025年,解決方案板塊的營收將達到214.4億美元,佔金融科技人工智慧市場的71.45%。企業傾向於選擇能夠將詐欺分析、客戶支援和管治整合到單一控制平台中的平台。 FICO的區塊鏈管治套件榮獲2025年創新獎,充分展現了整合解決方案為何正成為主流。服務板塊目前規模較小,但預計到2031年將以27.95%的複合年成長率成長,因為銀行正在尋求諮詢合作夥伴,以幫助他們建立複雜的GenAI流程並應對監管通知的激增(目前每天高達234份)。
顧問公司正在幫助企業將合規義務融入模型設計,從而縮短價值實現時間。這種需求使得專業的系統整合商異常繁忙,服務費也成為穩定的收入來源。隨著這些服務專業知識的普及,先前因缺乏內部技能而推遲採用人工智慧的中型企業如今也開始進入市場,擴大了金融科技市場的人工智慧基本客群。
到2025年,雲端環境將佔採用收入的81.35%,這主要得益於其強大的運算能力,能夠處理大量交易。在摩根大通,70%的應用程式部署在公共雲端上,而高度敏感的工作負載則位於一個價值20億美元的私人設施中。隨著監管機構收緊資料居住規則,以及銀行尋求降低單一供應商故障帶來的風險,混合雲的採用預計將以27.4%的複合年成長率成長。
混合模式充分利用了本地和雲端的優勢:一方面,訓練流程部署在本地以確保資料主權;另一方面,推理處理則在雲端運作。這種柔軟性使混合模型成為一種永續的選擇,尤其適用於那些嚴格執行資料本地化的司法管轄區。
區域分析
預計到2025年,北美將佔據37.60%的收入佔有率,這得益於其成熟的金融體系和清晰但分散的監管指導。摩根大通擁有2,000名人工智慧專家,並已部署超過400個應用案例,凸顯了其在本地的高水準專業能力。加拿大新興銀行,例如Neo Financial,正在利用人工智慧服務於服務不足的群體,而墨西哥則在利用人工智慧促進普惠金融。隨著公共和私人投資的持續投入,北美將繼續保持其作為創新試驗場的地位,並將全球最佳實踐帶回金融科技人工智慧市場。
預計到2031年,亞太地區的複合年成長率將達到33.1%,位居全球之首。 2024年,中國在生成式人工智慧領域投資了21億美元,企業採用率高達83%,遠超過歐美地區的採用率。印度和日本正透過普惠信貸和依賴人工智慧引擎的量化交易平台,進一步擴大其發展動能。該地區的金融科技收入預計將從2021年的2,450億美元成長到2030年的1.5兆美元,87%的銀行計劃與金融科技公司建立合作關係。新加坡是行動支付領域的主導,而澳洲和紐西蘭預計將創造與其GDP不成比例的巨額人工智慧價值。
在歐洲,合規負擔使得人工智慧的普及應用保持穩定但受到限制。歐盟人工智慧立法雖然增加了管治成本,但也引入了風險分級體系,以確保其合乎倫理的實施。在英國,生成式人工智慧的使用率已達70%,銀行正利用脫歐後的柔軟性來客製化其沙盒環境。德國和法國正在資助其主要企業內部的人工智慧卓越中心,而北歐國家則在推動綠色金融評分框架的測試和實施。在東歐市場,人工智慧正被用於跨境工資匯款,這正在重新定義傳統服務的邊界。
其他好處
- Excel格式的市場預測(ME)表
- 3個月的分析師支持
目錄
第1章:引言
- 研究假設和市場定義
- 調查範圍
第2章:調查方法
第3章執行摘要
第4章 市場狀況
- 市場概覽
- 市場促進因素
- 強制性開放銀行加速了人工智慧主導的流程自動化。
- 即時支付資料流的爆炸性成長
- 雲端原生人工智慧平台降低中型金融機構的總擁有成本
- 利用生成式人工智慧輔助駕駛技術,大幅縮短模型風險管理的周期時間。
- 利用人工智慧驅動的ESG評估,創造綠色金融獎勵。
- 市場限制因素
- 特定領域人工智慧專業人才短缺
- 人工智慧模型管治的監管指南存在差異
- 由於GPU供應鏈波動性增加,推理成本上升。
- 價值鏈分析
- 監理情勢
- 技術展望
- 波特五力分析
- 宏觀經濟因素對市場的影響
第5章 市場規模與成長預測
- 按類型
- 解決方案
- 服務
- 按實現類型
- 雲
- 現場
- 透過使用
- 詐欺風險管理
- 聊天機器人和虛擬助手
- 信用評分和信用評估
- 定量分析與資產管理
- 監理科技合規性分析
- 其他用途
- 按組織規模
- 大公司
- 中小企業和新型銀行
- 最終用戶
- 零售銀行
- 保險
- 投資和資產管理
- 支付和匯款服務供應商
- 其他
- 按地區
- 北美洲
- 美國
- 加拿大
- 墨西哥
- 南美洲
- 巴西
- 阿根廷
- 智利
- 其他南美國家
- 歐洲
- 德國
- 英國
- 法國
- 義大利
- 西班牙
- 其他歐洲國家
- 亞太地區
- 中國
- 印度
- 日本
- 韓國
- 馬來西亞
- 新加坡
- 澳洲
- 其他亞太國家
- 中東和非洲
- 中東
- 阿拉伯聯合大公國
- 沙烏地阿拉伯
- 土耳其
- 其他中東國家
- 非洲
- 南非
- 奈及利亞
- 其他非洲地區
- 中東
- 北美洲
第6章 競爭情勢
- 市場集中度
- 策略趨勢
- 市佔率分析
- 公司簡介
- Amazon Web Services, Inc.
- Microsoft Corporation
- International Business Machines Corporation
- Google LLC(Alphabet Inc.)
- Fair Isaac Corporation
- SAS Institute Inc.
- Intel Corporation
- NVIDIA Corporation
- Salesforce, Inc.
- Stripe, Inc.
- Plaid Inc.
- ComplyAdvantage Ltd.
- Onfido Ltd.
- Ripple Labs Inc.
- DataRobot, Inc.
- Upstart Holdings, Inc.
- ZestFinance, Inc.
- Darktrace Limited
- Truera, Inc.
- Active Intelligence Pte Ltd.
第7章 市場機會與未來展望
According to Mordor Intelligence, the AI in Fintech market size was valued at USD 30 billion in 2025 and estimated to grow from USD 36.61 billion in 2026 to reach USD 99.09 billion by 2031, at a CAGR of 22.04% during the forecast period (2026-2031).
[1] Microsoft, "How Azure AI is redefining financial services productivity," microsoft.com Growth is being propelled by open-banking mandates that liberate granular customer data, the maturation of real-time payment rails, and cloud-native AI platforms that trim operating costs for mid-tier banks. [2] IBM, "Generative AI in financial services: Accelerating risk model deployment," ibm.com Generative AI copilots are compressing model-risk-management timelines from months to days, letting institutions release compliant risk models at unprecedented speed. This report is Segmented by Type (Solutions and Services), Deployment (Cloud and On-Premise), Application (Fraud and Risk Management, Chatbots and Virtual Assistants, and More), Organization Size (Large Enterprises and SMEs and Neo-Banks), End-User (Retail Banking, Insurance, and More), and Geography.
Global AI In Fintech Market Trends and Insights
Open Banking Mandates Accelerating AI-Led Process Automation
Mandatory data-sharing rules such as PSD3 grant AI engines consistent, permissioned access to multi-institution bank records, enabling real-time credit scoring and hyper-personalized offers. PSD3 went live in 2024, prompting European banks to redesign product origination workflows around API-first architectures that feed machine-learning models with previously siloed datasets. Mid-tier institutions gain competitive parity because compliance investments double as innovation enablers, turning regulatory cost into revenue growth levers. Markets where open-banking adoption exceeds 87% of institutions already display elevated AI service penetration.
Explosion of Real-Time Payments Data Streams
VisaNet +AI processes each authorization with 98% stability prediction accuracy, while its Smarter Settlement Forecast adds seven-day cash-flow projections that shrink liquidity buffers. Real-time rails broadcast behavioral signals that batch systems miss, letting AI flag fraud milliseconds after initiation . Surveys show 94% of payments professionals view AI as indispensable for fraud mitigation, and 77% of consumers expect institutions to deploy it. BNY Mellon automated 90% of back-office payment instruction handling, freeing analysts for value-added tasks. Instant data availability also powers live credit decisions based on dynamic cash-flow metrics.
Shortage of Domain-Specific AI Talent
Demand for professionals who blend machine-learning mastery with regulatory fluency exceeds supply by 2-4 times, with 74% of employers reporting hiring struggles. European banks note that only 25% have formal GenAI training pipelines, widening capability gaps. Salary premiums of 40-60% over traditional finance roles tilt the playing field toward tech giants and tier-one banks. Mid-tier firms risk stalled deployments as talent scarcity inflates project timelines and costs.
Other drivers and restraints analyzed in the detailed report include:
- Cloud-Native AI Platforms Lowering TCO for Mid-Tier Financial Institutions
- GenAI Copilots Slashing Model-Risk-Management Cycle Times
- Fragmented Regulatory Guidance on AI Model Governance
For complete list of drivers and restraints, kindly check the Table Of Contents.
Segment Analysis
Solutions generated USD 21.44 billion in 2025, equal to 71.45% of the AI in Fintech market. Enterprises favor platforms that unify fraud analytics, customer support, and governance within a single control plane. FICO's blockchain-enabled governance suite, which won a 2025 innovation award, illustrates why integrated offerings dominate. The services segment is smaller today but is projected to grow at 27.95% CAGR through 2031 as banks seek advisory partners to configure complex GenAI pipelines and manage the daily swell of 234 regulatory notices.
Consultancies help translate compliance obligations into model design, accelerating time to value. This demand keeps specialized system integrators busy and cements service fees as a predictable revenue stream. As service expertise proliferates, mid-tier firms that once delayed AI adoption due to limited internal skill sets now jump in, broadening the AI in Fintech market customer base.
Cloud environments delivered 81.35% of deployment revenues in 2025 on the back of elastic compute that processes massive transaction volumes. JPMorgan Chase's architecture shows 70% of applications in public cloud while sensitive workloads reside in USD 2 billion private facilities. Hybrid deployments are forecast to advance at 27.4% CAGR as regulators tighten residency rules and banks look to limit exposure to single-vendor outages.
Hybrid models place training pipelines on-premise for sovereignty yet run inference in cloud, unlocking the best of both worlds. This flexibility positions hybrid as a durable choice, particularly in jurisdictions enforcing strict data localization.
Complete Report Scope:
- By Component
- Solutions
- Services
- By Deployment Mode
- Cloud
- On-premise
- By Application
- Fraud and Risk Management
- Chatbots and Virtual Assistants
- Credit Scoring and Underwriting
- Quantitative and Asset Management
- RegTech and Compliance Analytics
- Others
- By Organization Size
- Large Enterprises
- SMEs and Neo-banks
- By End-user
- Retail Banking
- Insurance
- Investment and Wealth Management
- Payments and Remittances Providers
- Others
- By Geography
- North America
- United States
- Canada
- Mexico
- South America
- Brazil
- Argentina
- Chile
- Rest of South America
- Europe
- Germany
- United Kingdom
- France
- Italy
- Spain
- Rest of Europe
- Asia-Pacific
- China
- India
- Japan
- South Korea
- Malaysia
- Singapore
- Australia
- Rest of Asia-Pacific
- Middle East and Africa
- Middle East
- United Arab Emirates
- Saudi Arabia
- Turkey
- Rest of Middle East
- Africa
- South Africa
- Nigeria
- Rest of Africa
- Middle East
- North America
Geography Analysis
North America held 37.60% revenue share in 2025, supported by a mature financial stack and clear though fragmented regulatory guidance. JPMorgan Chase fields 2,000 AI specialists and over 400 live use cases, underscoring local skill depth. Canada's challenger banks such as Neo Financial scale AI to underserved segments, and Mexico leverages AI for financial inclusion. Continued public-private investment sustains North America as an innovation laboratory, feeding global best practices back into the AI in Fintech market.
Asia-Pacific is projected to register the fastest 33.1% CAGR through 2031. China poured USD 2.1 billion into generative AI in 2024 and records 83% enterprise usage, dwarfing western penetration rates. India and Japan extend momentum through inclusive credit and quantitative trading desks that rely on AI engines. The region's fintech revenue could move from USD 245 billion in 2021 to USD 1.5 trillion by 2030, with 87% of banks planning fintech partnerships. Singapore leads in mobile payments, while Australia and New Zealand expect disproportionate AI value capture relative to GDP.
Europe demonstrates strong adoption tempered by compliance overhead. The EU AI Act imposes a risk-tier system that elevates governance costs but assures ethical deployment. The UK reports 70% GenAI usage, leveraging post-Brexit agility to tailor banking sandboxes. Germany and France fund AI centers of excellence inside national champions, and the Nordics pilot green-finance scoring frameworks. Eastern markets experiment with AI for cross-border wage remittances, redrawing traditional service boundaries.
- Amazon Web Services, Inc.
- Microsoft Corporation
- International Business Machines Corporation
- Google LLC (Alphabet Inc.)
- Fair Isaac Corporation
- SAS Institute Inc.
- Intel Corporation
- NVIDIA Corporation
- Salesforce, Inc.
- Stripe, Inc.
- Plaid Inc.
- ComplyAdvantage Ltd.
- Onfido Ltd.
- Ripple Labs Inc.
- DataRobot, Inc.
- Upstart Holdings, Inc.
- ZestFinance, Inc.
- Darktrace Limited
- Truera, Inc.
- Active Intelligence Pte Ltd.
Additional Benefits:
- The market estimate (ME) sheet in Excel format
- 3 months of analyst support
TABLE OF CONTENTS
1 INTRODUCTION
- 1.1 Study Assumptions and Market Definition
- 1.2 Scope of the Study
2 RESEARCH METHODOLOGY
3 EXECUTIVE SUMMARY
4 MARKET LANDSCAPE
- 4.1 Market Overview
- 4.2 Market Drivers
- 4.2.1 Open banking mandates accelerating AI-led process automation
- 4.2.2 Explosion of real-time payments data streams
- 4.2.3 Cloud-native AI platforms lowering TCO for mid-tier FIs
- 4.2.4 GenAI copilots slashing model-risk-management cycle-times
- 4.2.5 AI-powered ESG scoring unlocking green-finance incentives
- 4.3 Market Restraints
- 4.3.1 Shortage of domain-specific AI talent
- 4.3.2 Fragmented regulatory guidance on AI model governance
- 4.3.3 Rising GPU supply-chain volatility inflating inference costs
- 4.4 Value Chain Analysis
- 4.5 Regulatory Landscape
- 4.6 Technological Outlook
- 4.7 Porter's Five Forces Analysis
- 4.7.1 Bargaining Power of Suppliers
- 4.7.2 Bargaining Power of Buyers
- 4.7.3 Threat of New Entrants
- 4.7.4 Threat of Substitutes
- 4.7.5 Intensity of Competitive Rivalry
- 4.8 Impact of Macroeconomic Factors on the Market
5 MARKET SIZE AND GROWTH FORECASTS (VALUE)
- 5.1 By Component
- 5.1.1 Solutions
- 5.1.2 Services
- 5.2 By Deployment Mode
- 5.2.1 Cloud
- 5.2.2 On-premise
- 5.3 By Application
- 5.3.1 Fraud and Risk Management
- 5.3.2 Chatbots and Virtual Assistants
- 5.3.3 Credit Scoring and Underwriting
- 5.3.4 Quantitative and Asset Management
- 5.3.5 RegTech and Compliance Analytics
- 5.3.6 Others
- 5.4 By Organization Size
- 5.4.1 Large Enterprises
- 5.4.2 SMEs and Neo-banks
- 5.5 By End-user
- 5.5.1 Retail Banking
- 5.5.2 Insurance
- 5.5.3 Investment and Wealth Management
- 5.5.4 Payments and Remittances Providers
- 5.5.5 Others
- 5.6 By Geography
- 5.6.1 North America
- 5.6.1.1 United States
- 5.6.1.2 Canada
- 5.6.1.3 Mexico
- 5.6.2 South America
- 5.6.2.1 Brazil
- 5.6.2.2 Argentina
- 5.6.2.3 Chile
- 5.6.2.4 Rest of South America
- 5.6.3 Europe
- 5.6.3.1 Germany
- 5.6.3.2 United Kingdom
- 5.6.3.3 France
- 5.6.3.4 Italy
- 5.6.3.5 Spain
- 5.6.3.6 Rest of Europe
- 5.6.4 Asia-Pacific
- 5.6.4.1 China
- 5.6.4.2 India
- 5.6.4.3 Japan
- 5.6.4.4 South Korea
- 5.6.4.5 Malaysia
- 5.6.4.6 Singapore
- 5.6.4.7 Australia
- 5.6.4.8 Rest of Asia-Pacific
- 5.6.5 Middle East and Africa
- 5.6.5.1 Middle East
- 5.6.5.1.1 United Arab Emirates
- 5.6.5.1.2 Saudi Arabia
- 5.6.5.1.3 Turkey
- 5.6.5.1.4 Rest of Middle East
- 5.6.5.2 Africa
- 5.6.5.2.1 South Africa
- 5.6.5.2.2 Nigeria
- 5.6.5.2.3 Rest of Africa
- 5.6.5.1 Middle East
- 5.6.1 North America
6 COMPETITIVE LANDSCAPE
- 6.1 Market Concentration
- 6.2 Strategic Moves
- 6.3 Market Share Analysis
- 6.4 Company Profiles (includes Global level Overview, Market level overview, Core Segments, Financials as available, Strategic Information, Market Rank/Share for key companies, Products and Services, and Recent Developments)
- 6.4.1 Amazon Web Services, Inc.
- 6.4.2 Microsoft Corporation
- 6.4.3 International Business Machines Corporation
- 6.4.4 Google LLC (Alphabet Inc.)
- 6.4.5 Fair Isaac Corporation
- 6.4.6 SAS Institute Inc.
- 6.4.7 Intel Corporation
- 6.4.8 NVIDIA Corporation
- 6.4.9 Salesforce, Inc.
- 6.4.10 Stripe, Inc.
- 6.4.11 Plaid Inc.
- 6.4.12 ComplyAdvantage Ltd.
- 6.4.13 Onfido Ltd.
- 6.4.14 Ripple Labs Inc.
- 6.4.15 DataRobot, Inc.
- 6.4.16 Upstart Holdings, Inc.
- 6.4.17 ZestFinance, Inc.
- 6.4.18 Darktrace Limited
- 6.4.19 Truera, Inc.
- 6.4.20 Active Intelligence Pte Ltd.
7 MARKET OPPORTUNITIES AND FUTURE OUTLOOK
- 7.1 White-space and Unmet-need Assessment

 2026年全球人工智慧(AI)驅動的金融科技合規和監管科技平台市場報告
 金融科技領域人工智慧市場—2026-2032年全球市場預測
 神經多樣性族群的金融素養和輔導平台市場預測(至2034年)-按解決方案類型、交付方式、經營模式、最終用戶和地區分類的全球分析
 金融科技人工智慧市場規模、佔有率、趨勢和預測:按類型、部署模式、應用和地區分類,2026-2034年
 金融科技領域人工智慧(AI)市場規模、佔有率和成長分析:按組件、技術、部署模式、企業規模、應用、最終用戶和地區分類-2026-2033年產業預測
 2026-2030年全球金融科技領域人工智慧市場
 金融科技領域人工智慧市場-全球產業規模、佔有率、趨勢、機會和預測:按組件、部署模式、應用、地區和競爭格局分類,2021-2031年2026年全球利用人工智慧(AI)進行債務風險配置市場報告2026年金融領域生成式人工智慧全球市場報告2026年金融科技領域人工智慧全球市場報告