


 |
市場調查報告書
商品編碼
2122406
分散式天線系統:市場佔有率分析、產業趨勢與統計、成長預測(2026-2031)Distributed Antenna Systems - Market Share Analysis, Industry Trends & Statistics, Growth Forecasts (2026 - 2031) |
||||||

※ 本網頁內容可能與最新版本有所差異。詳細情況請與我們聯繫。
根據 Mordor Intelligence 預測,分散式天線系統 (DAS) 的市場規模將從 2025 年的 109.1 億美元和 2026 年的 115.2 億美元成長到 2031 年的 147.2 億美元,2026 年至 2031 年的年複合成長率(CAGR)。
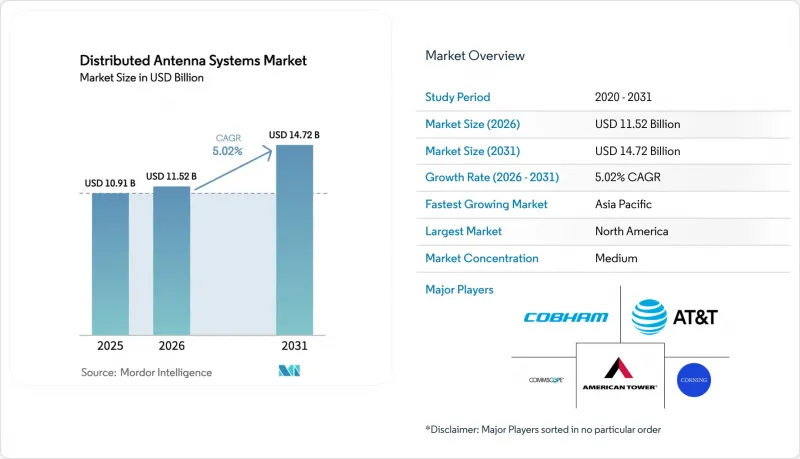
本報告按天線類型(有源、無源、數位、混合)、最終用戶(製造業、醫療保健、政府/公共安全、其他)、應用(企業級DAS、公共安全DAS、中立主機/多運營商DAS)、所有權模式(運營商擁有、中立主機、企業所有)和地區進行細分。市場預測以美元計價。
全球分散式天線系統市場趨勢及洞察
5G網路密度的不斷提高,正在推動對室內覆蓋的需求成長。
由於毫米波訊號在穿過牆壁時會遭受顯著衰減,電信業者不得不利用室內平台來補充其室外廣域基地台的部署。中國364萬個5G基地台以及新加坡要求到2025年其5G網路50%必須採用獨立網路(SA)模式的規定,都充分體現了這項需求。在丹佛的Empower Field體育場部署的中立託管分散式天線系統(DAS)在兩場音樂會期間傳輸了Terabyte的數據——相當於一場典型NFL比賽數據量的數倍——這表明大規模場館需要針對特定場館的基礎設施。雖然向C頻段的過渡平衡了訊號穿透力和容量,但大型設施仍需要室內節點。鑑於80%的行動流量發生在室內,分散式天線系統市場的電信業者可以預期,在體育場館、醫院和交通樞紐等用戶高度聚集的場所,投資能夠迅速獲得回報。
關於建築物內公共安全通訊覆蓋範圍的監管義務
美國聯邦通訊委員會 (FCC) 第 21-346 號文件規定,到 2025 年,商業建築的室內 LTE 覆蓋率必須達到 99%,這使得分散式天線系統 (DAS) 的部署至關重要。 FirstNet 的 17 億美元農村津貼計劃已在 3 萬棟建築中部署了系統,獎勵業主達到「增強型 911」的準確率標準。歐洲關於交通走廊通訊覆蓋的指令以及新加坡消防安全法的修訂也帶來了類似的壓力。像克利夫蘭診所這樣的大規模醫療機構正在將 FirstNet 和商用 5G 網路整合到一個統一的網路中,以確保公共安全和醫療營運的運作。遵守這些法規已將 DAS引進週期從可選變為強制,縮短了房地產開發商的決策時間。
與多個運營商協調並確保頻段安全的複雜性。
當為同一設施內的三家或三家以上電信業者提供服務時,需要就頻率和功率遮罩進行詳細談判,這會將專案工期延長6至18個月。在超級穹頂體育館,協調AT&T、Verizon和T-Mobile的91個區域耗時14個月,之後才得以開通商業服務。由於濾波不足會導致被動互調,造成10-15 dB的訊號衰減,因此整合商需要額外支出進行檢查。許多新興市場的監管機構仍以營運商為單位而非以場館為單位發放頻段許可證,這限制了分散式天線系統市場中立性的優勢。
細分市場分析
在分散式天線系統 (DAS) 市場,混合平台正在擴大其市場佔有率,介於高功率主動單元和同軸被動佈局之間。混合 DAS 的複合年成長率 (CAGR) 為 6.10%,預計將繼續從目前仍佔據 DAS 市場最大佔有率的主動系統中蠶食市場佔有率。有源單元提供多頻段輸出,但每個站點消耗 5-15kW 的功率,並且比被動系統佔用多 65% 的機架空間,迫使設施所有者升級冷卻系統和電源電路。被動解決方案在面積小於 10 萬平方英尺的建築物中仍然可行,但每 100 英尺同軸電纜會產生 3-6dB 的衰減。數位光纖透過將射頻訊號轉換為光訊號,可降低 60-70% 的能耗,並且還便於軟體升級。 LampSite 在 20 個國家的部署就證明了這一點。
混合系統整合了光纖回程傳輸和本地放大功能,從而實現了資本投資和電力預算之間的平衡。 Verizon 在奧斯汀部署的開放式無線存取網 (Open RAN) 採用三星軟體單元和 CommScope 天線,以避免被單一供應商鎖定。電信業者傾向於混合系統,因為能源成本目前佔營運支出 (OPEX) 的 20-30%,而且軟體控制允許在夜間關閉部分扇區。由於安裝工作分階段進行,跨越多個預算週期,因此提供模組化射頻單元和遠端軟體金鑰的供應商擁有了更大的定價權。
即使到了2025年,電信公司仍將佔銷售額的28.60%,並持續推動需求成長,但成長最快的產業是醫院。醫院市場正以7.80%的複合年成長率擴張,因為在分散式天線系統(DAS)市場中,服務中斷對於存取電子健康記錄、傳輸影像資料和即時監控等環節都是不可接受的。羅徹斯特的梅奧診所透過運作康寧DAS系統,為超過7萬台醫療設備提供支持,充分體現了DAS在營運中的重要性。在製造業,由於CBRS小型基地台每平方英尺成本僅為0.97美元至1.12美元,因此在機器人應用中更受歡迎,這也阻礙了DAS的普及。
政府和公共安全機構依賴14頻段的整合,這種應用場景使得分散式天線系統(DAS)的市場佔有率在小型基地台的競爭下仍然保持強勁。像Empower Field這樣的體育場館正在利用DAS的容量來實現行動點餐和擴增實境(AR)回放,從而創造輔助收入。像哈茲菲爾德-傑克遜國際機場這樣的交通樞紐正在採用中立主機網路,以避免多次重新配置。
區域分析
預計到2025年,北美將佔分散式天線系統市場收入的38.50%,主要得益於美國聯邦通訊委員會(FCC)強制要求99%的室內覆蓋率以及FirstNet在3萬棟建築中的部署規模。在像Empower Field這樣的高流量場所,兩天內傳輸了Terabyte的數據,證明了每平方英尺4-8美元的投資是合理的。雖然該地區更傾向於採用中立的優質主機定價模式,但營運商正將重點放在體育場館、機場和醫療機構等中檔場所,因為這些場所的投資回收期預計在3-7年內即可收回。
亞太地區以7.43%的複合年成長率引領短期成長。這主要得益於中國364萬個5G基地台、印度70萬個5G基地台的目標,以及新加坡的全國室內覆蓋目標。香港和深圳的大規模都市區項目展現了5G部署的快速性,僅用10週就實現了全線覆蓋。在日本,由於建築密集且老舊,維修難度較大,迫使供應商採用平板天線。韓國和澳洲已實現覆蓋目標,目前正致力於升級現有設施。
歐洲的能源效率法規正在推動數位化解決方案的發展,這些方案可將能耗降低 60-70%。然而,由於缺乏統一的建築規範,獲得許可可能需要 3-12 個月,從而減緩了跨國的部署。英國的「Gigabit項目」和強制性交通走廊正在積極推廣公共資助的項目,但歷史建築需要使用特殊的防火電纜。在中東和非洲,受利雅德、杜拜和杜哈等城市智慧城市計畫的推動,預計到 2031 年將快速成長。 du 公司建造的首個 5G-Advanced 室內網路實現了 5.1 Gbps 的速度,這表明市場對尖端性能有著極高的需求。沙烏地阿拉伯的一個頻率共用試點計畫表明,監管的柔軟性有可能避免其他地區常見的協調延遲。在拉丁美洲和撒哈拉以南非洲,分散式天線系統 (DAS) 仍處於發展初期,目前僅限於高階購物中心和機場,但都市化和智慧型手機普及率的趨勢表明,如果資金籌措障礙得到緩解,DAS 的需求潛力巨大。
其他好處
- Excel格式的市場預測(ME)表
- 3個月的分析師支持
目錄
第1章:引言
- 研究假設和市場定義
- 調查範圍
第2章:調查方法
第3章執行摘要
第4章 市場狀況
- 市場概覽
- 市場促進因素
- 5G網路密度的不斷提高,正在推動對室內覆蓋的需求成長。
- 關於建築物內公共安全通訊覆蓋範圍的監管義務
- 透過中立的房東經營模式)。
- 透過人工智慧驅動的分散式天線系統(DAS)自主最佳化,降低網路營運成本(OPEX)。
- 大型設施中行動數據流量增加
- 物聯網與智慧建築應用的普及
- 市場限制因素
- 與多個運營商協調並確保頻段安全的複雜性。
- 能源密集系統面臨永續性的壓力
- 大型設施的高昂安裝和實施成本
- 複雜的法規核准和建築/分區許可
- 產業價值鏈分析
- 監理情勢
- 技術展望
- 宏觀經濟因素的影響
- 波特五力分析
第5章 市場規模與成長預測
- 依天線類型
- 積極的
- 被動的
- 數位的
- 混合
- 最終用戶
- 製造業
- 衛生保健
- 政府/公共安全
- 運輸/物流
- 體育和娛樂設施
- 電信營運商
- 其他商業領域
- 透過使用
- 企業DAS
- 公共安全 DAS
- 中立主機多提供商分散式天線系統
- 自有車型
- 承運人所有權
- 中立主機
- 公司所有權
- 按地區
- 北美洲
- 美國
- 加拿大
- 墨西哥
- 歐洲
- 英國
- 德國
- 荷蘭
- 法國
- 愛爾蘭
- 其他歐洲國家
- 亞太地區
- 中國
- 印度
- 新加坡
- 日本
- 澳洲
- 印尼
- 其他亞太國家
- 南美洲
- 巴西
- 智利
- 其他南美國家
- 中東
- 阿拉伯聯合大公國
- 沙烏地阿拉伯
- 土耳其
- 其他中東國家
- 非洲
- 南非
- 奈及利亞
- 其他非洲地區
- 北美洲
第6章 競爭情勢
- 市場集中度
- 策略趨勢
- 市佔率分析
- 公司簡介
- CommScope Holding Company Inc.
- Corning Incorporated
- AT&T Inc.
- American Tower Corporation
- Cobham Limited
- SOLiD Inc.
- TE Connectivity Ltd.
- Comba Telecom Systems Holdings Ltd.
- Boingo Wireless Inc.
- JMA Wireless
- Dali Wireless Inc.
- Zinwave(Wilson Electronics)
- Nokia Corporation
- Ericsson AB
- Huawei Technologies Co. Ltd.
- Radio Frequency Systems
- Advanced RF Technologies Inc.
- PBE Axell Wireless
- Maven Wireless Sweden AB
- Baicells Technologies Co. Ltd.
- Tower Bersama Group
- Anixter International Inc.
- Amphenol Corporation
- Antenna Products Corporation
第7章 市場機會與未來展望
According to Mordor Intelligence, the distributed antenna systems market size is projected to expand from USD 10.91 billion in 2025 and USD 11.52 billion in 2026 to USD 14.72 billion by 2031, registering a CAGR of 5.02% between 2026 to 2031.
This report is Segmented by Antenna Type (Active, Passive, Digital, and Hybrid), End-User (Manufacturing, Healthcare, Government and Public Safety, and More), Application (Enterprise DAS, Public Safety DAS, and Neutral-Host/Multi-Operator DAS), Ownership Model (Carrier-Owned, Neutral-Host, and Enterprise-Owned), and Geography. The Market Forecasts are Provided in Terms of Value (USD).
Global Distributed Antenna Systems Market Trends and Insights
5G Network Densification Boosting Indoor-Coverage Demand
Millimeter-wave signals suffer high attenuation through walls, so operators are compelled to supplement outdoor macro roll-outs with indoor platforms, especially in China's 3.64 million 5G base-station footprint and Singapore's 50% standalone 5G mandate for 2025. Neutral-host DAS at Empower Field in Denver moved 50 terabytes over two concerts, several times a typical NFL game, illustrating how large venues require venue-specific infrastructure. The switch to C-Band balances penetration and capacity, yet still demands indoor nodes in premium properties. Because 80% of mobile traffic originates indoors, distributed antenna systems market carriers see rapid payback when high-density users congregate in stadiums, hospitals, and transport hubs.
Regulatory Mandates for In-Building Public-Safety Coverage
FCC Docket 21-346 requires 99% indoor LTE coverage for commercial buildings by 2025, driving compulsory DAS adoption. FirstNet's USD 1.7 billion rural grant program placed systems in 30,000 buildings, giving owners an incentive to meet Enhanced 911 accuracy rules. European transport-corridor coverage directives and Singapore's fire-code updates create similar pressure. Large medical campuses such as Cleveland Clinic integrated FirstNet and commercial 5G in a single network, assuring both public-safety and clinical uptime. Compliance has reduced DAS deployment cycles from discretionary to mandated timelines, shortening decision windows for property developers.
Multi-Operator Coordination and Spectrum-Clearance Complexity
Serving three or more carriers inside one venue forces detailed negotiation of frequencies and power masks, extending projects by 6-18 months. At the Superdome, aligning 91 zones for AT&T, Verizon, and T-Mobile took 14 months before commercial service began. Passive inter-modulation can degrade signal by 10-15 dB if filtering is inadequate, so integrators spend extra on testing. Many emerging-market regulators still license spectrum per operator rather than venue, limiting the neutrality benefits in the distributed antenna systems market.
Other drivers and restraints analyzed in the detailed report include:
- Neutral-Host Business Models Lowering Property-Owner CAPEX
- AI-Driven DAS Self-Optimization Lowers Network OPEX
- High Installation and Deployment Costs for Large Venues
For complete list of drivers and restraints, kindly check the Table Of Contents.
Segment Analysis
Hybrid platforms are carving space between high-powered active units and coaxial passive layouts in the distributed antenna systems market. Hybrid DAS recorded a 6.10% CAGR and is expected to keep eating into active systems that still represent the largest slice of the distributed antenna systems market size. Active units, while capable of multi-band power output, consume 5-15 kW per site and occupy 65% more rack space than passive variants, forcing venue owners to upgrade cooling and power circuits. Passive solutions remain viable in buildings under 100,000 square-feet but lose 3-6 dB every 100 feet of coax. Digital fiber variants convert RF to light, cutting energy 60-70% and easing software upgrades, as evidenced by LampSite roll-outs across 20 countries.
Hybrid systems integrate fiber backhaul with localized amplification, which brings a compromise between capital and power budgets. Verizon's Open RAN deployment in Austin links Samsung software units with CommScope antennas to avoid vendor lock-in. Operators favor hybrids because energy now represents 20-30% of OPEX, and software control lets them turn off sectors overnight. Suppliers offering modular radio heads and remote software keys gain pricing power as venues stagger investments over several budget cycles.
Telecommunications operators still dominated demand with 28.60% revenue in 2025, but hospitals are the fastest risers, expanding at a 7.80% CAGR as electronic health-record access, imaging transfer, and real-time monitoring require zero service interruptions in the distributed antenna systems market. Mayo Clinic in Rochester runs more than 70,000 medical devices on a Corning DAS, showing the operational stakes. Manufacturing floors are leaning toward CBRS small cells for robotics due to lower USD 0.97-1.12 per-square-foot cost, curbing DAS penetration.
Government and public-safety agencies rely on Band 14 integration, a use case that keeps distributed antenna systems market share sticky despite small-cell competition. Sports venues such as Empower Field exploit DAS capacity to enable mobile ordering and augmented-reality replays, driving ancillary revenue. Transportation hubs adopt neutral-host networks to avoid multiple rebuilds, as seen at Hartsfield-Jackson Airport.
Complete Report Scope:
- By Antenna Type
- Active
- Passive
- Digital
- Hybrid
- By End-User
- Manufacturing
- Healthcare
- Government and Public Safety
- Transportation and Logistics
- Sports and Entertainment Venues
- Telecommunications Operators
- Other Commercial Sectors
- By Application
- Enterprise DAS
- Public Safety DAS
- Neutral-Host / Multi-Operator DAS
- By Ownership Model
- Carrier-Owned
- Neutral-Host
- Enterprise-Owned
- By Geography
- North America
- United States
- Canada
- Mexico
- Europe
- United Kingdom
- Germany
- Netherlands
- France
- Ireland
- Rest of Europe
- Asia-Pacific
- China
- India
- Singapore
- Japan
- Australia
- Indonesia
- Rest of Asia-Pacific
- South America
- Brazil
- Chile
- Rest of South America
- Middle East
- United Arab Emirates
- Saudi Arabia
- Turkey
- Rest of Middle East
- Africa
- South Africa
- Nigeria
- Rest of Africa
- North America
Geography Analysis
North America held 38.50% of 2025 revenue in the distributed antenna systems market, propelled by the FCC's 99% indoor mandate and FirstNet's 30,000-building footprint. High-traffic venues such as Empower Field moved 50 terabytes in two days, justifying USD 4-8 per-square-foot investments. The region favors premium neutral-host pricing yet faces 3-7 year paybacks in mid-tier properties, so operators focus on stadiums, airports, and healthcare.
Asia-Pacific is the near-term growth engine at 7.43% CAGR, underpinned by China's 3.64 million 5G sites, India's 700,000-site target, and Singapore's nationwide indoor targets. Large metro projects in Hong Kong and Shenzhen installed full-line coverage within ten weeks, illustrating execution speed. Japan's dense yet aging buildings complicate retrofits, pushing suppliers toward slimline antennas. South Korea and Australia, past the coverage milestone, now emphasize venue upgrades.
Europe's energy-efficiency rules spur digital solutions that cut consumption 60-70%. Fragmented building codes, however, add 3-12 months to permitting, slowing multi-country roll-outs. The United Kingdom's Project Gigabit and transport-corridor obligations keep public-funded programs active, yet historic edifices require specialized fire-proof cabling. The Middle East and Africa is expected to grow rapidly through 2031 on the back of smart-city programs in Riyadh, Dubai, and Doha. du's first 5G-Advanced indoor network hit 5.1 Gbps, signaling appetite for cutting-edge performance. Spectrum-sharing pilots in Saudi Arabia point to regulatory openness that could sidestep coordination delays common elsewhere. Latin America and Sub-Saharan Africa remain nascent, with DAS limited to premium malls and airports, but urbanization and smartphone-penetration trends suggest a latent pipeline once financing hurdles ease.
- CommScope Holding Company Inc.
- Corning Incorporated
- AT&T Inc.
- American Tower Corporation
- Cobham Limited
- SOLiD Inc.
- TE Connectivity Ltd.
- Comba Telecom Systems Holdings Ltd.
- Boingo Wireless Inc.
- JMA Wireless
- Dali Wireless Inc.
- Zinwave (Wilson Electronics)
- Nokia Corporation
- Ericsson AB
- Huawei Technologies Co. Ltd.
- Radio Frequency Systems
- Advanced RF Technologies Inc.
- PBE Axell Wireless
- Maven Wireless Sweden AB
- Baicells Technologies Co. Ltd.
- Tower Bersama Group
- Anixter International Inc.
- Amphenol Corporation
- Antenna Products Corporation
Additional Benefits:
- The market estimate (ME) sheet in Excel format
- 3 months of analyst support
TABLE OF CONTENTS
1 INTRODUCTION
- 1.1 Study Assumptions and Market Definition
- 1.2 Scope of the Study
2 RESEARCH METHODOLOGY
3 EXECUTIVE SUMMARY
4 MARKET LANDSCAPE
- 4.1 Market Overview
- 4.2 Market Drivers
- 4.2.1 5G Network Densification Boosting Indoor-Coverage Demand
- 4.2.2 Regulatory Mandates for In-Building Public-Safety Coverage
- 4.2.3 Neutral-Host Business Models Lowering Property-Owner CAPEX
- 4.2.4 AI-Driven DAS Self-Optimisation Lowers Network OPEX
- 4.2.5 Rising Mobile Data Traffic in Large Venues
- 4.2.6 Proliferation of IoT and Smart-Building Applications
- 4.3 Market Restraints
- 4.3.1 Multi-Operator Coordination and Spectrum-Clearance Complexity
- 4.3.2 Sustainability Pressure on Energy-Intensive Systems
- 4.3.3 High Installation and Deployment Costs for Large Venues
- 4.3.4 Complex Regulatory Approvals and Building-Zoning Permits
- 4.4 Industry Value Chain Analysis
- 4.5 Regulatory Landscape
- 4.6 Technological Outlook
- 4.7 Impact of Macroeconomic Factors
- 4.8 Porter's Five Forces Analysis
- 4.8.1 Threat of New Entrants
- 4.8.2 Bargaining Power of Suppliers
- 4.8.3 Bargaining Power of Buyers
- 4.8.4 Threat of Substitutes
- 4.8.5 Competitive Rivalry
5 MARKET SIZE AND GROWTH FORECASTS (VALUE)
- 5.1 By Antenna Type
- 5.1.1 Active
- 5.1.2 Passive
- 5.1.3 Digital
- 5.1.4 Hybrid
- 5.2 By End-User
- 5.2.1 Manufacturing
- 5.2.2 Healthcare
- 5.2.3 Government and Public Safety
- 5.2.4 Transportation and Logistics
- 5.2.5 Sports and Entertainment Venues
- 5.2.6 Telecommunications Operators
- 5.2.7 Other Commercial Sectors
- 5.3 By Application
- 5.3.1 Enterprise DAS
- 5.3.2 Public Safety DAS
- 5.3.3 Neutral-Host / Multi-Operator DAS
- 5.4 By Ownership Model
- 5.4.1 Carrier-Owned
- 5.4.2 Neutral-Host
- 5.4.3 Enterprise-Owned
- 5.5 By Geography
- 5.5.1 North America
- 5.5.1.1 United States
- 5.5.1.2 Canada
- 5.5.1.3 Mexico
- 5.5.2 Europe
- 5.5.2.1 United Kingdom
- 5.5.2.2 Germany
- 5.5.2.3 Netherlands
- 5.5.2.4 France
- 5.5.2.5 Ireland
- 5.5.2.6 Rest of Europe
- 5.5.3 Asia-Pacific
- 5.5.3.1 China
- 5.5.3.2 India
- 5.5.3.3 Singapore
- 5.5.3.4 Japan
- 5.5.3.5 Australia
- 5.5.3.6 Indonesia
- 5.5.3.7 Rest of Asia-Pacific
- 5.5.4 South America
- 5.5.4.1 Brazil
- 5.5.4.2 Chile
- 5.5.4.3 Rest of South America
- 5.5.5 Middle East
- 5.5.5.1 United Arab Emirates
- 5.5.5.2 Saudi Arabia
- 5.5.5.3 Turkey
- 5.5.5.4 Rest of Middle East
- 5.5.6 Africa
- 5.5.6.1 South Africa
- 5.5.6.2 Nigeria
- 5.5.6.3 Rest of Africa
- 5.5.1 North America
6 COMPETITIVE LANDSCAPE
- 6.1 Market Concentration
- 6.2 Strategic Moves
- 6.3 Market Share Analysis
- 6.4 Company Profiles (includes Global level Overview, Market level overview, Core Segments, Financials as available, Strategic Information, Market Rank/Share for key companies, Products and Services, and Recent Developments)
- 6.4.1 CommScope Holding Company Inc.
- 6.4.2 Corning Incorporated
- 6.4.3 AT&T Inc.
- 6.4.4 American Tower Corporation
- 6.4.5 Cobham Limited
- 6.4.6 SOLiD Inc.
- 6.4.7 TE Connectivity Ltd.
- 6.4.8 Comba Telecom Systems Holdings Ltd.
- 6.4.9 Boingo Wireless Inc.
- 6.4.10 JMA Wireless
- 6.4.11 Dali Wireless Inc.
- 6.4.12 Zinwave (Wilson Electronics)
- 6.4.13 Nokia Corporation
- 6.4.14 Ericsson AB
- 6.4.15 Huawei Technologies Co. Ltd.
- 6.4.16 Radio Frequency Systems
- 6.4.17 Advanced RF Technologies Inc.
- 6.4.18 PBE Axell Wireless
- 6.4.19 Maven Wireless Sweden AB
- 6.4.20 Baicells Technologies Co. Ltd.
- 6.4.21 Tower Bersama Group
- 6.4.22 Anixter International Inc.
- 6.4.23 Amphenol Corporation
- 6.4.24 Antenna Products Corporation
7 MARKET OPPORTUNITIES AND FUTURE OUTLOOK
- 7.1 White-Space and Unmet-Need Assessment

 分散式天線系統市場:按組件、系統類型、部署類型、所有權模式、訊號源、安裝類型、最終用戶和分銷管道分類-2026-2032年全球市場預測
 分散式天線系統 (DAS) 市場規模、佔有率和成長分析:按產品、覆蓋範圍、DAS 類型、所有權模式、技術、應用、最終用戶和地區分類—2026-2033 年產業預測
 分散式天線系統 (DAS) 市場預測至 2034 年—按產品、覆蓋範圍、所有權模式、訊號源、最終用戶和地區分類的全球分析
 分散式天線系統 (DAS) 市場規模、佔有率和成長分析:按組件、技術、所有權模式、覆蓋類型、最終用戶產業、銷售管道和地區分類-2026-2033 年產業預測室內分散式天線系統市場:按組件、系統類型、技術、頻段、應用和最終用戶分類-2026-2032年全球市場預測
 2026年全球分散式天線系統(DAS)市場報告
 分散式天線系統市場報告:按產品、系統類型、覆蓋範圍、技術、最終用途和地區分類(2026-2034 年)室內分散式基地台市場:依產品類型、技術、頻段、組件、安裝類型和最終用戶分類,全球預測,2026-2032年
 分散式天線系統 (DAS) 市場分析及預測(至 2035 年):按類型、產品類型、服務、技術、組件、應用、部署類型、最終用戶、安裝類型和解決方案分類
 分散式天線系統市場:機會、成長要素、產業趨勢分析及2026年至2035年預測