


 |
市場調查報告書
商品編碼
2122398
超級電腦:市場佔有率分析、行業趨勢和統計數據、成長預測(2026-2031 年)Supercomputers - Market Share Analysis, Industry Trends & Statistics, Growth Forecasts (2026 - 2031) |
||||||

※ 本網頁內容可能與最新版本有所差異。詳細情況請與我們聯繫。
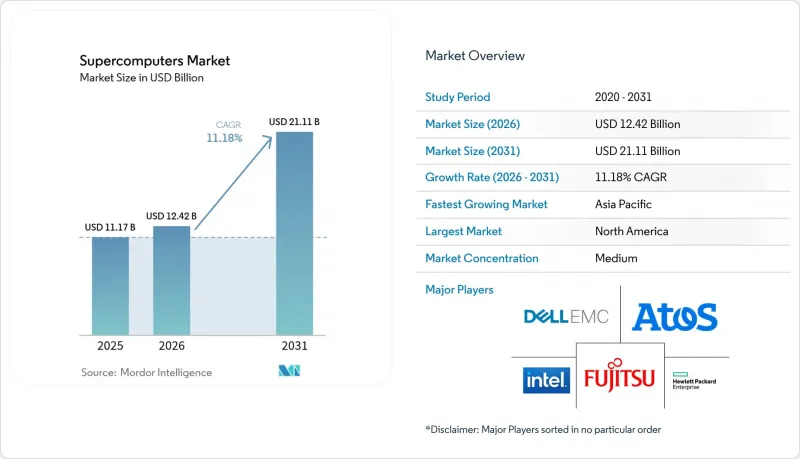
根據 Mordor Intelligence 估計,到 2026 年,超級電腦市值將達到 124.2 億美元,高於 2025 年的 111.7 億美元,預計到 2031 年將達到 211.1 億美元。
預計 2026 年至 2031 年的複合年成長率為 11.18%。
本報告按組件(處理器 (CPU)、加速器(GPU/ASIC 等)、系統類型(集群、大規模並行處理 (MPP) 等)、部署方式(本地部署、雲端部署等)、處理規模(百億億次級、準百萬兆級、百萬兆級)、最終用戶(政府/國防、學術/研究等)和地區進行細分市場預測市場為新單位。
全球超級電腦市場趨勢與洞察
公共資金在百萬兆級競賽中激增
美國、歐洲、中國和日本的大型專案正在資助下一代系統,其性能將比目前的百億億次級電腦高出十倍以上。美國能源局的「發現」(Discovery)系統旨在實現「前沿」(Frontier)系統3到5倍的吞吐量,而歐洲的「歐洲高效能運算聯合計畫」(EuroHPC Joint Undertaking)則正在資助支援區域科研自主的分散式百萬兆級網路。能夠提供硬體、軟體和專業服務打包服務的供應商正在獲得長期契約,並確保在初始部署之後仍有收入來源。隨著大學對最先進電腦的需求不斷成長,學術機構之間的競標日益激烈,由此引發了第二波需求浪潮,中小型供應商也參與到國家級計畫中。
高效能運算系統中人工智慧/機器學習工作負載的激增
人工智慧推理和訓練正滲透到傳統的高效能運算中心,迫使架構師整合高頻寬記憶體和異質運算子系統。 NVIDIA 的 H100 和 AMD 的 MI300X 加速器已成為新採購的標準配置,這反映出人工智慧層正在推動峰值浮點運算效能 (FLOPS) 的需求。金融機構正在部署超低延遲叢集進行風險分析,生命科學公司則利用多節點 GPU 機架建置藥物研發流程。這種轉變正在重塑軟體生態系統,編譯器、調度器和函式庫必須針對張量核心和稀疏矩陣感知計算進行最佳化。提供承包人工智慧高效能運算解決方案的系統整合商正不斷獲得高利潤的服務合約。
資料中心電力和冷卻成本正在飆升。
百萬兆級電腦通常消耗 20-40 兆瓦的電力,遠遠超過五年前的預算。隨著風冷技術的限制日益凸顯,液冷和浸沒式冷卻正從測試階段走向主流應用。在系統生命週期內,能源成本往往超過硬體折舊,迫使營運商簽訂長期購電協議。供應商正利用「每瓦性能」指標來區分自身產品,並加速晶片組和光連接模組的研發,以降低熱負荷。綠色資料中心的政策獎勵正在影響位置,促使新建設向可再生能源充裕的地區轉移。
細分市場分析
預計到2025年,加速器將佔超級電腦市場14.5億美元的佔有率,並在2031年之前保持15.05%的複合年成長率。 GPU和客製化ASIC晶片除了處理傳統的浮點運算外,現在還承擔著人工智慧推理的任務,每個機架的平均發熱量也從40千瓦增加到80千瓦。記憶體供應商正努力滿足對HBM3E的需求,這為2025年的許多建設項目帶來了限制。儲存正在向NVMe over Fabrics過渡,從而消除資料密集型工作負載中的I/O瓶頸。
預計到2025年,處理器仍將佔據超級電腦市場38.67%的佔有率,但隨著客戶將更多預算分配給加速器,處理器的單價成長正在放緩。供應商正轉向基於晶片組的設計,以實現與連貫的無縫連接,這需要統一的記憶體語義。軟體和服務仍然是利潤最高的領域,最佳化合約的期限甚至超過了硬體的生命週期。互連收入隨著節點數量的增加而成長,800 Gbps乙太網路通道和400 Gbps InfiniBand構成了下一代拓撲結構的骨幹。
預計到2025年,基於叢集的架構將佔據超級電腦市場44.4億美元的佔有率,維持39.74%的市場佔有率,這主要得益於標準化促進了採購。另一方面,異構系統預計將以15.56%的複合年成長率成長,透過在單一調度器下整合CPU、GPU和專用加速器,靈活地處理人工智慧和模擬工作負載。大規模並行處理在需要極大量節點的領域仍然至關重要,例如網格量子計算和天氣建模。
諸如 SYCL 和 OpenMP 卸載指令之類的軟體框架正在簡化跨不同晶片的開發流程,並提高資源利用率。提供結合高密度 GPU 和 CPU 密集型頭節點的產品的供應商,正在利用研究機構對雙用途叢集的需求。雖然向量系統仍然是一個小眾領域,但它們在基因組比對和即時風險計算等任務中變得越來越重要。
區域分析
2025年,北美地區貢獻了41.08%的收入。這主要得益於美國持續投資數十億美元的百億億百萬兆級項目,包括與El Capitan系統同屬一個系列的Discovery項目。加拿大推出的雲端運算研究津貼擴大了大學附屬新創企業的准入範圍。超大規模資料中心供應商升級了區域可用區,增加了人工智慧密集執行個體類型,加劇了系統整合商在託管服務合約方面的競爭。
亞太地區以12.55%的複合年成長率成長,受益於中國自主研發的百億億次級運算部署以及日本的「富嶽NEXT」藍圖——該路線圖的目標是到2030年將運算效能提升至目前的5到10倍。印度正在擴大其數位公共基礎設施建設項目,並將資金投入基因組學和氣候變遷等需要本地運算自主權的應用領域。澳洲和新加坡正在聯合資金籌措一個區域性的地球系統中心,這將推動對中型叢集的需求。
在歐洲,歐洲高效能運算聯盟(EuroHPC Consortium)的津貼維持著穩定的成長,該聯盟向德國、芬蘭和義大利分配運算能力。主權條款確保購買者選擇開放式架構硬體,並搭配歐盟開發的軟體棧。能源價格的波動正在加速北歐國家的資料中心建設,這些資料中心利用低碳水力發電來託管用於商業和公共研究的節點。在中東,政府正在為沙烏地阿拉伯的HUMAIN等人工智慧工廠提供資金,以實現經濟多元化,擺脫對碳氫化合物的依賴。在南美洲,一項耗資40億美元的巴西舉措正在提升該地區在TOP500名單上的排名,並啟動與全球學術夥伴的合作。
其他好處:
- Excel格式的市場預測(ME)表
- 3個月的分析師支持
目錄
第1章:引言
- 市場分析與定義的前提條件
- 分析範圍
第2章 分析方法
第3章執行摘要
第4章 市場狀況
- 市場概覽
- 市場促進因素
- 「百億百萬兆級競賽」推動了公共資金的激增
- 高效能運算系統中人工智慧/機器學習工作負載的激增
- 後新冠疫情時代對氣候和生物醫學模擬的需求
- 雲端「高效能運算即服務」的日益普及
- 開放原始碼運算軟體堆疊的成熟度
- 各國數位主權計劃
- 市場限制因素
- 資料中心電力和冷卻成本正在飆升。
- 具備平行程式設計技能的人員短缺問題依然存在。
- 先進節點晶片供應鏈中的漏洞
- 公共部門採購週期過長(小眾領域)
- 產業價值鏈與供應鏈分析
- 監理情勢
- 技術展望
- 波特五力分析
第5章:預測市場規模與成長率
- 按組件
- 處理器(CPU)
- 加速器(GPU/ASIC)
- 記憶
- 貯存
- 互連
- 軟體服務
- 依系統類型
- 集群類型
- 大規模並行處理(MPP)
- 加速/異質
- 向量
- 透過部署方法
- 現場
- 雲端運算(高效能運算即服務)
- 混合
- 透過處理規模
- 拍級
- 百萬兆級
- 百萬兆級
- 最終用戶
- 政府/國防
- 學術研究機構
- 金融服務
- 醫學與生命科學
- 製造業和工業
- 能源公用事業
- 按地區
- 北美洲
- 美國
- 加拿大
- 墨西哥
- 歐洲
- 德國
- 英國
- 法國
- 俄羅斯
- 其他歐洲國家
- 亞太地區
- 中國
- 日本
- 印度
- 韓國
- 澳洲
- 其他亞太國家
- 中東和非洲
- 中東
- 沙烏地阿拉伯
- 阿拉伯聯合大公國
- 其他中東國家
- 非洲
- 南非
- 埃及
- 其他非洲國家
- 中東
- 南美洲
- 巴西
- 阿根廷
- 其他南美國家
- 北美洲
第6章 競爭情勢
- 市場集中度
- 策略趨勢
- 市佔率分析
- 公司簡介
- Hewlett Packard Enterprise Company
- Lenovo Group Limited
- Dell Technologies Inc.
- Fujitsu Limited
- Atos SE
- International Business Machines Corporation
- NEC Corporation
- Intel Corporation
- Advanced Micro Devices, Inc.
- NVIDIA Corporation
- Sugon Information Industry Co., Ltd.
- Inspur Group Co., Ltd.
- Super Micro Computer, Inc.
- Penguin Computing, Inc.
- Huawei Technologies Co., Ltd.
- DataDirect Networks, Inc.
- Mellanox Technologies Ltd.(NVIDIA)
- Arm Ltd.
- Cray Inc.(HPE brand)
- E4 Computer Engineering SpA
- H3C Technologies Co., Ltd.
第7章 市場機會與未來展望
According to Mordor Intelligence, the supercomputer market size in 2026 is estimated at USD 12.42 billion, growing from 2025 value of USD 11.17 billion with 2031 projections showing USD 21.11 billion, growing at 11.18% CAGR over 2026-2031.
This report is Segmented by Component (Processor (CPU), Accelerators (GPU/ASIC), and More), System Type (Cluster-Based, Massively Parallel Processing (MPP), and More), Deployment Mode (On-Premises, Cloud-Based and More), Processing Scale (Petascale, Pre-Exascale, Exascale), End-User (Government and Defense, Academic and Research and More), and Geography. The Market Forecasts are Provided in Terms of Value (USD).
Global Supercomputers Market Trends and Insights
Race-to-Exascale Public Funding Surge
Large-scale programs in the United States, Europe, China, and Japan fund next-generation systems that outpace today's petascale machines by factors of 10 or more. The U.S. Department of Energy's Discovery system targets 3-5 times Frontier's throughput, while Europe's EuroHPC Joint Undertaking funds a distributed exascale network that underpins regional research autonomy. Vendors able to bundle hardware, software, and professional services capture longer contracts, assuring revenue visibility beyond initial installations. Academic bidding has intensified as universities seek leadership-class machines, creating a second tier of demand that sweeps smaller suppliers into national programs.
Proliferation of AI/ML Workloads on HPC Systems
AI inference and training now permeate traditional HPC centers, compelling architects to integrate high-bandwidth memory and heterogeneous compute subsystems. NVIDIA's H100 and AMD's MI300X accelerators have become standard line-items in new procurements, reflecting how AI layers drive peak-flops requirements. Financial institutions deploy ultra-low-latency clusters for risk analytics, while life-science firms exploit multi-node GPU racks for drug-discovery pipelines. The shift reshapes software ecosystems; compilers, schedulers, and libraries must optimize for tensor cores and sparsity-aware operations. System integrators that deliver turnkey AI-HPC solutions consistently win higher-margin service deals.
Ballooning Datacenter Power and Cooling Costs
Exascale machines regularly draw 20-40 MW, dwarfing budgets allocated only five years ago. Liquid and immersion cooling migrate from pilot to mainstream as air-cooling plateaus. Energy frequently surpasses amortized hardware costs over system lifetimes, forcing operators to negotiate long-term power-purchase contracts. Vendors differentiate on performance per watt metrics, spurring R&D into chiplets and optical interconnects that curb thermal footprints. Policy incentives for green datacenters influence site-selection, pushing new builds toward regions with renewable-energy surpluses.
Other drivers and restraints analyzed in the detailed report include:
- Demand for Climate and Biomedical Simulations Post-COVID
- Rising Availability of Cloud-based "HPC-as-a-Service"
- Advanced-Node Chip Supply-Chain Fragility
For complete list of drivers and restraints, kindly check the Table Of Contents.
Segment Analysis
Accelerators commanded USD 1.45 billion of the supercomputer market size in 2025, upholding 15.05% CAGR projections through 2031. GPUs and custom ASICs shoulder AI inferencing alongside traditional floating-point simulations, lifting average rack-level heat from 40 kW to 80 kW. Memory vendors struggle to meet HBM3E demand, constraining many 2025 builds. Storage transitions to NVMe over Fabrics, shrinking I/O bottlenecks in data-rich workloads.
Processors retained 38.67% supercomputer market share in 2025, yet face slowing unit revenues as customers allocate larger budgets to accelerators. Vendors pivot to chiplet-based designs that attach coherently to GPUs, calling for unified memory semantics. Software and Services remains the highest-margin slice, where optimization contracts outlive hardware cycles. Interconnect revenue grows in lockstep with node counts, with 800 Gbps Ethernet lanes and 400 Gbps InfiniBand forming the backbone of next-generation topologies.
Cluster-based architectures represented USD 4.44 billion of the supercomputer market size in 2025, sustaining their 39.74% share as standardization eases procurement. Meanwhile, heterogeneous systems post 15.56% CAGR, bundling CPUs, GPUs, and purpose-built accelerators under a single scheduler to flex across AI and simulation workloads. Massively parallel processing remains essential for lattice-QCD and weather models that crave extreme node counts.
Software frameworks such as SYCL and OpenMP offload directives pave smoother development paths across diverse chips, raising utilization rates. Vendors that package high-density GPUs with CPU-rich head nodes ride demand from research facilities seeking dual-purpose clusters. Vector systems, though niche, find renewed relevance in genomic alignment and real-time risk-calculation tasks.
Complete Report Scope:
- By Component
- Processor (CPU)
- Accelerators (GPU/ASIC)
- Memory
- Storage
- Interconnect
- Software and Services
- By System Type
- Cluster-Based
- Massively Parallel Processing (MPP)
- Accelerated / Heterogeneous
- Vector
- By Deployment Mode
- On-Premises
- Cloud-based (HPC-aaS)
- Hybrid
- By Processing Scale
- Petascale
- Pre-Exascale
- Exascale
- By End-user
- Government and Defense
- Academic and Research Institutes
- Financial Services
- Healthcare and Life Sciences
- Manufacturing and Industrial
- Energy and Utilities
- By Geography
- North America
- United States
- Canada
- Mexico
- Europe
- Germany
- United Kingdom
- France
- Russia
- Rest of Europe
- Asia-Pacific
- China
- Japan
- India
- South Korea
- Australia
- Rest of Asia-Pacific
- Middle East and Africa
- Middle East
- Saudi Arabia
- United Arab Emirates
- Rest of Middle East
- Africa
- South Africa
- Egypt
- Rest of Africa
- Middle East
- South America
- Brazil
- Argentina
- Rest of South America
- North America
Geography Analysis
North America commanded 41.08% of 2025 revenue as the United States continued to bankroll multi-billion-dollar exascale projects, including the Discovery companion to El Capitan. Canada's adoption of cloud-based research grants broadened access for university-affiliated startups. Hyper-scale providers upgraded regional availability zones with AI-intensive instance types, heightening competition among system integrators for managed-services contracts.
Asia-Pacific, advancing at 12.55% CAGR, benefits from China's domestically sourced petascale rollouts and Japan's Fugaku NEXT roadmap targeting 5-10 times current performance by 2030. India expands digital public-infrastructure missions, earmarking funds for genomics and climate applications that require localized compute-sovereignty. Australia and Singapore co-finance regional Earth-systems hubs, bolstering demand for mid-range clusters.
Europe maintains steady growth through EuroHPC Joint Undertaking grants that distribute capacity across Germany, Finland, and Italy. Sovereignty clauses push buyers toward open-architecture hardware combined with EU-developed software stacks. Energy-price volatility spurs Nordic data-center builds, leveraging low-carbon hydroelectricity to host dual-purpose commercial and public-research nodes. The Middle East funds AI factories, such as Saudi Arabia's HUMAIN, to diversify economies beyond hydrocarbons. South America's USD 4 billion Brazilian initiative elevates regional rank on TOP500 lists and opens collaboration with academic partners worldwide.
- Hewlett Packard Enterprise Company
- Lenovo Group Limited
- Dell Technologies Inc.
- Fujitsu Limited
- Atos SE
- International Business Machines Corporation
- NEC Corporation
- Intel Corporation
- Advanced Micro Devices, Inc.
- NVIDIA Corporation
- Sugon Information Industry Co., Ltd.
- Inspur Group Co., Ltd.
- Super Micro Computer, Inc.
- Penguin Computing, Inc.
- Huawei Technologies Co., Ltd.
- DataDirect Networks, Inc.
- Mellanox Technologies Ltd. (NVIDIA)
- Arm Ltd.
- Cray Inc. (HPE brand)
- E4 Computer Engineering S.p.A.
- H3C Technologies Co., Ltd.
Additional Benefits:
- The market estimate (ME) sheet in Excel format
- 3 months of analyst support
TABLE OF CONTENTS
1 INTRODUCTION
- 1.1 Study Assumptions and Market Definition
- 1.2 Scope of the Study
2 RESEARCH METHODOLOGY
3 EXECUTIVE SUMMARY
4 MARKET LANDSCAPE
- 4.1 Market Overview
- 4.2 Market Drivers
- 4.2.1 Race-to-Exascale public funding surge
- 4.2.2 Proliferation of AI/ML workloads on HPC systems
- 4.2.3 Demand for climate and biomedical simulations post-COVID
- 4.2.4 Rising availability of cloud-based "HPC-as-a-Service"
- 4.2.5 Open-source HPC software stack maturity
- 4.2.6 National digital-sovereignty programs (under-the-radar)
- 4.3 Market Restraints
- 4.3.1 Ballooning datacenter power and cooling costs
- 4.3.2 Persistent talent gap in parallel-programming skills
- 4.3.3 Advanced-node chip supply-chain fragility
- 4.3.4 Lengthy public-sector procurement cycles (niche)
- 4.4 Industry Value / Supply-Chain Analysis
- 4.5 Regulatory Landscape
- 4.6 Technological Outlook
- 4.7 Porter's Five Forces Analysis
- 4.7.1 Bargaining Power of Suppliers
- 4.7.2 Bargaining Power of Consumers
- 4.7.3 Threat of New Entrants
- 4.7.4 Threat of Substitutes
- 4.7.5 Intensity of Competitive Rivalry
- 4.7.6 Assessment of Macroeconomic Impact
5 MARKET SIZE AND GROWTH FORECASTS (VALUE)
- 5.1 By Component
- 5.1.1 Processor (CPU)
- 5.1.2 Accelerators (GPU/ASIC)
- 5.1.3 Memory
- 5.1.4 Storage
- 5.1.5 Interconnect
- 5.1.6 Software and Services
- 5.2 By System Type
- 5.2.1 Cluster-Based
- 5.2.2 Massively Parallel Processing (MPP)
- 5.2.3 Accelerated / Heterogeneous
- 5.2.4 Vector
- 5.3 By Deployment Mode
- 5.3.1 On-Premises
- 5.3.2 Cloud-based (HPC-aaS)
- 5.3.3 Hybrid
- 5.4 By Processing Scale
- 5.4.1 Petascale
- 5.4.2 Pre-Exascale
- 5.4.3 Exascale
- 5.5 By End-user
- 5.5.1 Government and Defense
- 5.5.2 Academic and Research Institutes
- 5.5.3 Financial Services
- 5.5.4 Healthcare and Life Sciences
- 5.5.5 Manufacturing and Industrial
- 5.5.6 Energy and Utilities
- 5.6 By Geography
- 5.6.1 North America
- 5.6.1.1 United States
- 5.6.1.2 Canada
- 5.6.1.3 Mexico
- 5.6.2 Europe
- 5.6.2.1 Germany
- 5.6.2.2 United Kingdom
- 5.6.2.3 France
- 5.6.2.4 Russia
- 5.6.2.5 Rest of Europe
- 5.6.3 Asia-Pacific
- 5.6.3.1 China
- 5.6.3.2 Japan
- 5.6.3.3 India
- 5.6.3.4 South Korea
- 5.6.3.5 Australia
- 5.6.3.6 Rest of Asia-Pacific
- 5.6.4 Middle East and Africa
- 5.6.4.1 Middle East
- 5.6.4.1.1 Saudi Arabia
- 5.6.4.1.2 United Arab Emirates
- 5.6.4.1.3 Rest of Middle East
- 5.6.4.2 Africa
- 5.6.4.2.1 South Africa
- 5.6.4.2.2 Egypt
- 5.6.4.2.3 Rest of Africa
- 5.6.4.1 Middle East
- 5.6.5 South America
- 5.6.5.1 Brazil
- 5.6.5.2 Argentina
- 5.6.5.3 Rest of South America
- 5.6.1 North America
6 COMPETITIVE LANDSCAPE
- 6.1 Market Concentration
- 6.2 Strategic Moves
- 6.3 Market Share Analysis
- 6.4 Company Profiles (includes Global level Overview, Market level overview, Core Segments, Financials as available, Strategic Information, Market Rank/Share for key companies, Products and Services, and Recent Developments)
- 6.4.1 Hewlett Packard Enterprise Company
- 6.4.2 Lenovo Group Limited
- 6.4.3 Dell Technologies Inc.
- 6.4.4 Fujitsu Limited
- 6.4.5 Atos SE
- 6.4.6 International Business Machines Corporation
- 6.4.7 NEC Corporation
- 6.4.8 Intel Corporation
- 6.4.9 Advanced Micro Devices, Inc.
- 6.4.10 NVIDIA Corporation
- 6.4.11 Sugon Information Industry Co., Ltd.
- 6.4.12 Inspur Group Co., Ltd.
- 6.4.13 Super Micro Computer, Inc.
- 6.4.14 Penguin Computing, Inc.
- 6.4.15 Huawei Technologies Co., Ltd.
- 6.4.16 DataDirect Networks, Inc.
- 6.4.17 Mellanox Technologies Ltd. (NVIDIA)
- 6.4.18 Arm Ltd.
- 6.4.19 Cray Inc. (HPE brand)
- 6.4.20 E4 Computer Engineering S.p.A.
- 6.4.21 H3C Technologies Co., Ltd.
7 MARKET OPPORTUNITIES AND FUTURE OUTLOOK
- 7.1 White-space and Unmet-need Assessment

 超級電腦市場-2026-2032年全球市場預測
 人工智慧超級運算平台市場規模、佔有率和趨勢分析報告:按交付方式、應用、部署方式、組件、最終用途、地區和細分市場分類(2026-2033 年)
 人工智慧超級運算平台市場(2026-2032 年):按技術、解決方案、產業和用例分類
 超級電腦市場:按最終用戶產業和地區分類
 2034 年雲端運算人工智慧市場預測:按組件、部署模式、服務模式、應用程式、最終用戶和區域分類的全球分析邊緣超級運算市場預測至2034年-按組件、架構、處理類型、部署模式、組織規模、最終用戶和地區分類的全球分析
 2026年全球超級電腦市場報告人工智慧超級電腦市場:按組件、部署、應用和最終用戶分類——2026-2032年全球市場預測
 2026-2030年全球超級電腦市場
 超級運算市場分析及預測(至2035年):依類型、產品類型、服務、技術、元件、應用、最終使用者、部署類型及解決方案分類