


 |
市場調查報告書
商品編碼
2122328
情境感知計算:市場佔有率分析、產業趨勢與統計數據以及成長預測(2026-2031 年)Context Aware Computing - Market Share Analysis, Industry Trends & Statistics, Growth Forecasts (2026 - 2031) |
||||||

※ 本網頁內容可能與最新版本有所差異。詳細情況請與我們聯繫。
根據 Mordor Intelligence 預測,情境感知計算市場規模將從 2025 年的 709.4 億美元成長到 2026 年的 789.4 億美元,然後在 2031 年達到 1346.2 億美元,2026 年至 2031 年的複合年成長率為 11.30%。
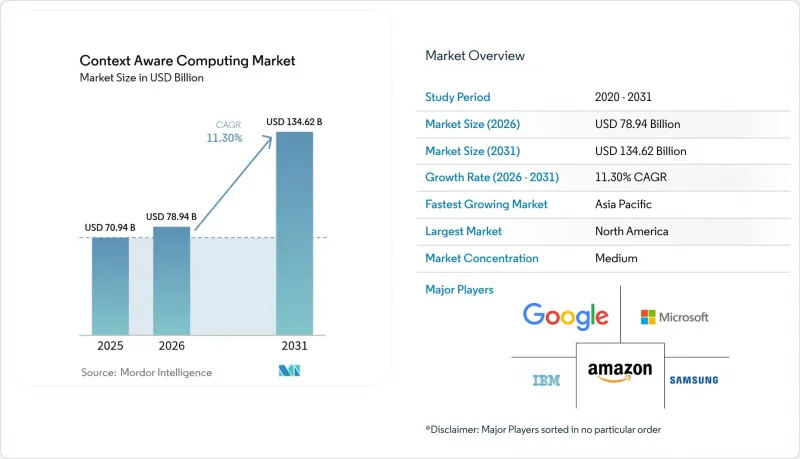
本報告按類型(硬體、軟體)、供應商(設備製造商、行動網路營運商、其他)、最終用戶產業(銀行、金融服務和保險、消費性電子、其他)以及地區(北美、歐洲、亞太、其他)進行細分。市場規模和預測均以美元計價。
全球情境感知計算市場趨勢與洞察
利用人工智慧驅動的意圖預測來改善使用者體驗
智慧型手機、汽車和零售終端中嵌入的大規模語言模型和機器學習管道如今能夠預測用戶意圖、提案下一步操作並自動完成任務。 Apple Intelligence 分析裝置內的行為、周圍環境和訊息風格,從而精心策劃提示並自動化工作流程。部署類似模型的組織機構因其提供的直覺便捷的用戶體驗而獲得了更高的用戶留存率。隨著每一次互動不斷完善模型並增強網路效應,市場正在迅速擴張。對人工智慧基礎設施的資本投資正在激增,例如 Oracle 和 OpenAI 之間價值 300 億美元的合作,專注於高密度 GPU叢集。隨著預測準確度的提高,消費者越來越期望主動服務成為情境感知市場的基本功能。
邊緣運算成本的下降正在加速其普及應用。
先進的 3nm 和 4nm 製程節點降低了每兆次運算的成本,並提高了每瓦效能。高通最新的驍龍平台整合了一個專用的 NPU,支援在電池供電設備上進行多模態上下文分析,因此無需持續的雲端連接。整體擁有成本的降低正在推動中小企業採用該技術,包括智慧零售貨架、工廠自動化和用於現場服務的穿戴式設備。這一不斷擴大的市場正在加速感測器和閘道器的出貨量,從而提振了上下文感知運算產業的需求。
由於法規優先考慮隱私,資料使用受到限制。
符合 GDPR(一般資料保護規則)的法規要求使用者明確同意、資料最小化以及刪除權,這限制了行動應用中曾經普遍存在的無限資料收集。為了遵守法規,企業目前正在尋求聯邦學習、差分隱私和本地推理等技術,但這些技術往往會降低模型精度或延遲部署。能夠提供「隱私納入設計」框架的供應商可以獲得信譽優勢,但代價是更高的工程成本。監管趨勢導致一些公司保持謹慎,這抑制了情境感知計算市場的短期成長。
細分市場分析
到2025年,硬體將佔總收入的51.40%,這主要得益於感測器、邊緣閘道器和智慧穿戴裝置在推理工作負載方面的優勢。其中,用於感知運動、生物識別和環境的感測器是最大的組件,因為所有情境感知決策都始於準確的資料收集。閘道器透過聚合這些輸入並執行初步分析,縮短了情境感知運算市場的回饋週期。同時,軟體領域的成長預計將超過硬體,到2031年複合年成長率將達到12.67%。情境管理中介軟體整合了異質資料流,而分析引擎則將原始訊號轉換為預測性建議。專業服務收入反映了企業在調整資料管道、安全性和合規性時所面臨的陡峭學習曲線。隨著企業將日常營運外包並專注於業務邏輯,託管服務正日益普及。
如今,軟體已成為終端用戶價值創造的關鍵驅動力。中間件供應商正在整合模式映射、身分解析和實作等功能,使平台選擇成為一項策略決策。人工智慧推理庫透過將工作負載分配到 CPU、GPU 和 NPU 資源上來最佳化功耗。這些技術突破使開發人員能夠建立精細化的體驗,例如自適應汽車資訊娛樂系統,而無需為每個晶片組重寫程式碼。由此產生的需求正在推動上游感測器和閘道器的出貨量,從而擴大整合解決方案中情境感知運算的市場規模。
區域分析
在強勁的風險投資、早期5G部署和雲端運算應用的推動下,預計到2025年,北美將佔全球收入的38.70%。美國企業正在實施情境豐富的客戶旅程,以提高客戶維繫和交叉銷售率。加拿大公共部門的數位化策略也進一步推動了對注重隱私的數位化應用的潛在需求。
亞太地區預計將成為成長最快的地區,到2031年年複合成長率(CAGR)將達到14.25%。全國範圍內的5G部署、設備製造中心地位以及大規模位原生代人口,都在推動情境感知計算市場的擴張。中國25.7億個物聯網終端機表明,參與企業本地生態系統後可取得豐富的情境資料。政府對智慧城市、醫療健康和產業升級計畫的支持,進一步加速了情境感知運算的普及應用。
在歐洲,各地區正根據各自的優先事項推動相關工作,力求在創新與遵守嚴格的隱私法律之間取得平衡。整合用戶同意管理和數據本地化的供應商正在贏得企業合約。在中東,大規模情境感知平台測試和營運正在穩步推進,並受益於沙烏地阿拉伯NEOM等智慧城市大型大型企劃。在非洲,雲端原生行動服務為基礎設施薄弱的傳統地區提供了切實可行的解決方案,因此蘊藏著巨大的成長潛力。在南美洲,智慧型手機的穩定普及滿足了全球需求,電信業者正在推動邊緣運算節點的部署,以支援低延遲、情境感知應用。
其他好處
- Excel格式的市場預測(ME)表
- 3個月的分析師支持
目錄
第1章:引言
- 研究假設和市場定義
- 調查範圍
第2章:調查方法
第3章執行摘要
第4章 市場狀況
- 市場概覽
- 市場促進因素
- 利用人工智慧驅動的意圖預測來改善使用者體驗
- 邊緣運算成本的下降正在加速其普及應用。
- 透過 5G 部署實現即時情境資料擷取
- 物聯網終端數量激增導致資料過載
- 對汽車資訊娛樂系統個人化的需求
- 中小企業的應用程式的 CaaS(上下文即服務)API
- 市場限制因素
- 由於法規優先考慮隱私,資料使用受到限制。
- 與傳統IT系統整合的複雜性
- 情境推論中模型偏差的風險
- 穿戴式裝置的電池續航力短
- 產業價值鏈分析
- 波特五力分析
第5章 市場規模與成長預測
- 按類型
- 硬體
- 感應器
- 邊緣閘道器
- 智慧型穿戴裝置
- 軟體
- 內容管理中介軟體
- 分析與推理引擎
- 服務
- 專業服務
- 託管服務
- 硬體
- 供應商
- 設備製造商
- 行動網路營運商
- 線上社交平臺
- 獨立軟體供應商
- 按最終用戶行業分類
- BFSI
- 家用電器
- 媒體與娛樂
- 車
- 衛生保健
- 電訊
- 物流/運輸
- 其他
- 按地區
- 北美洲
- 美國
- 加拿大
- 墨西哥
- 歐洲
- 英國
- 德國
- 法國
- 義大利
- 其他歐洲國家
- 亞太地區
- 中國
- 日本
- 印度
- 韓國
- 其他亞太國家
- 中東
- 以色列
- 沙烏地阿拉伯
- 阿拉伯聯合大公國
- 土耳其
- 其他中東國家
- 非洲
- 南非
- 埃及
- 其他非洲國家
- 南美洲
- 巴西
- 阿根廷
- 南美洲其他地區
- 北美洲
第6章 競爭情勢
- 市場集中度
- 策略趨勢
- 市佔率分析
- 公司簡介
- IBM Corporation
- Microsoft Corporation
- Cisco Systems Inc.
- Google LLC(Alphabet)
- Oracle Corporation
- Amazon Web Services Inc.
- Verizon Communications Inc.
- Samsung Electronics Co. Ltd.
- Intel Corporation
- Apple Inc.
- Qualcomm Inc.
- Ericsson AB
- Huawei Technologies Co. Ltd.
- Bosch Sensortec GmbH(Robert Bosch GmbH)
- Honeywell International Inc.
- SAP SE
- ATandT Inc.
- Telefonica SA
- LG Electronics Inc.
- Baidu Inc.
第7章 市場機會與未來展望
According to Mordor Intelligence, the context-aware computing market size is expected to grow from USD 70.94 billion in 2025 to USD 78.94 billion in 2026 and is forecast to reach USD 134.62 billion by 2031 at 11.30% CAGR over 2026-2031.
This report is Segmented by Type (Hardware, Software), Vendor (Device Manufacturers, Mobile Network Operators, and More), End-User Industry (BFSI, Consumer Electronics, and More), and Geography (North America, Europe, Asia-Pacific, and More). The Market Size and Forecasts are Provided in Terms of Value (USD).
Global Context Aware Computing Market Trends and Insights
AI-powered Intent Prediction Boosts UX
Large language models and machine-learning pipelines embedded in smartphones, vehicles, and retail kiosks now anticipate user goals, suggesting next actions or auto-completing tasks. Apple Intelligence analyses in-device behaviour, ambient conditions, and messaging style to curate prompts and automate workflows. Organisations deploying comparable models gain higher user retention because experiences feel intuitive and effortless. Value scales rapidly because each interaction refines the model, reinforcing network effects. Capital expenditure on AI infrastructure is rising sharply, evidenced by Oracle's USD 30 billion partnership with OpenAI focused on high-density GPU clusters. As predictive accuracy improves, consumers increasingly expect proactive services as a baseline capability in the context aware computing market.
Edge-computing Cost Decline Widens Adoption
Advanced 3 nm and 4 nm process nodes have reduced cost per tera-ops and improved performance-per-watt. Qualcomm's latest Snapdragon platform embeds a dedicated NPU that supports multimodal context analysis on battery-powered devices, eliminating constant cloud calls. Lower total ownership cost unlocks small and medium-enterprise deployment across smart retail shelving, factory automation, and field-service wearables. This broadening addressable base accelerates unit shipments of sensors and gateways, reinforcing demand in the context aware computing industry.
Privacy-first Regulations Restrict Data Use
GDPR-style mandates require explicit consent, data minimisation, and erasure rights that curtail the unfettered data harvesting once common in mobile applications. Firms now pursue federated learning, differential privacy, and on-premises inference to comply, but these techniques often reduce model accuracy and slow roll-outs. Vendors able to deliver privacy-by-design frameworks gain a trust advantage yet must absorb higher engineering costs. The regulatory swing keeps some enterprises cautious, tempering the near-term growth of the context aware computing market.
Other drivers and restraints analyzed in the detailed report include:
- 5G Rollout Enables Real-time Context Data
- Surge in IoT Endpoints Creates Data Deluge
- High Integration Complexity with Legacy IT
For complete list of drivers and restraints, kindly check the Table Of Contents.
Segment Analysis
Hardware held 51.40% revenue share in 2025 on the strength of sensors, edge gateways, and smart wearables that underpin inference workloads. Sensors for motion, biometrics, and environment represent the largest line-item because every contextual decision starts with precise data capture. Gateways aggregate this input and run first-pass analytics, shortening feedback loops in the context aware computing market. Meanwhile, software outpaces hardware growth at 12.67% CAGR through 2031. Context management middleware harmonises disparate streams, while analytics engines transform raw signals into predictive recommendations. Professional services revenue reflects the steep learning curve enterprises face when tuning data pipelines, security, and compliance. Managed services adoption rises as firms outsource daily operations to focus on business logic.
Software now determines end-user value creation. Middleware vendors bundle schema mapping, identity resolution, and policy enforcement, turning platform choice into a strategic decision. AI inference libraries optimise power draw by splitting workloads across CPU, GPU, and NPU resources. These technical breakthroughs let developers craft granular experiences-such as adaptive in-car infotainment-without rewriting code for every chipset. Resulting demand reinforces upstream sensor and gateway shipments, advancing the context aware computing market size for integrated solutions.
Complete Report Scope:
- By Type
- Hardware
- Sensors
- Edge Gateways
- Smart Wearables
- Software
- Context Management Middleware
- Analytics and Inference Engines
- Services
- Professional Services
- Managed Services
- Hardware
- By Vendor
- Device Manufacturers
- Mobile Network Operators
- Online and Social Platforms
- Independent Software Vendors
- By End-User Industry
- BFSI
- Consumer Electronics
- Media and Entertainment
- Automotive
- Healthcare
- Telecommunication
- Logistics and Transportation
- Other Industries
- By Geography
- North America
- United States
- Canada
- Mexico
- Europe
- United Kingdom
- Germany
- France
- Italy
- Rest of Europe
- Asia-Pacific
- China
- Japan
- India
- South Korea
- Rest of Asia-Pacific
- Middle East
- Israel
- Saudi Arabia
- United Arab Emirates
- Turkey
- Rest of Middle East
- Africa
- South Africa
- Egypt
- Rest of Africa
- South America
- Brazil
- Argentina
- Rest of South America
- North America
Geography Analysis
North America delivered 38.70% of global revenue in 2025, buoyed by robust venture investment, early 5G rollout, and cloud adoption. Enterprises in the United States deploy context-rich customer journeys to lift retention and cross-sell rates. Canada's public-sector digital strategies add to base demand for privacy-centric deployments.
Asia-Pacific records the highest growth trajectory at 14.25% CAGR through 2031. National 5G coverage, device manufacturing hubs, and sizeable digital-native populations combine to expand the context aware computing market. China's 2.57 billion IoT endpoints demonstrate the depth of contextual data available to local ecosystem players. Government stimulus for smart city, healthcare, and industrial upgrade projects further accelerates uptake.
Europe advances on differentiated priorities, balancing innovation with strict privacy law compliance. Vendors that integrate consent management and data localisation win enterprise contracts. The Middle East leverages smart-city megaprojects-such as NEOM in Saudi Arabia-to trial large-scale context platforms. Africa shows leapfrog potential because cloud-native mobile services offer practical solutions where legacy infrastructure is thin. South America's steady smartphone adoption rounds out global demand, with telcos pushing edge computing nodes to support low-latency contextual apps.
- IBM Corporation
- Microsoft Corporation
- Cisco Systems Inc.
- Google LLC (Alphabet)
- Oracle Corporation
- Amazon Web Services Inc.
- Verizon Communications Inc.
- Samsung Electronics Co. Ltd.
- Intel Corporation
- Apple Inc.
- Qualcomm Inc.
- Ericsson AB
- Huawei Technologies Co. Ltd.
- Bosch Sensortec GmbH (Robert Bosch GmbH)
- Honeywell International Inc.
- SAP SE
- ATandT Inc.
- Telefonica S.A.
- LG Electronics Inc.
- Baidu Inc.
Additional Benefits:
- The market estimate (ME) sheet in Excel format
- 3 months of analyst support
TABLE OF CONTENTS
1 INTRODUCTION
- 1.1 Study Assumptions and Market Definition
- 1.2 Scope of the Study
2 RESEARCH METHODOLOGY
3 EXECUTIVE SUMMARY
4 MARKET LANDSCAPE
- 4.1 Market Overview
- 4.2 Market Drivers
- 4.2.1 AI-powered intent prediction boosts UX
- 4.2.2 Edge-computing cost decline widens adoption
- 4.2.3 5G rollout enables real-time context data
- 4.2.4 Surge in IoT endpoints creates data deluge
- 4.2.5 In-car infotainment personalisation demand
- 4.2.6 Context-as-a-Service APIs for SME apps
- 4.3 Market Restraints
- 4.3.1 Privacy-first regulations restrict data use
- 4.3.2 High integration complexity with legacy IT
- 4.3.3 Model bias risks in context inference
- 4.3.4 Limited battery life on wearable devices
- 4.4 Industry Value-Chain Analysis
- 4.5 Porter's Five Forces Analysis
- 4.5.1 Bargaining Power of Suppliers
- 4.5.2 Bargaining Power of Buyers
- 4.5.3 Threat of New Entrants
- 4.5.4 Threat of Substitutes
- 4.5.5 Intensity of Competitive Rivalry
5 MARKET SIZE AND GROWTH FORECASTS (VALUE)
- 5.1 By Type
- 5.1.1 Hardware
- 5.1.1.1 Sensors
- 5.1.1.2 Edge Gateways
- 5.1.1.3 Smart Wearables
- 5.1.2 Software
- 5.1.2.1 Context Management Middleware
- 5.1.2.2 Analytics and Inference Engines
- 5.1.3 Services
- 5.1.3.1 Professional Services
- 5.1.3.2 Managed Services
- 5.1.1 Hardware
- 5.2 By Vendor
- 5.2.1 Device Manufacturers
- 5.2.2 Mobile Network Operators
- 5.2.3 Online and Social Platforms
- 5.2.4 Independent Software Vendors
- 5.3 By End-User Industry
- 5.3.1 BFSI
- 5.3.2 Consumer Electronics
- 5.3.3 Media and Entertainment
- 5.3.4 Automotive
- 5.3.5 Healthcare
- 5.3.6 Telecommunication
- 5.3.7 Logistics and Transportation
- 5.3.8 Other Industries
- 5.4 By Geography
- 5.4.1 North America
- 5.4.1.1 United States
- 5.4.1.2 Canada
- 5.4.1.3 Mexico
- 5.4.2 Europe
- 5.4.2.1 United Kingdom
- 5.4.2.2 Germany
- 5.4.2.3 France
- 5.4.2.4 Italy
- 5.4.2.5 Rest of Europe
- 5.4.3 Asia-Pacific
- 5.4.3.1 China
- 5.4.3.2 Japan
- 5.4.3.3 India
- 5.4.3.4 South Korea
- 5.4.3.5 Rest of Asia-Pacific
- 5.4.4 Middle East
- 5.4.4.1 Israel
- 5.4.4.2 Saudi Arabia
- 5.4.4.3 United Arab Emirates
- 5.4.4.4 Turkey
- 5.4.4.5 Rest of Middle East
- 5.4.5 Africa
- 5.4.5.1 South Africa
- 5.4.5.2 Egypt
- 5.4.5.3 Rest of Africa
- 5.4.6 South America
- 5.4.6.1 Brazil
- 5.4.6.2 Argentina
- 5.4.6.3 Rest of South America
- 5.4.1 North America
6 COMPETITIVE LANDSCAPE
- 6.1 Market Concentration
- 6.2 Strategic Moves
- 6.3 Market Share Analysis
- 6.4 Company Profiles (includes Global-level Overview, Market-level Overview, Core Segments, Financials, Strategic Information, Market Rank/Share, Products and Services, Recent Developments)
- 6.4.1 IBM Corporation
- 6.4.2 Microsoft Corporation
- 6.4.3 Cisco Systems Inc.
- 6.4.4 Google LLC (Alphabet)
- 6.4.5 Oracle Corporation
- 6.4.6 Amazon Web Services Inc.
- 6.4.7 Verizon Communications Inc.
- 6.4.8 Samsung Electronics Co. Ltd.
- 6.4.9 Intel Corporation
- 6.4.10 Apple Inc.
- 6.4.11 Qualcomm Inc.
- 6.4.12 Ericsson AB
- 6.4.13 Huawei Technologies Co. Ltd.
- 6.4.14 Bosch Sensortec GmbH (Robert Bosch GmbH)
- 6.4.15 Honeywell International Inc.
- 6.4.16 SAP SE
- 6.4.17 ATandT Inc.
- 6.4.18 Telefonica S.A.
- 6.4.19 LG Electronics Inc.
- 6.4.20 Baidu Inc.
7 MARKET OPPORTUNITIES AND FUTURE OUTLOOK
- 7.1 White-space and Unmet-Need Assessment

 情境感知計算市場規模、佔有率、趨勢和預測:按產品類型、供應商類型、情境類型、網路類型、產業垂直領域和地區分類(2026-2034 年)
 全球情境感知計算市場規模、佔有率、趨勢和成長分析報告(2026-2034)
 情境感知計算市場:按組件、技術、最終用戶和地區分類
 情境感知計算市場:按組件、技術、產業、應用和最終用戶分類 - 2026-2032 年全球預測
 2026年全球情境感知計算市場報告情境感知計算市場規模、佔有率、成長及全球產業分析:按類型、應用和地區分類的洞察,2026-2034 年預測
 情境感知計算市場分析及至2035年預測:按類型、產品類型、服務、技術、組件、應用、部署類型、最終用戶和功能分類