


 |
市場調查報告書
商品編碼
2122278
主動式地理圍籬:市場佔有率分析、產業趨勢與統計資料、成長預測(2026-2031 年)Active Geofencing - Market Share Analysis, Industry Trends & Statistics, Growth Forecasts (2026 - 2031) |
||||||

※ 本網頁內容可能與最新版本有所差異。詳細情況請與我們聯繫。
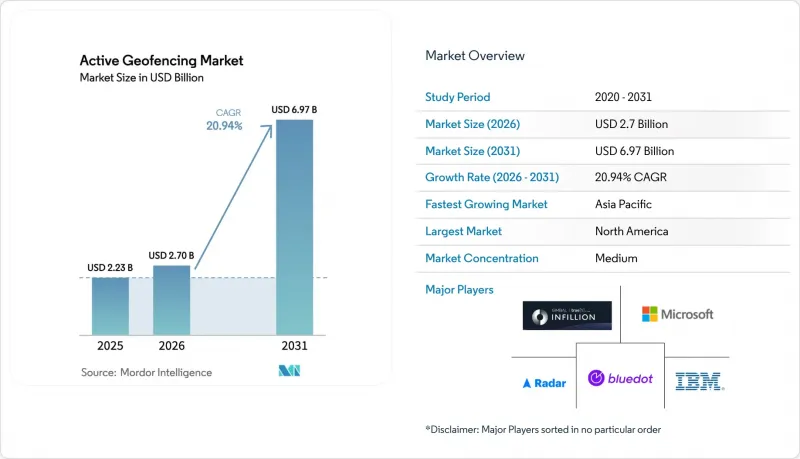
根據 Mordor Intelligence 預測,主動式地理圍籬市場規模將從 2025 年的 22.3 億美元成長到 2026 年的 27 億美元,然後在 2031 年達到 69.7 億美元,2026 年至 2031 年的複合年成長率為 20.94%。
本報告按組件(解決方案、服務)、部署模式(雲端、本地部署、混合部署)、技術(GPS/GNSS、蜂窩網路等)、最終用戶公司規模(中小企業、大型企業)、最終用戶行業(銀行、金融服務和保險、零售/電子商務等)以及地區(北美、南美、歐洲、亞太等)進行細分。市場預測以美元計價。
全球主動地理圍籬市場趨勢與洞察
物聯網行動裝置的普及
2025年,預計全球將有約300億台連網設備運作,形成高密度感測器網路,為地理圍籬引擎提供高精度位置資料流。現代智慧型手機融合了GPS、行動電話、Wi-Fi RTT和低功耗藍牙技術,可實現亞米級定位精度,從而支援醫院資產追蹤和工業自動化等安全關鍵型應用情境。 5G的超低延遲將進一步縮短地理圍欄的反應時間,確保警報和控制訊息在關鍵任務閾值內送達。
對在地化行銷的需求日益成長
零售商和快餐店正在利用地理圍欄技術推送限時優惠,與非定向訊息相比,客戶獲取率提高了三倍。地理圍欄技術的成本低於印刷和戶外廣告,並且能夠衡量店內客流量的貢獻,因此各大連鎖店正將其納入全通路策略。此外,基於即時出行時間模型的動態半徑設定能夠提高訊息的針對性,在維持高用戶參與度的同時,減少廣告浪費。
加強消費者隱私保護法規
繼美國聯邦貿易委員會 (FTC) 禁止出售高度敏感的位置資料並對美國電信公司處以數百萬美元罰款後,供應商被迫投資於精細化的用戶許可管理和設備端匿名化技術。歐洲的《一般資料保護規範》(GDPR) 仍然是全球標準,要求位置追蹤必須獲得明確的同意,並嚴格限制資料量。在美國,主動式地理圍籬工作流程必須根據各州法規進行調整,由此產生的合規負擔可能會導致實施延遲。
細分市場分析
預計到2025年,解決方案業務部門將佔總收入的65.74%,而服務業務板塊預計將實現17.55%的複合年成長率,這主要得益於企業將需要稀缺空間分析專業知識的設計、部署和最佳化任務外包。系統整合商透過整合合規性稽核、低程式碼應用程式開發和託管監控服務,幫助客戶在數週而非數季內啟動宣傳活動。在監管嚴格的行業中,服務供應商正在最佳化用戶授權流程和加密設置,以確保一次性通過HIPAA和PCI審計。對基於結果的合約日益成長的需求促使供應商將費用與訪客數量的增加或盜竊事件的減少掛鉤,從而協調獎勵並提高客戶留存率。
此外,平台供應商正在推廣認證專案以擴大人才庫,大學也在位置工程領域創建新的微證書。這些措施降低了中小企業的進入門檻,並擴大了活躍地理圍欄市場的整體規模。持續最佳化服務,例如更新多邊形邊界、修改停留時間規則以及對創新素材進行A/B測試,使得即使城市人口密度、交通模式和店鋪面積發生變化,也能維持宣傳活動的有效性。
由於其強大的可擴展性和全球覆蓋能力,預計到2025年,雲端運算將保持65.95%的市場佔有率。但混合架構的成長速度最快,複合年成長率高達19.11%,因為它們允許企業在本地處理敏感的座標數據,同時將分析處理任務卸載到雲端。例如,醫院正在利用雲端人工智慧預測床位需求,同時在私有子網路內維護病患層級的位置資料。金融機構也遵循類似的模式,在本地執行地理圍欄檢查以預防欺詐,同時將聚合的熱力圖發送到雲端以獲取行銷洞察。
邊緣設備(路由器、閘道器和智慧型手機)現在配備了輕量級仲介,可在毫秒內確定每條位置規則的執行位置。這種自適應路由可減少安全關鍵警報的延遲,並降低出站流量。隨著各國資料主權法律的日益普及,供應商正在將資料居住管理功能整合到其地理圍籬策略引擎中,從而確保跨多個司法管轄區的大規模部署能夠應對力未來需求。
區域分析
北美地區憑藉其廣泛的5G部署、成熟的廣告生態系統和雄厚的企業IT預算,預計到2025年將佔全球銷售額的38.02%。美國零售商透過在會員應用程式中添加地理圍欄功能,實現了客流量兩位數的成長;物流公司也普遍在履約中心部署地理圍欄技術,以減少裝卸貨平台的閒置時間。美國聯邦貿易委員會(FTC)明確的執法立場建立了可預測的合規規則,使供應商能夠推動創新,而無需猜測監管方向。在加拿大,地理圍欄技術已被應用於政府數位服務入口網站;在墨西哥,隨著電子商務的快速發展,宅配業者和購物中心營運商也擴大採用該技術。
亞太地區是成長最快的地區,預計到2031年複合年成長率將達到17.01%,這主要得益於都市化、智慧型手機普及率的提高以及特大城市智慧基礎設施項目的推進。中國的「超級應用」正在將地理圍籬技術整合到支付、叫車和本地商業等各個領域,使這項技術惠及十億消費者。印度的「統一物流介面平台」將承運商API與經地理圍籬檢驗的交付里程碑連接起來,簡化了監管報告流程並降低了滯期費。韓國和日本的先進5G專用網路先導計畫正在支援工廠自動化,圍繞機器人工作單元的微型地理圍欄可確保工人安全和資產保護。
在歐洲,「隱私優先」理念正保持著穩定發展動能。斯德哥爾摩和巴塞隆納等城市正在利用地理圍欄技術創建“綠色區域”,引導污染車輛繞行,從而減少交通堵塞和排放氣體。製造商正在將地理圍欄技術整合到工業4.0生產線中,用於預測性維護和預防事故。歐盟委員會推動建立城市交通通用資料層,這促進了可互通地理圍籬標準的製定,並提高了跨境物流的效率。東歐的物流樞紐和北歐的可再生能源發電發電廠也加入了各種區域應用的行列。
其他好處:
- Excel格式的市場預測(ME)表
- 3個月的分析師支持
目錄
第1章:引言
- 研究假設和市場定義
- 調查範圍
第2章:調查方法
第3章執行摘要
第4章 市場狀況
- 市場概覽
- 市場促進因素
- 物聯網行動裝置的普及正在加速收集高精度位置資訊。
- 零售商和速食店對在地化行銷的需求日益成長。
- 將地理圍欄技術整合到車隊遠端資訊處理和最後一公里物流中
- 擴大無人機在工業巡檢中的應用,這需要對安全區域進行動態地理圍籬。
- 政府的智慧城市計畫強制要求在公共服務中使用位置資訊。
- 空間運算和擴增實境平台的出現需要即時地理圍欄層。
- 市場限制因素
- 加強消費者隱私法規,限制持續追蹤
- 對始終運作的應用程式所導致的電池消耗過快和裝置效能問題表示擔憂。
- 室內和室外位置資訊科技的精度差異
- 來自各種 LBS 平台的競爭性替代方案正在使地理圍欄技術商品化。
- 產業價值鏈分析
- 監理情勢
- 技術展望
- 波特五力分析
第5章 市場規模與成長預測
- 按組件
- 解決方案
- 服務
- 部署模式
- 雲
- 現場
- 混合
- 透過技術
- GPS/GNSS
- 細胞
- Wi-Fi/BLE
- RFID/NFC
- 無人機地理圍籬系統
- 按最終用戶公司規模分類
- 中小企業
- 大公司
- 按最終用戶行業分類
- 銀行、金融服務和保險(BFSI)
- 零售與電子商務
- 運輸/物流
- 醫療保健和生命科學
- 政府/國防
- 工業製造
- 媒體與娛樂
- 其他終端用戶產業
- 按地區
- 北美洲
- 美國
- 加拿大
- 墨西哥
- 南美洲
- 巴西
- 阿根廷
- 其他南美國家
- 歐洲
- 德國
- 英國
- 法國
- 義大利
- 西班牙
- 俄羅斯
- 其他歐洲國家
- 亞太地區
- 中國
- 印度
- 日本
- 韓國
- 澳洲和紐西蘭
- ASEAN
- 其他亞太國家
- 中東和非洲
- 中東
- 沙烏地阿拉伯
- 阿拉伯聯合大公國
- 土耳其
- 其他中東國家
- 非洲
- 南非
- 奈及利亞
- 肯亞
- 其他非洲國家
- 中東
- 北美洲
第6章 競爭情勢
- 市場集中度
- 策略趨勢
- 市佔率分析
- 公司簡介
- Google LLC
- Apple Inc.
- Microsoft Corporation
- IBM Corporation
- Amazon Web Services, Inc.
- ESRI, Inc.
- Bluedot Innovation Pty Ltd
- Radar Labs Inc.
- Infillion Inc.(Gimbal)
- Verve Group, Inc.
- HERE Technologies
- Qualcomm Technologies, Inc.
- GeoComply Solutions Inc.
- LocationSmart
- Skyhook Holdings, Inc.
- Samsung Electronics Co., Ltd.
- Oracle Corporation
- SAP SE
- TomTom International BV
- Uber Technologies, Inc.(Uber Map Services)
- Unacast, Inc.
- Foursquare Labs, Inc.
- SZ DJI Technology Co., Ltd.
- Geofeedia, Inc.
第7章 市場機會與未來展望
According to Mordor Intelligence, the active geofencing market size is expected to grow from USD 2.23 billion in 2025 to USD 2.7 billion in 2026 and is forecast to reach USD 6.97 billion by 2031 at 20.94% CAGR over 2026-2031.
This report is Segmented by Component (Solutions, Services), Deployment Mode (Cloud, On-Premise, Hybrid), Technology (GPS/GNSS, Cellular, and More), End-User Enterprise Size (SMEs, Large Enterprises), End-User Industry Vertical (BFSI, Retail and E-Commerce, and More), and Geography (North America, South America, Europe, Asia Pacific, and More). The Market Forecasts are Provided in Terms of Value (USD).
Global Active Geofencing Market Trends and Insights
Proliferation of IoT-enabled Mobile Devices
Roughly 30 billion connected devices will be active worldwide by 2025, providing a dense sensor fabric that feeds high-granularity location streams into geofencing engines. Modern smartphones fuse GPS, cellular, Wi-Fi RTT, and Bluetooth Low Energy to achieve sub-meter accuracy, enabling safety-critical use cases such as hospital asset tracking and industrial automation. 5G's ultra-low latency further tightens geofence response times, ensuring that alerts or control messages execute inside mission-critical thresholds.
Rising Demand for Hyper-local Marketing
Retailers and quick-service restaurants use geofencing to push time-sensitive offers that triple acquisition rates versus untargeted messaging. Lower CPMs than print or out-of-home media, combined with measurable foot-traffic attribution, have led major chains to embed geofencing into omnichannel playbooks. Dynamic radius sizing based on real-time travel time models also raises message relevance, sustaining high engagement while lowering ad waste.
Heightened Consumer-privacy Regulations
The FTC's prohibition on selling sensitive geolocation data, combined with multimillion-dollar penalties levied on U.S. carriers, compels vendors to invest in granular consent management and on-device anonymization. Europe's GDPR remains the global template, requiring explicit opt-in for location tracking and rigorous data minimization. Adapting active geofencing workflows to multiple state-level rules in the United States adds compliance overhead that can slow roll-outs.
Other drivers and restraints analyzed in the detailed report include:
- Integration with Fleet Telematics and Last-mile Logistics
- Expansion of Drone-based Inspections
- Battery-drain and Device-performance Concerns
For complete list of drivers and restraints, kindly check the Table Of Contents.
Segment Analysis
Solution contributed 65.74% of 2025 revenue, and the services segment is on track for 17.55% CAGR as enterprises outsource design, deployment, and optimization tasks that demand scarce spatial-analytics expertise. System integrators bundle compliance audits, low-code app development, and managed monitoring so that customers can launch campaigns in weeks instead of quarters. In regulated sectors, service providers fine-tune consent flows and encryption settings to pass HIPAA or PCI audits on the first attempt. Rising demand for outcome-based contracts is encouraging vendors to peg fees to lift in foot traffic or reduction in theft incidents, aligning incentives and deepening client stickiness.
Platform vendors also promote certification programs to enlarge the talent pool, while universities add micro-credentials in location engineering. These initiatives ease the entry barrier for small businesses and expand the overall active geofencing market. Continuous optimization services updating polygon boundaries, modifying dwell-time rules, and A/B testing creative assets ensure that campaigns remain effective as urban density, traffic patterns, or store footprints evolve
Cloud retained 65.95% share in 2025 thanks to elastic scaling and global coverage, but hybrid architectures are growing fastest at 19.11% CAGR because they let firms process sensitive coordinates on-premise while offloading analytics to the cloud. Hospitals, for example, keep patient-level location events inside a private subnet yet use cloud AI to forecast bed demand. Financial institutions follow a similar pattern: geofence checks for fraud prevention run locally, whereas aggregated heat maps go to the cloud for marketing insights.
Edge devices routers, gateways, and smartphones now host lightweight brokers that decide, in milliseconds, where to execute each location rule. This adaptive routing lowers latency for safety-critical alerts and trims egress fees. As national data-sovereignty laws proliferate, vendors bundle geo-fencing policy engines with data-residency controls, thereby future-proofing large deployments across multiple jurisdictions.
Complete Report Scope:
- By Component
- Solution
- Services
- By Deployment Mode
- Cloud
- On-premise
- Hybrid
- By Technology
- GPS/GNSS
- Cellular
- Wi-Fi/BLE
- RFID/NFC
- UAV/Drone Geofencing Systems
- By End-User Enterprise Size
- Small and Medium Enterprises (SMEs)
- Large Enterprises
- By End-User Industry Vertical
- Banking, Financial Services and Insurance (BFSI)
- Retail and E-commerce
- Transportation and Logistics
- Healthcare and Life Sciences
- Government and Defense
- Industrial Manufacturing
- Media and Entertainment
- Other End-user Industry Vertical
- By Geography
- North America
- United States
- Canada
- Mexico
- South America
- Brazil
- Argentina
- Rest of South America
- Europe
- Germany
- United Kingdom
- France
- Italy
- Spain
- Russia
- Rest of Europe
- Asia Pacific
- China
- India
- Japan
- South Korea
- Australia and New Zealand
- ASEAN
- Rest of Asia Pacific
- Middle East and Africa
- Middle East
- Saudi Arabia
- United Arab Emirates
- Turkey
- Rest of Middle East
- Africa
- South Africa
- Nigeria
- Kenya
- Rest of Africa
- Middle East
- North America
Geography Analysis
North America held 38.02% revenue share in 2025 owing to widespread 5G coverage, mature advertising ecosystems, and strong enterprise IT budgets. U.S. retailers report double-digit foot-traffic lift when adding geofencing to loyalty apps, and logistics providers routinely geofence fulfilment centres to shave loading-dock idle time. The FTC's clear enforcement stance creates predictable compliance rules that let vendors innovate without guessing the regulatory direction. Canada leverages geofencing in government digital-service portals, while Mexico's e-commerce boom fuels adoption among parcel carriers and mall operators.
Asia Pacific is the fastest-growing region at 17.01% CAGR through 2031, helped by urbanization, smartphone saturation, and megacity smart-infrastructure projects. China's "super-apps" embed geofencing across payments, ride-hailing, and local commerce, normalizing the technology for 1 billion consumers. India's Unified Logistics Interface Platform links carrier APIs with geofence-verified delivery milestones, streamlining regulatory filings and reducing demurrage. Advanced 5G private-network pilots in South Korea and Japan support factory automation, where micro-geofences around robotic workcells ensure worker safety and asset protection.
Europe maintains steady momentum under a privacy-first paradigm. Cities such as Stockholm and Barcelona use geofenced "green zones" to redirect polluting vehicles, cutting congestion and emissions. Manufacturers integrate geofencing into Industry 4.0 lines for predictive maintenance and accident prevention. The European Commission's push for common urban-mobility data layers is spurring interoperable geofencing standards, enhancing cross-border logistics efficiency. Eastern European logistics hubs and Nordic renewable-energy plants add to a diverse set of regional deployments.
- Google LLC
- Apple Inc.
- Microsoft Corporation
- IBM Corporation
- Amazon Web Services, Inc.
- ESRI, Inc.
- Bluedot Innovation Pty Ltd
- Radar Labs Inc.
- Infillion Inc. (Gimbal)
- Verve Group, Inc.
- HERE Technologies
- Qualcomm Technologies, Inc.
- GeoComply Solutions Inc.
- LocationSmart
- Skyhook Holdings, Inc.
- Samsung Electronics Co., Ltd.
- Oracle Corporation
- SAP SE
- TomTom International B.V.
- Uber Technologies, Inc. (Uber Map Services)
- Unacast, Inc.
- Foursquare Labs, Inc.
- SZ DJI Technology Co., Ltd.
- Geofeedia, Inc.
Additional Benefits:
- The market estimate (ME) sheet in Excel format
- 3 months of analyst support
TABLE OF CONTENTS
1 INTRODUCTION
- 1.1 Study Assumptions and Market Definition
- 1.2 Scope of the Study
2 RESEARCH METHODOLOGY
3 EXECUTIVE SUMMARY
4 MARKET LANDSCAPE
- 4.1 Market Overview
- 4.2 Market Drivers
- 4.2.1 Proliferation of IoT-enabled mobile devices driving precise location data
- 4.2.2 Rising demand for hyper-local marketing among retailers and QSRs
- 4.2.3 Integration of geofencing in fleet telematics and last-mile logistics
- 4.2.4 Expansion of drone-based industrial inspections requiring dynamic geofence safety zones
- 4.2.5 Government smart-city initiatives mandating geo-aware public services
- 4.2.6 Emergence of spatial computing and AR platforms needing real-time geofencing layers
- 4.3 Market Restraints
- 4.3.1 Heightened consumer-privacy regulations limiting persistent tracking
- 4.3.2 Battery-drain and device-performance concerns with always-on apps
- 4.3.3 Fragmented accuracy across indoor/outdoor geolocation technologies
- 4.3.4 Competitive substitution from broad LBS platforms commoditising geofencing
- 4.4 Industry Value-Chain Analysis
- 4.5 Regulatory Landscape
- 4.6 Technological Outlook
- 4.7 Porter's Five Forces Analysis
- 4.7.1 Bargaining Power of Suppliers
- 4.7.2 Bargaining Power of Buyers
- 4.7.3 Threat of New Entrants
- 4.7.4 Threat of Substitute Products
- 4.7.5 Intensity of Competitive Rivalry
5 MARKET SIZE AND GROWTH FORECASTS (VALUE)
- 5.1 By Component
- 5.1.1 Solution
- 5.1.2 Services
- 5.2 By Deployment Mode
- 5.2.1 Cloud
- 5.2.2 On-premise
- 5.2.3 Hybrid
- 5.3 By Technology
- 5.3.1 GPS/GNSS
- 5.3.2 Cellular
- 5.3.3 Wi-Fi/BLE
- 5.3.4 RFID/NFC
- 5.3.5 UAV/Drone Geofencing Systems
- 5.4 By End-User Enterprise Size
- 5.4.1 Small and Medium Enterprises (SMEs)
- 5.4.2 Large Enterprises
- 5.5 By End-User Industry Vertical
- 5.5.1 Banking, Financial Services and Insurance (BFSI)
- 5.5.2 Retail and E-commerce
- 5.5.3 Transportation and Logistics
- 5.5.4 Healthcare and Life Sciences
- 5.5.5 Government and Defense
- 5.5.6 Industrial Manufacturing
- 5.5.7 Media and Entertainment
- 5.5.8 Other End-user Industry Vertical
- 5.6 By Geography
- 5.6.1 North America
- 5.6.1.1 United States
- 5.6.1.2 Canada
- 5.6.1.3 Mexico
- 5.6.2 South America
- 5.6.2.1 Brazil
- 5.6.2.2 Argentina
- 5.6.2.3 Rest of South America
- 5.6.3 Europe
- 5.6.3.1 Germany
- 5.6.3.2 United Kingdom
- 5.6.3.3 France
- 5.6.3.4 Italy
- 5.6.3.5 Spain
- 5.6.3.6 Russia
- 5.6.3.7 Rest of Europe
- 5.6.4 Asia Pacific
- 5.6.4.1 China
- 5.6.4.2 India
- 5.6.4.3 Japan
- 5.6.4.4 South Korea
- 5.6.4.5 Australia and New Zealand
- 5.6.4.6 ASEAN
- 5.6.4.7 Rest of Asia Pacific
- 5.6.5 Middle East and Africa
- 5.6.5.1 Middle East
- 5.6.5.1.1 Saudi Arabia
- 5.6.5.1.2 United Arab Emirates
- 5.6.5.1.3 Turkey
- 5.6.5.1.4 Rest of Middle East
- 5.6.5.2 Africa
- 5.6.5.2.1 South Africa
- 5.6.5.2.2 Nigeria
- 5.6.5.2.3 Kenya
- 5.6.5.2.4 Rest of Africa
- 5.6.5.1 Middle East
- 5.6.1 North America
6 COMPETITIVE LANDSCAPE
- 6.1 Market Concentration
- 6.2 Strategic Moves
- 6.3 Market Share Analysis
- 6.4 Company Profiles (includes Global level Overview, Market level overview, Core Segments, Financials as available, Strategic Information, Market Rank/Share for key companies, Products and Services, and Recent Developments)
- 6.4.1 Google LLC
- 6.4.2 Apple Inc.
- 6.4.3 Microsoft Corporation
- 6.4.4 IBM Corporation
- 6.4.5 Amazon Web Services, Inc.
- 6.4.6 ESRI, Inc.
- 6.4.7 Bluedot Innovation Pty Ltd
- 6.4.8 Radar Labs Inc.
- 6.4.9 Infillion Inc. (Gimbal)
- 6.4.10 Verve Group, Inc.
- 6.4.11 HERE Technologies
- 6.4.12 Qualcomm Technologies, Inc.
- 6.4.13 GeoComply Solutions Inc.
- 6.4.14 LocationSmart
- 6.4.15 Skyhook Holdings, Inc.
- 6.4.16 Samsung Electronics Co., Ltd.
- 6.4.17 Oracle Corporation
- 6.4.18 SAP SE
- 6.4.19 TomTom International B.V.
- 6.4.20 Uber Technologies, Inc. (Uber Map Services)
- 6.4.21 Unacast, Inc.
- 6.4.22 Foursquare Labs, Inc.
- 6.4.23 SZ DJI Technology Co., Ltd.
- 6.4.24 Geofeedia, Inc.
7 MARKET OPPORTUNITIES AND FUTURE OUTLOOK
- 7.1 White-space and Unmet-need Assessment

 全球地理圍籬市場規模、佔有率、趨勢和成長分析報告(2026-2034年)
 主動式地理圍籬市場-2026-2032年全球市場預測
 2026年全球主動地理圍籬市場報告2026年全球地理圍籬市場報告
 地理圍籬行銷市場預測至2034年-按組件、地理圍籬類型、部署形式、技術、應用、最終用戶和地區分類的全球分析地理圍籬市場規模、佔有率、成長及全球產業分析:按類型、應用和地區分類的洞察,2026-2034 年預測
 地理圍籬市場分析及至2035年預測:類型、產品類型、服務、技術、組件、應用、部署模式、最終用戶、解決方案
 2026-2030年全球地理圍籬市場2026年全球地理圍籬軟體市場報告
 地理圍籬市場規模、佔有率和成長分析(按組件、地理圍籬類型、組織規模、垂直產業和地區分類)-2026-2033年產業預測