


 |
市場調查報告書
商品編碼
2122179
智慧水錶:市場佔有率分析、產業趨勢與統計及成長預測(2026-2031)Smart Water Meter - Market Share Analysis, Industry Trends & Statistics, Growth Forecasts (2026 - 2031) |
||||||

※ 本網頁內容可能與最新版本有所差異。詳細情況請與我們聯繫。
據 Mordor Intelligence 稱,2025 年智慧水錶市值為 48.1 億美元,預計到 2031 年將達到 87.7 億美元,而 2026 年為 53.2 億美元,預測期(2026-2031 年)的複合年成長率為 10.55%。
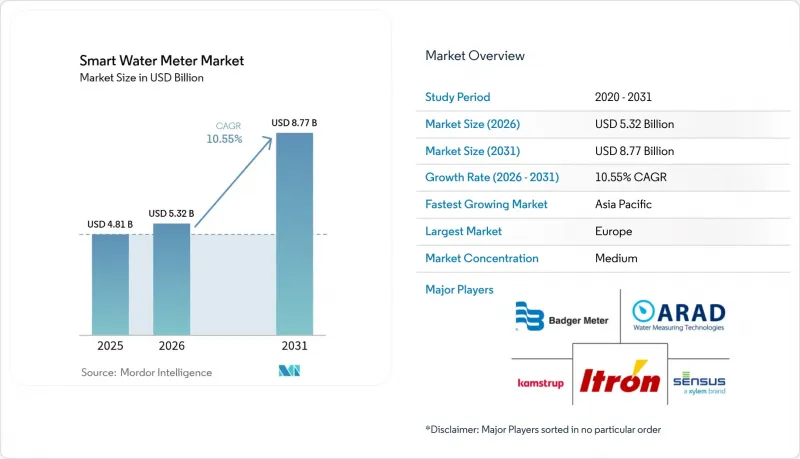
本報告按技術(自動抄表和高級計量基礎設施)、應用(住宅等)、電錶類型(機械/渦輪、超音波、電磁)、通訊技術(射頻、LoRaWAN/其他LPWAN等)、組件(硬體、軟體和分析、服務)、部署(新安裝和維修/更換)以及地區進行分類。
全球智慧水錶市場趨勢及洞察
政府法規提供支援。
強制性部署計畫和水資源效率標準正迫使供水事業實施符合合規和報告要求的先進計量解決方案。歐盟飲用水指令強制要求端到端監測,促使德國和法國要求所有新建建築和重大維修安裝智慧水錶。加州的永久性用水法規要求提供詳細數據以用於執法,並將高級計量檢測 (AMI) 的部署作為獲得資金的必要條件。供水事業可以透過證明減少漏損和提高客戶參與來獲得成本回收機制,從而降低投資風險並加快在其管轄範圍內的部署。供應商可以透過大量訂購來降低單位成本,而政策制定者可以確保透明的績效指標來追蹤節水進展。在市級、區域級和國家級層面,相關法規為智慧水錶市場的廣泛應用提供了長期確定性的基礎。
提高用水效率的必要性
在缺水地區,供水事業正在部署智慧水錶,以識別高用水模式,並向客戶提供每小時的數據,從而引導使用者改變用水行為。利用連續遙測技術的工業設施透過識別洩漏點和最佳化流程,實現了20%至30%的用水量減少。一項農業領域的試點計畫將土壤濕度感測器與基於天氣的灌溉計畫相結合,實現了高達28%的節水效果,展現了智慧水錶在跨產業的效用。由於水的生產和抽水涉及大量的營運成本,提高效率也意味著節能。透過分析應用程式進行需求預測,供水事業可以平衡用水高峰期的需求,並推遲產能擴張。隨著供水事業將節水與收入脫鉤聯繫起來,效率的提高帶來了穩定的財務業績,從而推動了智慧水錶市場的成長。
高昂的初始成本和網路安全風險
全面部署智慧水錶(AMI)的成本為每個終端200至400美元,這對資金預算緊張的供水事業來說是一個巨大的挑戰。費率調整的核准可能需要數年時間,從而推遲專案啟動日期。網路安全措施、加密、入侵偵測和全天候監控又會使專案總成本增加15%至25%。尤其是在開發中國家,如果沒有優惠融資,對小規模系統的投資往往會被延後。備受矚目的網路安全事件導致監管審查力度加大,進一步推高了合規成本。這些因素共同限制了智慧水錶市場的成長,直到資金籌措機製成熟和安全框架標準化為止。
細分市場分析
到2025年,自動抄表(AMR)系統將佔據智慧水錶市場57.10%的佔有率,這反映了其穩固的基礎和經濟高效的單向資料傳輸特性。許多供水事業在現代化初期就採用AMR系統,因為這種無需建造大規模網路的駕車式資料收集方式能夠大幅減少人工勞動。雖然與AMR相關的智慧水錶市場規模依然龐大,但隨著雙向架構在第二代部署中佔據主導地位,其成長速度正在放緩。
隨著公共產業對即時洩漏警報、遠端斷水和分時收費系統的需求日益成長,高級計量基礎設施 (AMI) 預計到 2031 年將以 11.55% 的複合年成長率成長。蜂窩網路、NB-IoT 和 LoRaWAN 模組成本的下降正在消除 AMI 普及的關鍵障礙。服務供應商將水錶、分析和軟體的訂閱服務打包出售,從而將資本成本分攤到營運預算中。 AMI 平台能夠處理豐富的數據,並可輕鬆整合到節水專案中,從而加速在地化應用,並促進智慧水錶市場的擴張。
在歐洲和北美,一系列強制在新住宅中安裝智慧水錶的法規使得到2025年,住宅智慧水錶的安裝量將佔智慧水錶市場的58.00%。消費者可以從將節水目標與實際節水效果連結起來的使用入口網站中受益,並且保持穩定的更新週期。
商業建築的智慧水錶應用速度最快,複合年成長率高達11.85%,這主要得益於能夠整合水、電和空調(HVAC)數據的設施管理軟體。高層建築業主透過降低營運成本和獲得綠色建築認證來證明其投資的合理性。零售連鎖店和旅館企業正在利用分析技術對每個門市進行基準測試,識別隱藏的洩漏點並最佳化灌溉系統。隨著永續發展報告框架日益嚴格,企業用戶正在擴大智慧水錶的應用範圍,從而推動智慧水錶市場的整體成長。
區域分析
在歐盟指令的支持下,歐洲預計將在智慧水錶市場佔據主導地位,到2025年將佔據36.10%的市場佔有率,強制要求追蹤水損並實施透明計費。各國制定的部署藍圖確保了穩定的競標管道,而長期供應商合約架構則簡化了採購流程。此外,公共產業也正在利用旨在增強氣候適應能力的復甦資金,加速部署高級計量基礎設施(AMI),以支持全部區域穩定的用水需求。
亞太地區正經歷最快成長,預計到2031年將達到12.05%的複合年成長率。在中國,智慧水錶計量功能正被整合到鄰近區域的數位孿生模型中,應用於廣泛的智慧都市化,以避免因技術落後而造成的巨額成本。政府補貼、多邊融資和官民合作關係正在共同推動智慧水錶部署規模的擴大,並促進智慧水錶市場的發展。
在北美,老舊基礎設施的更新和各州範圍內的節水指令正在推動水資源成長。加州公共產業正在部署高級計量基礎設施(AMI),以強制執行人均用水量限制,並透過遠端斷水功能增強應對野火的能力。在加拿大,各州針對非營利水資源回收的現代化計畫正在推動水資源的進一步成長。在拉丁美洲,巴西的特許經營競標預示著未來巨大的商機。與此同時,中東和非洲的公共產業正在利用智慧水錶來解決水資源短缺問題並減少濫用,但實施進展因資金籌措和通訊網路的完善程度而異。
其他好處:
- Excel格式的市場預測(ME)表
- 3個月的分析師支持
目錄
第1章:引言
- 研究假設和市場定義
- 調查範圍
第2章:調查方法
第3章執行摘要
第4章 市場狀況
- 市場概覽
- 市場促進因素
- 促進市場的政府法規
- 有必要提高用水效率。
- 減少無收益水(NRW)損失
- 智慧城市與物聯網平台的融合
- 以「以儲蓄比例支付」為基礎的資金籌措模式。
- 因乾旱而產生的節水義務
- 市場限制因素
- 高昂的初始成本和網路安全風險
- 系統整合的複雜性
- 公共產業部門數據分析師短缺
- 超音波設備電池壽命的限制
- 產業價值鏈分析
- 監理情勢
- 技術展望
- 波特五力分析
- 智慧電錶投資報酬率分析
- 協議基準比較
- LoRaWAN部署流程和用例
- 公共產業數位化帶來的益處
- 宏觀經濟因素對市場的影響
第5章 市場規模與成長預測
- 透過技術
- 自動抄表(AMR)
- 先進計量基礎設施(AMI)
- 透過使用
- 住宅
- 商業
- 產業
- 農業
- 依計量器類型
- 機械式/渦輪式
- 超音波
- 電磁學
- 透過通訊技術
- 射頻(專有射頻)
- LoRaWAN 和其他低功耗廣域網
- 蜂窩網路(NB-IoT/LTE-M)
- 有線(M-Bus/乙太網路)
- 按組件
- 硬體
- 軟體和分析
- 服務
- 不同的發展
- 新推出
- 維修/更換
- 按地區
- 北美洲
- 美國
- 加拿大
- 墨西哥
- 南美洲
- 巴西
- 阿根廷
- 智利
- 其他南美國家
- 歐洲
- 德國
- 英國
- 法國
- 義大利
- 西班牙
- 其他歐洲國家
- 亞太地區
- 中國
- 印度
- 日本
- 韓國
- 馬來西亞
- 新加坡
- 澳洲
- 其他亞太國家
- 中東和非洲
- 中東
- 阿拉伯聯合大公國
- 沙烏地阿拉伯
- 土耳其
- 其他中東國家
- 非洲
- 南非
- 奈及利亞
- 其他非洲國家
- 中東
- 北美洲
第6章 競爭情勢
- 市場集中度
- 策略趨勢
- 市佔率分析
- 公司簡介
- Arad Ltd.
- Badger Meter Inc.
- Itron Inc.
- Sensus USA Inc.(Xylem Inc.)
- Kamstrup A/S
- Diehl Stiftung and Co. KG
- Zenner International GmbH and Co. KG
- Landis+Gyr Group AG
- Honeywell International Inc.
- Neptune Technology Group Inc.(Roper)
- Aclara Technologies LLC(Hubbell)
- Apator SA
- Axioma Metering
- B Meters Srl
- Datamatic Inc.
- Maddalena SpA
- Suntront Tech Co., Ltd.
- Mueller Systems LLC
- Waviot
- Watertech SpA(Arad)
- Jiangxi Sanchuan Water Meter Co. Ltd.
- Ningbo Water Meter Co. Ltd.
- BETAR Company
- Integra Metering AG
- IESLab Electronic Co. Ltd.
第7章 市場機會與未來展望
According to Mordor Intelligence, the smart water meter market size was valued at USD 4.81 billion in 2025 and estimated to grow from USD 5.32 billion in 2026 to reach USD 8.77 billion by 2031, at a CAGR of 10.55% during the forecast period (2026-2031).
This report is Segmented by Technology (Automatic Meter Reading & Advanced Metering Infrastructure), Application (Residential, and More), Meter Type (Mechanical/Turbine, Ultrasonic, and Electromagnetic), Communication Technology (Radio-Frequency, LoRaWAN/Other LPWAN, and More), Component (Hardware, Software and Analytics, and Services), Deployment (New Installations and Retrofit/Replacement), and Geography.
Global Smart Water Meter Market Trends and Insights
Supportive Government Regulations
Mandatory deployment timelines and water-efficiency standards push utilities toward advanced metering solutions that satisfy compliance and reporting needs. The EU Drinking Water Directive requires end-to-end monitoring, prompting Germany and France to stipulate smart meters in all new constructions and major renovations. California's permanent water-use rules demand granular data for enforcement, making AMI rollouts a prerequisite for funding eligibility. Utilities gain cost recovery mechanisms when they document water-loss cuts and customer engagement improvements, which lowers investment risk and supports full-territory deployments. Vendors benefit from volume orders that reduce per-unit costs, while policymakers secure transparent performance metrics to track conservation progress. Across municipal, regional, and national levels, regulation underwrites the long-term certainty needed for widespread Smart Water Meter market adoption.
Need to Improve Water-Use Efficiency
Utilities in water-scarce regions adopt connected meters to identify high-consumption patterns and empower customers with hourly data that supports behavioral changes. Industrial facilities using continuous telemetry report 20-30% consumption cuts after pinpointing leaks and optimizing processes. Agricultural pilots that combine soil-moisture sensing with weather-based scheduling record up to 28% savings, demonstrating cross-sector utility. Efficiency gains also yield energy savings because water production and pumping constitute large operational expenses. Analytics applications forecast demand, allowing utilities to flatten peaks and defer capacity expansion. As utilities tie conservation to revenue decoupling, efficiency gains translate into stable financial performance and propel the Smart Water Meter market forward.
High Upfront Costs and Cybersecurity Risks
Full AMI rollouts cost USD 200-400 per endpoint, challenging utilities with tight capital budgets. Rate-case approvals can stretch over several years, delaying project start dates. Cybersecurity countermeasures, encryption, intrusion detection, and 24-hour monitoring raise the total project expense by an additional 15-25%. Smaller systems, especially in developing economies, often defer investments without concessional finance. High-profile cyber incidents intensify regulatory scrutiny, further elevating compliance costs. These factors collectively weigh on Smart Water Meter market growth until financing mechanisms mature and security frameworks standardize.
Other drivers and restraints analyzed in the detailed report include:
- Reducing Non-Revenue Water Losses
- Smart-City and IoT Platform Integration
- Systems-Integration Complexity
For complete list of drivers and restraints, kindly check the Table Of Contents.
Segment Analysis
Automatic Meter Reading systems accounted for 57.10% of Smart Water Meter market share in 2025, reflecting their entrenched base and cost-efficient one-way data transmission. Many utilities adopt AMR during early modernization phases because drive-by collection sharply reduces manual labor without extensive network build-out. The Smart Water Meter market size attached to AMR remains large, yet its growth moderates as second-generation rollouts favor two-way architectures.
Advanced Metering Infrastructure records an 11.55% CAGR to 2031 as utilities seek real-time leak alerts, remote disconnect, and time-variant pricing schemes. Cellular, NB-IoT, and LoRaWAN modules drop in cost, erasing a key barrier to AMI adoption. Service providers package meters, analytics, and software subscriptions, distributing capital costs over operating budgets. Data-rich AMI platforms integrate easily with conservation programs, accelerating regional penetration and widening the Smart Water Meter market.
Residential deployments formed 58.00% of the Smart Water Meter market size in 2025 after multiple European and North American mandates required smart meters for new housing. Consumers benefit from usage portals that connect conservation goals to tangible savings, sustaining stable replacement cycles.
Commercial buildings show the fastest uptake at a 11.85% CAGR, propelled by facility-management software that pairs water, energy, and HVAC data. High-rise real-estate owners justify investment through lower operating expenses and green-building certifications. Retail chains and hospitality groups apply analytics to benchmark sites, uncover concealed leaks, and optimize irrigation. As sustainability reporting frameworks tighten, enterprise users expand deployments, bolstering overall Smart Water Meter market growth.
Complete Report Scope:
- By Technology
- Automatic Meter Reading (AMR)
- Advanced Metering Infrastructure (AMI)
- By Application
- Residential
- Commercial
- Industrial
- Agricultural
- By Meter Type
- Mechanical / Turbine
- Ultrasonic
- Electromagnetic
- By Communication Technology
- Radio-frequency (Proprietary RF)
- LoRaWAN / Other LPWAN
- Cellular (NB-IoT/LTE-M)
- Wired (M-Bus/Ethernet)
- By Component
- Hardware
- Software and Analytics
- Services
- By Deployment
- New Installations
- Retrofit / Replacement
- By Geography
- North America
- United States
- Canada
- Mexico
- South America
- Brazil
- Argentina
- Chile
- Rest of South America
- Europe
- Germany
- United Kingdom
- France
- Italy
- Spain
- Rest of Europe
- Asia-Pacific
- China
- India
- Japan
- South Korea
- Malaysia
- Singapore
- Australia
- Rest of Asia-Pacific
- Middle East and Africa
- Middle East
- United Arab Emirates
- Saudi Arabia
- Turkey
- Rest of Middle East
- Africa
- South Africa
- Nigeria
- Rest of Africa
- Middle East
- North America
Geography Analysis
Europe dominated the Smart Water Meter market with 36.10% revenue share in 2025, anchored by EU directives that compel water-loss tracking and transparent billing. National implementation roadmaps guarantee steady tender pipelines, and long-term vendor frameworks streamline procurement. Utilities also tap recovery funds targeting climate resilience, accelerating district-wide AMI deployments that underpin stable regional demand.
Asia-Pacific registers the fastest expansion, clocking a 12.05% CAGR to 2031. China's extensive smart-city pilots embed metering within neighborhood digital twins, while India's Jal Jeevan Mission finances rural connections that include smart endpoints. Southeast Asian economies such as Indonesia and Vietnam upgrade legacy assets concurrently with rapid urbanization, avoiding sunk costs tied to older technologies. Government grants, multilateral loans, and public-private partnerships combine to scale installations and enlarge the Smart Water Meter market.
North America benefits from aging infrastructure replacement and statewide conservation mandates. California utilities deploy AMI to enforce per-capita usage limits and to support wildfire resilience through remote shut-off capabilities. Canada advances province-level modernization programs focusing on non-revenue water recovery, adding incremental growth. Latin America's concession tenders in Brazil signal sizable upcoming opportunities, while Middle East and Africa utilities leverage smart meters to address scarcity and reduce theft, though deployment progress varies by funding availability and communication-network readiness.
- Arad Ltd.
- Badger Meter Inc.
- Itron Inc.
- Sensus USA Inc. (Xylem Inc.)
- Kamstrup A/S
- Diehl Stiftung and Co. KG
- Zenner International GmbH and Co. KG
- Landis+Gyr Group AG
- Honeywell International Inc.
- Neptune Technology Group Inc. (Roper)
- Aclara Technologies LLC (Hubbell)
- Apator SA
- Axioma Metering
- B Meters Srl
- Datamatic Inc.
- Maddalena S.p.A.
- Suntront Tech Co., Ltd.
- Mueller Systems LLC
- Waviot
- Watertech S.p.A. (Arad)
- Jiangxi Sanchuan Water Meter Co. Ltd.
- Ningbo Water Meter Co. Ltd.
- BETAR Company
- Integra Metering AG
- IESLab Electronic Co. Ltd.
Additional Benefits:
- The market estimate (ME) sheet in Excel format
- 3 months of analyst support
TABLE OF CONTENTS
1 INTRODUCTION
- 1.1 Study Assumptions and Market Definition
- 1.2 Scope of the Study
2 RESEARCH METHODOLOGY
3 EXECUTIVE SUMMARY
4 MARKET LANDSCAPE
- 4.1 Market Overview
- 4.2 Market Drivers
- 4.2.1 Supportive government regulations
- 4.2.2 Need to improve water-use efficiency
- 4.2.3 Reducing non-revenue water (NRW) losses
- 4.2.4 Smart-city and IoT platform integration
- 4.2.5 Pay-as-you-save financing models
- 4.2.6 Drought-driven conservation mandates
- 4.3 Market Restraints
- 4.3.1 High upfront costs and cybersecurity risks
- 4.3.2 Systems-integration complexity
- 4.3.3 Shortage of utility data-analytics talent
- 4.3.4 Battery-life limits in ultrasonic units
- 4.4 Industry Value Chain Analysis
- 4.5 Regulatory Landscape
- 4.6 Technological Outlook
- 4.7 Porter's Five Forces Analysis
- 4.7.1 Bargaining Power of Suppliers
- 4.7.2 Bargaining Power of Buyers
- 4.7.3 Threat of New Entrants
- 4.7.4 Threat of Substitutes
- 4.7.5 Intensity of Competitive Rivalry
- 4.8 ROI Analysis for Smart Meters
- 4.9 Protocol Benchmarking and Comparison
- 4.10 LoRaWAN Implementation Steps and Use-cases
- 4.11 Utility Digitalisation Benefits
- 4.12 Impact of Macroeconomic Factors on the Market
5 MARKET SIZE AND GROWTH FORECASTS (VALUES)
- 5.1 By Technology
- 5.1.1 Automatic Meter Reading (AMR)
- 5.1.2 Advanced Metering Infrastructure (AMI)
- 5.2 By Application
- 5.2.1 Residential
- 5.2.2 Commercial
- 5.2.3 Industrial
- 5.2.4 Agricultural
- 5.3 By Meter Type
- 5.3.1 Mechanical / Turbine
- 5.3.2 Ultrasonic
- 5.3.3 Electromagnetic
- 5.4 By Communication Technology
- 5.4.1 Radio-frequency (Proprietary RF)
- 5.4.2 LoRaWAN / Other LPWAN
- 5.4.3 Cellular (NB-IoT/LTE-M)
- 5.4.4 Wired (M-Bus/Ethernet)
- 5.5 By Component
- 5.5.1 Hardware
- 5.5.2 Software and Analytics
- 5.5.3 Services
- 5.6 By Deployment
- 5.6.1 New Installations
- 5.6.2 Retrofit / Replacement
- 5.7 By Geography
- 5.7.1 North America
- 5.7.1.1 United States
- 5.7.1.2 Canada
- 5.7.1.3 Mexico
- 5.7.2 South America
- 5.7.2.1 Brazil
- 5.7.2.2 Argentina
- 5.7.2.3 Chile
- 5.7.2.4 Rest of South America
- 5.7.3 Europe
- 5.7.3.1 Germany
- 5.7.3.2 United Kingdom
- 5.7.3.3 France
- 5.7.3.4 Italy
- 5.7.3.5 Spain
- 5.7.3.6 Rest of Europe
- 5.7.4 Asia-Pacific
- 5.7.4.1 China
- 5.7.4.2 India
- 5.7.4.3 Japan
- 5.7.4.4 South Korea
- 5.7.4.5 Malaysia
- 5.7.4.6 Singapore
- 5.7.4.7 Australia
- 5.7.4.8 Rest of Asia-Pacific
- 5.7.5 Middle East and Africa
- 5.7.5.1 Middle East
- 5.7.5.1.1 United Arab Emirates
- 5.7.5.1.2 Saudi Arabia
- 5.7.5.1.3 Turkey
- 5.7.5.1.4 Rest of Middle East
- 5.7.5.2 Africa
- 5.7.5.2.1 South Africa
- 5.7.5.2.2 Nigeria
- 5.7.5.2.3 Rest of Africa
- 5.7.5.1 Middle East
- 5.7.1 North America
6 COMPETITIVE LANDSCAPE
- 6.1 Market Concentration
- 6.2 Strategic Moves
- 6.3 Market Share Analysis
- 6.4 Company Profiles (includes Global level Overview, Market level overview, Core Segments, Financials as available, Strategic Information, Market Rank/Share for key companies, Products and Services, and Recent Developments)
- 6.4.1 Arad Ltd.
- 6.4.2 Badger Meter Inc.
- 6.4.3 Itron Inc.
- 6.4.4 Sensus USA Inc. (Xylem Inc.)
- 6.4.5 Kamstrup A/S
- 6.4.6 Diehl Stiftung and Co. KG
- 6.4.7 Zenner International GmbH and Co. KG
- 6.4.8 Landis+Gyr Group AG
- 6.4.9 Honeywell International Inc.
- 6.4.10 Neptune Technology Group Inc. (Roper)
- 6.4.11 Aclara Technologies LLC (Hubbell)
- 6.4.12 Apator SA
- 6.4.13 Axioma Metering
- 6.4.14 B Meters Srl
- 6.4.15 Datamatic Inc.
- 6.4.16 Maddalena S.p.A.
- 6.4.17 Suntront Tech Co., Ltd.
- 6.4.18 Mueller Systems LLC
- 6.4.19 Waviot
- 6.4.20 Watertech S.p.A. (Arad)
- 6.4.21 Jiangxi Sanchuan Water Meter Co. Ltd.
- 6.4.22 Ningbo Water Meter Co. Ltd.
- 6.4.23 BETAR Company
- 6.4.24 Integra Metering AG
- 6.4.25 IESLab Electronic Co. Ltd.
7 MARKET OPPORTUNITIES AND FUTURE OUTLOOK
- 7.1 White-space and Unmet-need Assessment

 水網遙測市場規模、佔有率和成長分析:按組件、技術、應用、最終用戶、部署類型和地區分類-2026-2033年產業預測
 智慧水錶市場:按組件、通訊方式、測量技術、通訊架構、安裝類型、電源、應用和最終用戶分類-2026-2032年全球市場預測
 美國供水事業應對資料中心擴張的策略:機會、趨勢與展望歐洲和北美智慧水錶市場(第五版)
 商用智慧水錶市場-全球產業規模、佔有率、趨勢、機會、預測:按類型、應用、產品、地區和競爭格局分類,2021-2031年
 智慧水錶市場報告:按產品類型、水錶類型、配置類型、組件、應用和地區分類(2026-2034 年)
 水網遙測市場:按類型、應用和地區分類-市場規模、佔有率、前景和機會分析,2025-2032年
 智慧水錶市場機會、成長要素、產業趨勢分析及2026-2035年預測預付式智慧水錶市場:按組件、水錶類型、技術、部署模式、最終用戶和分銷管道分類——2026-2032年全球預測
 2026年全球智慧水錶市場報告