


 |
市場調查報告書
商品編碼
2121959
雲端電視:市場佔有率分析、產業趨勢和統計數據、成長預測(2026-2031 年)Cloud TV - Market Share Analysis, Industry Trends & Statistics, Growth Forecasts (2026 - 2031) |
||||||

※ 本網頁內容可能與最新版本有所差異。詳細情況請與我們聯繫。
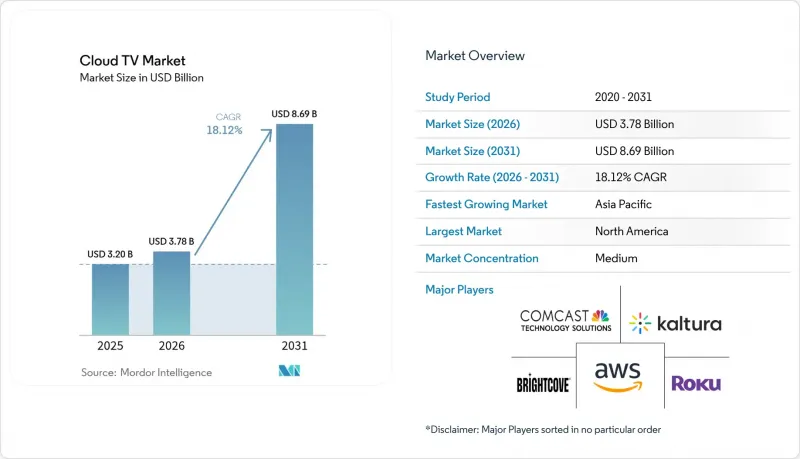
根據 Mordor Intelligence 估計,到 2026 年,雲端電視市值將達到 37.8 億美元,高於 2025 年的 32 億美元,預計到 2031 年將達到 86.9 億美元。
預計從 2026 年到 2031 年,其複合年成長率將達到 18.12%。
雲端電視市場報告按部署類型(公共雲端、私有雲端、混合雲端)、設備類型(機上盒、智慧型手機、聯網電視)、應用領域(電信、娛樂媒體等)、企業規模(中小企業、大型企業)和地區進行細分。市場預測以美元計價。
全球雲端電視市場趨勢與洞察
光纖到戶(FTTH)技術的持續部署能夠實現穩定的OTT服務傳輸。
在大多數已開發市場,光纖到府 (FTTH) 的普及率已超過 50%,確保了雲端電視市場所需的頻寬可靠性,從而實現無緩衝的 4K 和 8K 串流媒體傳輸。像 AT&T 這樣的電信公司計劃在 2025 年將光纖網路覆蓋到 3000 萬戶家庭,從而減少對高成本的邊緣快取的依賴,並促進高品質體育賽事直播的傳輸。此外,電信公司正透過捆綁不限流量的無限資料方案,並利用確定性服務品質 (QoS) 來支援互動式功能,從而推動光纖的商業化。
北美和歐洲農村地區5G固定無線存取(FWA)的快速擴展
5G固定無線存取(FWA)可提供100-200 Mbps的下行速度和低於10毫秒的延遲,將以往服務不足的農村地區轉變為極具潛力的雲端電視市場。 T-Mobile和Verizon等業者的目標是到2025年獲得400萬至500萬FWA用戶,從而在無需多年鑽井成本的情況下擴大服務覆蓋範圍。寬頻和電視休閒以及面向房車用戶的可攜式雲端電視等應用場景進一步推動了農村地區的需求。
非洲和加勒比海等新興經濟體中 CDN 部署的碎片化問題。
在非洲大部分地區,平均國內網路延遲高達78毫秒,而北美地區的延遲則低於45毫秒,這嚴重阻礙了1080p高清串流媒體的穩定傳輸。該地區約50%的網路流量需要透過海外上游供應商。 2024年西非海底光纜的故障嚴重影響了13個國家,凸顯了其脆弱性。由於缺乏本地存取點(PoP),雲端TV節目供應商被迫降低位元率,進而對使用者體驗和廣告收入造成負面影響。
細分市場分析
儘管公共雲端在2025年佔據了51.20%的收入佔有率,但隨著廣播公司追求可預測的服務品質(QoS)和靈活的突發容量,預計到2031年,混合雲配置將以20.7%的複合年成長率成長。這種配置允許版權所有擁有者在私有叢集上維護優質體育賽事檔案,同時依靠超大規模資料中心業者來處理實況活動。隨著內容擁有者最佳化工作負載以適應成本曲線並逐步淘汰老舊的本地編碼器,混合部署的雲端電視市場預計將快速成長。對監管敏感的行業,例如公共部門媒體,已經將其45%的工作流程遷移到混合節點,以實現用戶資料的本地化。在所有用例中,分階段遷移都能降低與退役舊有系統相關的風險,並確保在高峰期不間斷地覆蓋受眾。
混合部署還能解決跨境版權管理問題。營運商在靠近僑民居住的公共區域部署來源快取,同時在私有網域運行浮水印和數位版權管理 (DRM) 邏輯。供應商透過提供基於 Kubernetes 的轉碼器來解決這個問題,這些轉碼器可以靈活地在兩種環境中擴展。因此,收費模式從資本支出 (Capex) 模式轉變為基於使用量的精細化模式,中型網路營運商無需購買新的 ASIC 晶片即可試行 4K 傳輸。到 2030 年,雲端電視投資的決策架構將重點放在能源效率、碳排放揭露、主權雲端指令以及位元率經濟性。
預計到2025年,聯網電視(CTV)將佔總營收的39.30%,但智慧型手機是成長最快的終端設備,預計複合年成長率(CAGR)將達到22.9%。開放式無線存取網(Open-RAN)5G和低成本OLED面板的普及正在縮小使用者體驗差距,6.7吋螢幕上的4K HDR畫質已可媲美客廳電視。專為豎屏模式剪輯的短劇集正主導著Z世代的觀看列表,迫使出版商製作同時支持橫屏和豎屏畫面的分鏡腳本。在資料通訊流量費用降低和分期付款更換設備的推動下,預計到2027年,雲端電視在東南亞多個國家的行動端市場佔有率將超過連網電視。
跨裝置同步如今已成為必然。廣告主正利用其自研的圖形技術,在同一晚內依序在行動裝置上投放 15 秒的預告片,在連網電視 (CTV) 上投放 30 秒的詳細說明,並在平板電腦上投放可購物的疊加層。雲端編碼器供應商正在嵌入 SSAI 標記,這些標記會觸發動態產生的QR碼,以匹配螢幕大小。這種融合正在重新定義主螢幕的概念,而成功的提案將是那些能夠實現無縫過渡的方案,而非針對特定裝置的 UX 設計。
區域分析
預計到2025年,北美地區的收入將佔全球總收入的42.50%,這主要得益於高寬頻普及率、高SVOD訂閱率以及對情境廣告技術的早期應用。區域CDN節點實現了亞秒級的上線速度,提高了用戶對4K和杜比視界套餐的收費意願。然而,iOS平台不斷飆升的獲客成本(CPI)正在威脅小規模工作室的盈利,廣告支出也正轉向Android和網路管道。以沃爾瑪整合VIZIO SmartCast作業系統為例,零售媒體網路的崛起表明,擁有豐富數據的零售商可以繞過傳統廣播公司,直接向品牌銷售更多聯網電視廣告位。
亞太地區是成長最快的地區,複合年成長率高達20.6%,主要得益於5G的大規模部署、價格親民的安卓電視以及本地語言內容的推廣。印度的Cloud TV 3.0舉措新增了支援10種方言的語音助理,吸引了先前只能收看有線電視的觀眾。中國OEM廠商正在預先安裝自家的電視作業系統,這些作業系統同時也是電商平台,使設備製造商能夠獲得更大的廣告收入佔有率。在韓國,一項利用5G SA技術直播2024年亞運會8K超高清直播的試點項目,為身臨其境型直播樹立了新的標竿。所有這些因素共同推動著觀眾從地面電波電視轉向發送服務。
歐洲既充滿機會也面臨挑戰。高可支配收入推動了高階方案的普及,以斯堪地那維亞市場為例,每個光纖家庭平均使用兩個付費電視應用程式和一個雲端遊戲通行證。德國的網路切片試點計畫表明,專用頻寬可以確保AAA級雲端遊戲20毫秒的往返延遲,但各國不同的戰利箱監管規定使得歐盟範圍內的服務部署變得複雜。同時,跨國併購,例如瑞士電信收購沃達豐義大利,顯示企業正致力於將頻段、光纖骨幹網路和串流版權整合到少數幾家子公司,以期實現更廣泛的企業發展協同效應。此外,歐洲為實現淨零排放目標所做的努力正促使廣播公司將播出轉移到更環保的資料中心,這可能會加速向混合雲端的轉型。
其他好處:
- Excel格式的市場預測(ME)表
- 3個月的分析師支持
目錄
第1章:引言
- 研究假設和市場定義
- 調查範圍
第2章:調查方法
第3章執行摘要
第4章 市場狀況
- 市場概覽
- 市場促進因素
- 光纖到戶技術的持續普及使得OTT服務能夠穩定傳輸。
- 北美和歐洲遍遠地區5G固定無線存取的快速擴展
- 一級付費電視業者正在轉向雲端優先的機上盒升級。
- 亞洲地區聯網電視晶片組和雲端電視解決方案的OEM商品搭售
- FAST 頻道貨幣化模式正在加速歐洲出版商的採用。
- 為中型電信業者降低整體擁有成本的多租戶 SaaS 平台。
- 市場限制因素
- 新興非洲和加勒比地區CDN部署的碎片化
- 盜版和認證資訊共用等持續存在的問題對收入產生負面影響。
- UHD/HDR內容的初始編碼/轉碼成本很高
- 傳統 CAS/DRM 的互通性差距正在延緩小規模MSO 的遷移。
- 監理展望
- 技術展望
- 波特五力模型
第5章 市場規模與成長預測
- 按實現類型
- 公共雲端
- 私有雲端
- 混合雲端
- 依設備類型
- 聯網電視
- 智慧型手機
- 機上盒(STB)
- 透過使用
- 娛樂媒體
- 溝通
- 資訊科技
- 家庭電視
- 其他
- 按組織規模
- 大公司
- 小型企業
- 按地區
- 北美洲
- 美國
- 加拿大
- 南美洲
- 巴西
- 阿根廷
- 墨西哥
- 其他拉丁美洲國家
- 歐洲
- 德國
- 英國
- 法國
- 義大利
- 西班牙
- 其他歐洲國家
- 亞太地區
- 中國
- 日本
- 韓國
- 印度
- 澳洲
- 紐西蘭
- 其他亞太國家
- 中東和非洲
- 阿拉伯聯合大公國
- 沙烏地阿拉伯
- 南非
- 其他中東和非洲國家
- 北美洲
第6章 競爭情勢
- Strategic Developments
- Vendor Positioning Analysis
- 公司簡介
- Brightcove Inc.
- Kaltura Inc.
- Ooyala Inc.
- Amino Technologies PLC
- DaCast LLC
- MatrixStream Technologies Inc.
- PCCW Ltd.
- Liberty Global PLC
- Charter Communications(Spectrum)
- Roku Inc.
- Comcast Technology Solutions
- Amazon Web Services
- Google(YouTube TV)
- Apple Inc.(tvOS Services)
- Netflix Inc.
- MUVI LLC
- UpLynk LLC
- Minoto Video Inc.
- Monetize Media Inc.
- Fordela Corp.
- Wowza Media Systems
- Edgecast(Edgio)
- Tencent Cloud
- Huawei Cloud
- Akamai Technologies
第7章 市場機會與未來展望
According to Mordor Intelligence, cloud TV market size in 2026 is estimated at USD 3.78 billion, growing from 2025 value of USD 3.20 billion with 2031 projections showing USD 8.69 billion, growing at 18.12% CAGR over 2026-2031.
Cloud TV Market Report is Segment by Deployment (Public Cloud, Private Cloud, Hybrid Cloud), Device Type (STB, Mobile Phones, Connected TV), Applications (Telecom, Entertainment and Media, and More), Organization Size (Small and Medium Enterprises, Large Enterprises), and Geography. The Market Forecasts are Provided in Terms of Value (USD).
Global Cloud TV Market Trends and Insights
Continued Fiber-to-Home Roll-outs Enabling Stable OTT Delivery
FTTH penetration has surpassed 50% in most developed markets, creating the bandwidth reliability the Cloud TV market needs for unbuffered 4K and 8K streams. Carriers such as AT&T are allocating USD 15 billion through 2025 to extend fiber to 30 million premises, which lowers reliance on costly edge caches and fosters premium live sports streaming. Operators further monetize fiber by bundling unlimited data tiers that remove bitrate ceilings and by leveraging deterministic QoS to support interactive features.
Rapid Expansion of 5G Fixed Wireless Access in Rural North America and Europe
5G FWA provides 100-200 Mbps downlinks at sub-10 millisecond latencies, turning previously underserved rural zones into viable Cloud TV market addresses. Operators, including T-Mobile and Verizon, aim to sign 4-5 million FWA subscribers by 2025, accelerating service reach without multi-year trenching costs. Bundled broadband-plus-TV plans and portable cloud-TV use cases for RV owners further inflate rural demand.
Fragmented CDN Footprint in Emerging Africa and Caribbean Islands
Average in-country latency hits 78 milliseconds across much of Africa versus sub-45 milliseconds in North America, limiting consistent 1080p streaming. Roughly 50% of the region's internet traffic transits foreign upstream providers; outages on West African submarine cables in 2024 crippled 13 nations, highlighting fragility. Without local PoPs, Cloud TV service providers must downshift bitrates, impairing the quality of experience and ad yields.
Other drivers and restraints analyzed in the detailed report include:
- Tier-1 Pay-TV Operators' Shift to Cloud-First STB Replacement
- OEM Bundling of Cloud-TV Solutions with Connected-TV Chipsets in Asia
- Persistent Piracy and Credential-Sharing Impacting Revenue Assurance
For complete list of drivers and restraints, kindly check the Table Of Contents.
Segment Analysis
Public cloud held 51.20% of revenue in 2025, yet hybrid configurations are set to grow at a 20.7% CAGR to 2031 as broadcasters pursue flexible burst capacity alongside predictable QoS. This mix lets rights-holders keep premium sports archives in private clusters while relying on hyperscalers for live-event traffic. The Cloud TV market size for hybrid deployments is projected to accelerate as content owners map workloads to cost curves and exit ageing on-prem encoders. Regulatory-sensitive verticals such as public-sector media have already moved 45% of workflows to hybrid nodes to localise user data. Across use-cases, phased migrations de-risk legacy decommissioning, supporting uninterrupted audience reach during peak seasons.
Hybrid adoption also solves cross-border rights management: operators deploy origin caches in public regions close to diaspora populations while watermarking and DRM logic run in private domains. Vendors have responded with Kubernetes-based transcoders that elastically scale across both footprints. As a result, billing shifts from capex to granular usage, letting mid-tier networks test 4K distribution without buying new ASICs. By 2030, decision frameworks for cloud TV investment will weigh energy efficiency, carbon disclosure, and sovereign-cloud mandates as heavily as bitrate economics.
Connected TVs (CTV) delivered 39.30% of 2025 revenue, yet smartphones are the fastest-growing end-point with a 22.9% CAGR forecast. Open-RAN 5G plus cheaper OLED panels have blurred the experiential gap so that 4K HDR on a 6.7-inch screen rivals lounge-room sets. Short-form series cut for vertical orientation dominate Gen-Z watchlists, forcing publishers to storyboard concurrently for tall and wide frames. The Cloud TV market share of mobile usage is expected to overtake CTVs in several Southeast Asian countries by 2027, powered by lower data tariffs and instalment-plan handset upgrades.
Multi-device sync is now table-stakes: advertisers use household graph technology to sequence a 15-second teaser on mobile, a 30-second deep-dive on CTV, and a shoppable overlay on tablet within the same evening. Cloud encoder vendors embed SSAI markers that cue dynamic QR codes aligned with active screen size. Such convergence recasts the notion of a primary screen; the winning proposition will offer frictionless hand-off rather than device-specific UX.
Complete Report Scope:
- By Deployment
- Public Cloud
- Private Cloud
- Hybrid Cloud
- By Device Type
- Connected TV
- Mobile Phones
- Set-Top Box (STB)
- By Application
- Entertainment and Media
- Telecom
- Information Technology
- Consumer Television
- Other Applications
- By Organisation Size
- Large Enterprise
- Small and Medium Enterprise
- By Geography
- North America
- United States
- Canada
- South America
- Brazil
- Argentina
- Mexico
- Rest of Latin America
- Europe
- Germany
- United Kingdom
- France
- Italy
- Spain
- Rest of Europe
- Asia-Pacific
- China
- Japan
- South Korea
- India
- Australia
- New Zealand
- Rest of Asia-Pacific
- Middle East and Africa
- United Arab Emirates
- Saudi Arabia
- South Africa
- Rest of Middle East and Africa
- North America
Geography Analysis
North America held 42.50% of 2025 revenue owing to mature broadband penetration, high SVOD stacking, and early adoption of contextual ad tech. Regional CDN nodes deliver sub-second start-up times, reinforcing willingness to pay for 4K and Dolby Vision tiers. Yet elevated iOS CPI threatens smaller studios' profitability, nudging spend toward Android and web channels. The emergence of retail media networks, exemplified by Walmart's integration of VIZIO's SmartCast OS, demonstrates how data-rich retailers can bypass traditional broadcasters and sell incremental connected-TV inventory directly to brands .
Asia-Pacific is the fastest-growing region at a 20.6% CAGR, propelled by mass 5G roll-out, affordable Android TVs, and regional language curation. India's Cloud TV 3.0 initiative adds voice assistants in 10 dialects, unlocking audiences previously tied to cable. Chinese OEMs preload proprietary TV operating systems that double as commerce gateways, giving device brands a bigger revenue share from advertising. South Korea piloted 8K livestreams of the 2024 Asian Games over 5G SA, setting a benchmark for immersive broadcasting. Collectively, these factors speed viewer migration from terrestrial TV to IP-delivered services.
Europe presents a patchwork of opportunities and constraints. High disposable income supports premium bundle uptake, as seen in Scandinavian markets where fibre households average two paid TV apps plus one cloud gaming pass. Network-slicing pilots in Germany prove that dedicated bandwidth can guarantee 20 ms round-trip for AAA cloud titles, yet country-specific loot-box rules complicate pan-EU launches. At the same time, cross-border M&A such as Swisscom's acquisition of Vodafone Italia signals a drive to consolidate spectrum, fibre backbones, and streaming rights under fewer umbrellas, promising broader footprint synergies swisscom.com. Europe's net-zero commitments are prompting broadcasters to move playout into greener data centres, potentially accelerating hybrid-cloud migrations.
- Brightcove Inc.
- Kaltura Inc.
- Ooyala Inc.
- Amino Technologies PLC
- DaCast LLC
- MatrixStream Technologies Inc.
- PCCW Ltd.
- Liberty Global PLC
- Charter Communications (Spectrum)
- Roku Inc.
- Comcast Technology Solutions
- Amazon Web Services
- Google (YouTube TV)
- Apple Inc. (tvOS Services)
- Netflix Inc.
- MUVI LLC
- UpLynk LLC
- Minoto Video Inc.
- Monetize Media Inc.
- Fordela Corp.
- Wowza Media Systems
- Edgecast (Edgio)
- Tencent Cloud
- Huawei Cloud
- Akamai Technologies
Additional Benefits:
- The market estimate (ME) sheet in Excel format
- 3 months of analyst support
TABLE OF CONTENTS
1 INTRODUCTION
- 1.1 Study Assumptions and Market Definition
- 1.2 Scope of the Study
2 RESEARCH METHODOLOGY
3 EXECUTIVE SUMMARY
4 MARKET LANDSCAPE
- 4.1 Market Overview
- 4.2 Market Drivers
- 4.2.1 Continued Fiber-to-Home Roll-outs Enabling Stable OTT Delivery
- 4.2.2 Rapid Expansion of 5G Fixed Wireless Access in Rural North America and Europe
- 4.2.3 Tier-1 Pay-TV Operators' Shift to "Cloud-first" STB Replacement
- 4.2.4 OEM Bundling of Cloud-TV Solutions with Connected-TV Chipsets in Asia
- 4.2.5 FAST Channel Monetisation Models Accelerating Publisher Adoption in Europe
- 4.2.6 Multi-tenant SaaS Platforms Reducing TCO for Mid-tier Operators
- 4.3 Market Restraints
- 4.3.1 Fragmented CDN Footprint in Emerging Africa and Caribbean Islands
- 4.3.2 Persistent Piracy and Credential-Sharing Impacting Revenue Assurance
- 4.3.3 High Initial Encoding/Transcoding Costs for UHD/HDR Content
- 4.3.4 Legacy CAS/DRM Interoperability Gaps Slowing Migration for Small MSOs
- 4.4 Regulatory Outlook
- 4.5 Technological Outlook
- 4.6 Porters Five Forces
- 4.6.1 Bargaining Power of Suppliers
- 4.6.2 Bargaining Power of Consumers
- 4.6.3 Threat of New Entrants
- 4.6.4 Intensity of Competitive Rivalry
- 4.6.5 Threat of Substitute Products
5 MARKET SIZE AND GROWTH FORECASTS (VALUE)
- 5.1 By Deployment
- 5.1.1 Public Cloud
- 5.1.2 Private Cloud
- 5.1.3 Hybrid Cloud
- 5.2 By Device Type
- 5.2.1 Connected TV
- 5.2.2 Mobile Phones
- 5.2.3 Set-Top Box (STB)
- 5.3 By Application
- 5.3.1 Entertainment and Media
- 5.3.2 Telecom
- 5.3.3 Information Technology
- 5.3.4 Consumer Television
- 5.3.5 Other Applications
- 5.4 By Organisation Size
- 5.4.1 Large Enterprise
- 5.4.2 Small and Medium Enterprise
- 5.5 By Geography
- 5.5.1 North America
- 5.5.1.1 United States
- 5.5.1.2 Canada
- 5.5.2 South America
- 5.5.2.1 Brazil
- 5.5.2.2 Argentina
- 5.5.2.3 Mexico
- 5.5.2.4 Rest of Latin America
- 5.5.3 Europe
- 5.5.3.1 Germany
- 5.5.3.2 United Kingdom
- 5.5.3.3 France
- 5.5.3.4 Italy
- 5.5.3.5 Spain
- 5.5.3.6 Rest of Europe
- 5.5.4 Asia-Pacific
- 5.5.4.1 China
- 5.5.4.2 Japan
- 5.5.4.3 South Korea
- 5.5.4.4 India
- 5.5.4.5 Australia
- 5.5.4.6 New Zealand
- 5.5.4.7 Rest of Asia-Pacific
- 5.5.5 Middle East and Africa
- 5.5.5.1 United Arab Emirates
- 5.5.5.2 Saudi Arabia
- 5.5.5.3 South Africa
- 5.5.5.4 Rest of Middle East and Africa
- 5.5.1 North America
6 COMPETITIVE LANDSCAPE
- 6.1 Strategic Developments
- 6.2 Vendor Positioning Analysis
- 6.3 Company Profiles (includes Global level Overview, Market level overview, Core Segments, Financials as available, Strategic Information, Products and Services, and Recent Developments)
- 6.3.1 Brightcove Inc.
- 6.3.2 Kaltura Inc.
- 6.3.3 Ooyala Inc.
- 6.3.4 Amino Technologies PLC
- 6.3.5 DaCast LLC
- 6.3.6 MatrixStream Technologies Inc.
- 6.3.7 PCCW Ltd.
- 6.3.8 Liberty Global PLC
- 6.3.9 Charter Communications (Spectrum)
- 6.3.10 Roku Inc.
- 6.3.11 Comcast Technology Solutions
- 6.3.12 Amazon Web Services
- 6.3.13 Google (YouTube TV)
- 6.3.14 Apple Inc. (tvOS Services)
- 6.3.15 Netflix Inc.
- 6.3.16 MUVI LLC
- 6.3.17 UpLynk LLC
- 6.3.18 Minoto Video Inc.
- 6.3.19 Monetize Media Inc.
- 6.3.20 Fordela Corp.
- 6.3.21 Wowza Media Systems
- 6.3.22 Edgecast (Edgio)
- 6.3.23 Tencent Cloud
- 6.3.24 Huawei Cloud
- 6.3.25 Akamai Technologies
7 MARKET OPPORTUNITIES AND FUTURE OUTLOOK
- 7.1 White-space and Unmet-Need Assessment

 雲端電視全球市場規模、佔有率、趨勢和成長分析報告(2026-2034)
 雲端電視市場-2026-2032年全球市場預測社群電視市場:2026-2032年全球市場預測(依內容類型、功能、應用程式、發行管道及最終用戶分類)
 社交電視:市場佔有率分析、產業趨勢與統計、成長預測(2026-2031)
 雲端電視市場:依技術、內容類型、設備類型和地區分類
 2026年全像電視市場報告2026年全球雲端電視市場報告
 雲端電視市場規模、佔有率和成長分析(按部署類型、組織規模、應用程式、最終用戶和地區分類)-2026-2033年產業預測
 全球雲端電視市場全球社交電視市場:2025 年至 2030 年預測