


 |
市場調查報告書
商品編碼
2121952
網路附加儲存 (NAS):市場佔有率分析、產業趨勢和統計數據以及成長預測 (2026-2031)Network Attached Storage (NAS) - Market Share Analysis, Industry Trends & Statistics, Growth Forecasts (2026 - 2031) |
||||||

※ 本網頁內容可能與最新版本有所差異。詳細情況請與我們聯繫。
據 Mordor Intelligence 稱,網路附加儲存 (NAS) 市場在 2025 年的價值為 396.2 億美元,預計到 2031 年將達到 1012.4 億美元,而 2026 年為 463.2 億美元,預測期(2026-2031 年)的複合年成長率為 193%。
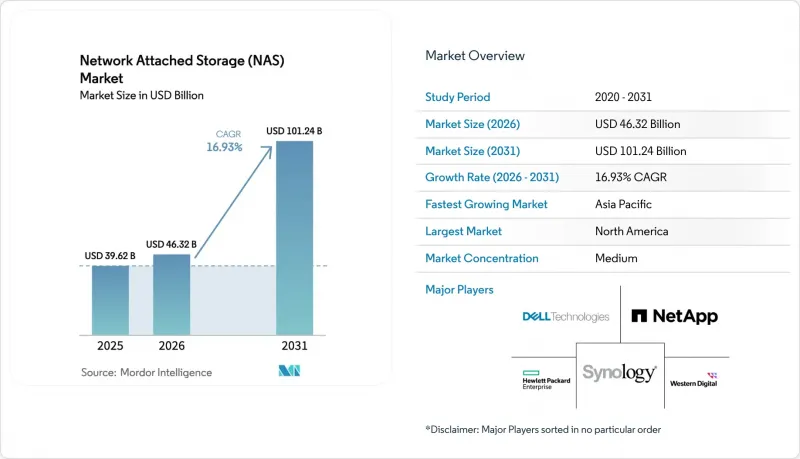
本報告按類型(縱向擴展、橫向擴展)、最終用戶行業(銀行、金融服務和保險 (BFSI)、IT 和電信、醫療保健、零售和電子商務、媒體和娛樂、政府和公共部門等)、部署方式(本地部署、雲端部署、混合部署)、產品類別(高階/企業級、中端市場、低階/小型辦公室/家庭辦公室 (SOHO))以及地區進行細分。市場預測以美元 (USD) 為單位。
全球網路附加儲存 (NAS) 市場趨勢與洞察
非結構化資料的爆炸性成長
目前,高達 80% 的企業資料以非結構化格式生成,且年成長率接近 50%,這使得檔案式的平台容量擴展成為迫切需求。視訊監控、物聯網遙測和協作內容的成長使傳統的縱向擴展控制器不堪重負,促使用戶遷移到可擴展集群,以便在不中斷服務的情況下添加節點。同時,資料湖專案正從以備份為中心轉向以分析為中心,利用 NAS 直接查詢,而不是將其暫時儲存在資料倉儲中。諸如證券經紀公司適用的 SEC 17a-4 法規等法律文件保留規定,正在延長本地儲存的生命週期。這是因為將資料儲存在物件儲存中非常複雜,再加上雲端資料傳輸成本和司法管轄風險。同樣,零售商正在將 POS 日誌和全通路交易記錄整合到去重後的 NAS 卷中,將Petabyte級資料壓縮成更易於管理的大小。
遠距和混合辦公模式導致資料量激增
混合辦公模式的廣泛普及使用戶主目錄的創建速度加倍,增加了分店的儲存流量,並推動了對邊緣NAS設備的需求,這些設備可以將檔案快取到更靠近用戶的位置。整合VPN的NAS設備透過與核心資料中心進行夜間同步,可將廣域網路頻寬需求降低40%以上。 2025年遠距遠端醫療的引入將導致病患記錄的持續上傳,醫院正在將這些記錄儲存在符合HIPAA標準的設備上,以維護基於角色的存取控制和防篡改日誌記錄。大學已將講座影片遷移到本地陣列,因為他們發現從雲端傳輸視訊存檔會產生每GB 0.09美元的出站費用,這在幾Terabyte的規模下是不永續的。
雲端儲存替代方案
超大規模資料中心業者物件儲存相比NAS在冷歸檔方面具有成本優勢,一些團隊已經開始將備份卷遷移到付費使用制的儲存桶中。然而,每Petabyte約9萬美元的出站費用阻礙了資料檢索,將資料困在雲端孤島中,並使需要本地接近性的分析變得複雜。媒體工作室在編輯4K母帶時就遇到了這個問題,許多工作室的應對方案是部署混合設備,將舊素材分層存儲到Glacier或其他歸檔類別中,同時將熱門內容保留在本地。
細分市場分析
預計到2025年,橫向擴展平台將佔網路附加儲存 (NAS) 市場收入的53.81%,並在2031年之前以17.33%的複合年成長率成長。其節點級可擴展性使負責人能夠調整容量和吞吐量,以應對人工智慧訓練中不可預測的激增,GPU叢集的總頻寬可達200 GB/s。因此,隨著標準 NFS 和 SMB 協定簡化了應用程式整合,橫向擴展叢集正日益取代 Hadoop 分散式檔案系統 (HDFS) 部署。雖然縱向擴展系統在中型企業中仍佔有一席之地,這些企業更注重易於管理而非Petabyte級擴展,但一旦文件數量超過 1 億會話,控制器處理能力的局限性就會顯現出來。
在1萬美元以下的價位區間,可擴展儲存設備依然頗具吸引力,其中群暉(Synology)和威聯通(QNAP)的產品在小規模部門市場佔據主導地位。然而,隨著客戶端數量的增加,雙控制器架構會面臨CPU和記憶體瓶頸,限制了其在超大規模人工智慧環境中的實用性。因此,面向可擴展平台的網路附加儲存(NAS)市場規模的成長速度預計將低於16.93%的整體成長率。
醫療保健產業正以18.47%的複合年成長率推動成長,這主要得益於每日新增的TerabyteDICOM掃描資料和基因組序列。電子健康記錄(EHR)供應商正直接與NAS陣列整合,從而提升了對符合HIPAA和GDPR標準的本地文件儲存的需求。 IT和電信公司預計將在2025年佔據28.61%的NAS市場佔有率,它們是虛擬化領域的先驅,並且仍然是最大的支出方,儘管隨著市場日趨成熟,它們的成長速度正在放緩。
銀行、金融和保險 (BFSI) 行業的企業依賴防篡改的 NAS 歸檔來儲存受監管的通訊日誌,而零售和電子商務企業則利用去重技術高效儲存全通路的文字記錄。媒體工作室正在推動全快閃 NAS 的普及,以滿足大規模平行工作流程的需求。同時,受國內數據管理和預測性維護等因素的驅動,政府、教育和製造業預計將實現溫和成長。受醫療保健工作負載的推動,網路附加儲存 (NAS) 市場預計到 2031 年將超過 200 億美元。
區域分析
預計到2025年,北美將佔網路附加儲存(NAS)市場收入的39.66%。這主要得益於超大規模資料中心業者資料中心超過1,200億美元的投資,以及強制要求本地儲存必須具備防篡改功能的法規。美國聯邦機構正在部署透過FedRAMP認證的空氣間隙設備來處理敏感工作負載,而加拿大銀行則依賴本地陣列來避免跨境違反《個人資訊保護法》(PIPEDA)。墨西哥的汽車工廠正在部署邊緣NAS節點,以實現即時品質檢測,而無需承受雲端的延遲。
亞太地區是成長最快的地區,複合年成長率高達17.91%,這主要得益於中國500億美元的資料中心建設投資以及印度的「數位居住」計畫。對於日本的自動駕駛汽車示範計畫和韓國的5G邊緣部署而言,低於10毫秒的小型資料庫至關重要,這也推動了對高性能設備的需求。在印度,與HIPAA類似的醫療保健法規鼓勵醫院採用自主NAS叢集,從而擴大了該地區在網路附加儲存(NAS)市場的佔有率。
在歐洲,混合部署正被廣泛採用,以滿足GDPR和DORA的要求,這些要求使得多區域雲端架構變得複雜。在德國的工業4.0工廠中,感測器遙測資料儲存在本地,用於預測分析;而在英國,MiFID II法規延長了磁帶更換週期,從而節省了NAS歸檔的預算。在法國,強制性的HDS確保患者資料保留在經過認證的本地基礎設施中,進一步促進了設備的銷售。
在中東和非洲,受大型智慧大型企劃的推動,預計將實現兩位數成長。沙烏地阿拉伯的「2030願景」計畫正在支援NEOM城市大規模部署邊緣NAS,用於快取來自數萬個攝影機的8K影像串流。阿拉伯聯合大公國的零售商正在購物中心內建立類似的架構,而以色列則正在部署用於國防分析的空氣間隙叢集。南非的金融業和埃及的市政IT部門也在增加投資,以確保符合資料保護法,但電網不穩定阻礙了全部區域的廣泛應用。
其他好處:
- Excel格式的市場預測(ME)表
- 3個月的分析師支持
目錄
第1章:引言
- 研究假設和市場定義
- 調查範圍
第2章:調查方法
第3章執行摘要
第4章 市場狀況
- 市場概覽
- 市場促進因素
- 非結構化資料的爆炸性成長
- 遠距辦公和混合辦公的數據正在激增。
- 資料中心虛擬化與軟體定義NAS
- AI/ML訓練工作負載需要並行檔案存取。
- 5G邊緣網路的擴展將促進本地NAS的發展。
- 關稅導致NAS產品在國內恢復生產
- 市場限制因素
- 雲端儲存的替代方案
- Petabyte級性能瓶頸
- 本地檔案系統網路保險費上漲
- 都市區資料中心功率密度的上限
- 產業價值鏈分析
- 監理情勢
- 技術展望
- 宏觀經濟因素對市場的影響
- 波特五力分析
第5章 市場規模與成長預測
- 按類型
- 擴大規模
- 橫向擴展
- 按最終用戶行業分類
- BFSI
- 資訊科技/通訊
- 醫療保健
- 零售與電子商務
- 媒體與娛樂
- 政府/公共部門
- 教育/製造業
- 其他
- 不同的發展
- 現場
- 雲
- 混合
- 按產品類別
- 高階/企業級
- 中端市場
- 低階/小型辦公室
- 按地區
- 北美洲
- 美國
- 加拿大
- 墨西哥
- 南美洲
- 巴西
- 阿根廷
- 其他南美國家
- 歐洲
- 英國
- 德國
- 法國
- 義大利
- 西班牙
- 其他歐洲國家
- 亞太地區
- 中國
- 日本
- 印度
- 韓國
- 其他亞太國家
- 中東和非洲
- 中東
- 以色列
- 沙烏地阿拉伯
- 阿拉伯聯合大公國
- 土耳其
- 其他中東國家
- 非洲
- 南非
- 埃及
- 其他非洲國家
- 中東
- 北美洲
第6章 競爭情勢
- 市場集中度
- 策略趨勢
- 市佔率分析
- 公司簡介
- Dell Technologies Inc.
- NetApp Inc.
- Hewlett Packard Enterprise Co.
- Synology Inc.
- Western Digital Corp.
- Seagate Technology Holdings PLC
- QNAP Systems Inc.
- IBM Corp.
- Hitachi Vantara LLC
- Cisco Systems Inc.
- Huawei Technologies Co. Ltd.
- Lenovo Group Ltd.
- Super Micro Computer Inc.
- Buffalo Inc.
- Zyxel Communications Corp.
- Asustor Inc.
- TerraMaster Technology Co. Ltd.
- Thecus Technology Corp.
- Promise Technology Inc.
- Infortrend Technology Inc.
- Netgear Inc.
- Pure Storage Inc.
- Fujitsu Ltd.
- NEC Corp.
第7章 市場機會與未來展望
According to Mordor Intelligence, the network attached storage market size was valued at USD 39.62 billion in 2025 and is estimated to grow from USD 46.32 billion in 2026 to reach USD 101.24 billion by 2031, at a CAGR of 16.93% during the forecast period (2026-2031).
This report is Segmented by Type (Scale-Up, and Scale-Out), End-User Industry (BFSI, IT and Telecom, Healthcare, Retail and E-Commerce, Media and Entertainment, Government and Public Sector, and More), Deployment (On-Premise, Cloud, and Hybrid), Product Tier (High-End/Enterprise, Mid-Market, and Low-End/SOHO), and Geography. The Market Forecasts are Provided in Terms of Value (USD).
Global Network Attached Storage (NAS) Market Trends and Insights
Explosion of Unstructured Data
Up to 80% of enterprise information now arrives in unstructured form, and annual growth rates near 50% drive urgent capacity expansion on file-based platforms. Video surveillance, IoT telemetry, and collaborative content overwhelm legacy scale-up controllers, pushing buyers toward scalable clusters that add nodes without disrupting service. A parallel shift replaces backup-centric thinking with analytics-centric strategies, as data-lake projects rely on NAS to query files directly instead of staging them in data warehouses. Regulatory file-retention rules, such as SEC 17a-4 for broker-dealers, prolong on-premise storage lifecycles because cloud egress costs and jurisdictional risks complicate retention in object stores. Retailers likewise consolidate point-of-sale logs and omnichannel transcripts onto deduplicated NAS volumes that compress petabyte estates into affordable footprints.
Remote and Hybrid-Work Data Surge
Permanent hybrid work doubled home-directory creation rates, magnifying branch-office storage traffic and fueling demand for edge-NAS appliances that cache files close to users. VPN-integrated NAS devices synchronize with core data centers overnight, cutting WAN bandwidth needs by more than 40%. Telehealth rollouts during 2025 generated persistent uploads of consultation recordings that hospitals store on HIPAA-compliant appliances, maintaining role-based access and immutable logs. Universities moved lecture videos onto local arrays after discovering that streaming archives from cloud regions incurred USD 0.09 per gigabyte in egress fees, a cost unsustainable at multi-terabyte scales.
Cloud-Storage Substitution
Hyperscaler object stores undercut NAS for cold archives, prompting some teams to offload backup volumes to pay-as-you-go buckets. However, egress charges near USD 90,000 per petabyte discourage retrieval, locking data in cloud silos and complicating analytics that require local proximity. Media studios confronted this when editing 4K masters, and many responded by adopting hybrid appliances that pin hot content on-site while tiering aged assets to Glacier or Archive classes.
Other drivers and restraints analyzed in the detailed report include:
- Data-Center Virtualization And Software-Defined NAS
- AI/ML Training Workloads Need Parallel File Access
- Performance Bottlenecks at Petabyte Scale
For complete list of drivers and restraints, kindly check the Table Of Contents.
Segment Analysis
Scale-out platforms captured 53.81% of 2025 revenue in the network attached storage market and will grow at a 17.33% CAGR through 2031. Their node-level elasticity lets operators align capacity and throughput with unpredictable AI training surges, enabling 200 GB/s aggregate bandwidth for GPU clusters. In turn, scale-out clusters often replace Hadoop Distributed File System deployments because standard NFS and SMB simplify application integration. Scale-up systems maintain a foothold among midsize firms that prize management simplicity over petabyte ambitions, but controller ceilings appear once file counts push beyond 100 million sessions.
Scale-up appliances remain attractive at price points below USD 10,000, dominated by Synology and QNAP units that address small departments. Yet their dual-controller architectures face CPU and RAM bottlenecks as clients proliferate, limiting viability in hyperscale AI environments. Consequently, the network attached storage market size for scale-up platforms is likely to expand more slowly than the overall 16.93% pace.
Healthcare leads growth at an 18.47% CAGR, driven by daily ingestion of terabytes of DICOM scans and genomic sequences. Electronic-health-record vendors integrate directly with NAS arrays, reinforcing demand for on-premise file stores that satisfy HIPAA and GDPR. IT and telecom firms, which held 28.61% network attached storage market share in 2025, spearheaded early virtualization and remain the largest spender, but maturation tempers their expansion rate.
BFSI players rely on tamper-proof NAS archives for regulatory communication logs, while retail and e-commerce operators use deduplication to store omnichannel transcripts efficiently. Media studios sustain heavy parallel-workflow demands, pushing all-flash NAS adoption, whereas government, education, and manufacturing accelerate modestly on sovereign-data and predictive-maintenance drivers. The network attached storage market size attributable to healthcare workloads is projected to eclipse USD 20 billion by 2031.
Complete Report Scope:
- By Type
- Scale-Up
- Scale-Out
- By End-User Industry
- BFSI
- IT and Telecom
- Healthcare
- Retail and E-Commerce
- Media and Entertainment
- Government and Public Sector
- Education and Manufacturing
- Other End-User Industries
- By Deployment
- On-Premise
- Cloud
- Hybrid
- By Product Tier
- High-End / Enterprise
- Mid-Market
- Low-End / SOHO
- By Geography
- North America
- United States
- Canada
- Mexico
- South America
- Brazil
- Argentina
- Rest of South America
- Europe
- United Kingdom
- Germany
- France
- Italy
- Spain
- Rest of Europe
- Asia-Pacific
- China
- Japan
- India
- South Korea
- Rest of Asia-Pacific
- Middle East and Africa
- Middle East
- Israel
- Saudi Arabia
- United Arab Emirates
- Turkey
- Rest of Middle East
- Africa
- South Africa
- Egypt
- Rest of Africa
- Middle East
- North America
Geography Analysis
North America accounted for 39.66% of network attached storage market revenue in 2025, supported by USD 120 billion-plus hyperscaler data-center spending and regulations that mandate tamper-proof on-premise storage. U.S. federal agencies deploy FedRAMP-authorized, air-gapped appliances for classified workloads, while Canadian banks rely on local arrays to avoid cross-border PIPEDA conflicts. Mexico's automotive factories add edge-NAS nodes that perform real-time quality inspections without cloud latency.
Asia-Pacific is the fastest-growing region at 17.91% CAGR, propelled by China's USD 50 billion data-center build-out and India's Digital India residency rules. Japanese autonomous-vehicle pilots and South Korean 5G edge rollouts depend on sub-10 ms local storage, catalyzing demand for ruggedized appliances. In India, HIPAA-equivalent health regulations steer hospitals toward sovereign NAS clusters, boosting the region's share of the network attached storage market.
Europe embraces hybrid deployments to navigate GDPR and DORA requirements that complicate multi-region cloud architectures. German Industry 4.0 plants store sensor telemetry locally for predictive analytics, while the United Kingdom's MiFID II rules extend tape-replacement cycles and sustain archive NAS budgets. France's HDS mandate keeps patient data inside certified on-premise infrastructure, driving further appliance sales.
Middle East and Africa experience double-digit growth on the back of smart-city mega-projects. Saudi Arabia's Vision 2030 funding underwrites NEOM's massive edge-NAS rollout, caching 8K video feeds at tens of thousands of cameras. UAE retailers replicate similar architectures inside malls, and Israel deploys air-gapped clusters for defense analytics. South African finance and Egyptian municipal IT likewise invest to comply with data-protection statutes, although unreliable power grids impede broader adoption across sub-Saharan regions.
- Dell Technologies Inc.
- NetApp Inc.
- Hewlett Packard Enterprise Co.
- Synology Inc.
- Western Digital Corp.
- Seagate Technology Holdings PLC
- QNAP Systems Inc.
- IBM Corp.
- Hitachi Vantara LLC
- Cisco Systems Inc.
- Huawei Technologies Co. Ltd.
- Lenovo Group Ltd.
- Super Micro Computer Inc.
- Buffalo Inc.
- Zyxel Communications Corp.
- Asustor Inc.
- TerraMaster Technology Co. Ltd.
- Thecus Technology Corp.
- Promise Technology Inc.
- Infortrend Technology Inc.
- Netgear Inc.
- Pure Storage Inc.
- Fujitsu Ltd.
- NEC Corp.
Additional Benefits:
- The market estimate (ME) sheet in Excel format
- 3 months of analyst support
TABLE OF CONTENTS
1 INTRODUCTION
- 1.1 Study Assumptions and Market Definition
- 1.2 Scope of the Study
2 RESEARCH METHODOLOGY
3 EXECUTIVE SUMMARY
4 MARKET LANDSCAPE
- 4.1 Market Overview
- 4.2 Market Drivers
- 4.2.1 Explosion of Unstructured Data
- 4.2.2 Remote and Hybrid-Work Data Surge
- 4.2.3 Data-Center Virtualization and Software-Defined NAS
- 4.2.4 AI/ML Training Workloads Need Parallel File Access
- 4.2.5 5G Edge Build-Out Boosts On-Prem NAS
- 4.2.6 Tariff-Driven Reshoring of NAS Production
- 4.3 Market Restraints
- 4.3.1 Cloud-Storage Substitution
- 4.3.2 Performance Bottlenecks at Petabyte Scale
- 4.3.3 Rising Cyber-Insurance Premiums for On-Prem File Systems
- 4.3.4 Power-Density Caps in Urban Data Centers
- 4.4 Industry Value Chain Analysis
- 4.5 Regulatory Landscape
- 4.6 Technological Outlook
- 4.7 Impact of Macroeconomic Factors on the Market
- 4.8 Porter's Five Forces Analysis
- 4.8.1 Bargaining Power of Suppliers
- 4.8.2 Bargaining Power of Buyers
- 4.8.3 Threat of New Entrants
- 4.8.4 Threat of Substitutes
- 4.8.5 Intensity of Competitive Rivalry
5 MARKET SIZE AND GROWTH FORECASTS (VALUE)
- 5.1 By Type
- 5.1.1 Scale-Up
- 5.1.2 Scale-Out
- 5.2 By End-User Industry
- 5.2.1 BFSI
- 5.2.2 IT and Telecom
- 5.2.3 Healthcare
- 5.2.4 Retail and E-Commerce
- 5.2.5 Media and Entertainment
- 5.2.6 Government and Public Sector
- 5.2.7 Education and Manufacturing
- 5.2.8 Other End-User Industries
- 5.3 By Deployment
- 5.3.1 On-Premise
- 5.3.2 Cloud
- 5.3.3 Hybrid
- 5.4 By Product Tier
- 5.4.1 High-End / Enterprise
- 5.4.2 Mid-Market
- 5.4.3 Low-End / SOHO
- 5.5 By Geography
- 5.5.1 North America
- 5.5.1.1 United States
- 5.5.1.2 Canada
- 5.5.1.3 Mexico
- 5.5.2 South America
- 5.5.2.1 Brazil
- 5.5.2.2 Argentina
- 5.5.2.3 Rest of South America
- 5.5.3 Europe
- 5.5.3.1 United Kingdom
- 5.5.3.2 Germany
- 5.5.3.3 France
- 5.5.3.4 Italy
- 5.5.3.5 Spain
- 5.5.3.6 Rest of Europe
- 5.5.4 Asia-Pacific
- 5.5.4.1 China
- 5.5.4.2 Japan
- 5.5.4.3 India
- 5.5.4.4 South Korea
- 5.5.4.5 Rest of Asia-Pacific
- 5.5.5 Middle East and Africa
- 5.5.5.1 Middle East
- 5.5.5.1.1 Israel
- 5.5.5.1.2 Saudi Arabia
- 5.5.5.1.3 United Arab Emirates
- 5.5.5.1.4 Turkey
- 5.5.5.1.5 Rest of Middle East
- 5.5.5.2 Africa
- 5.5.5.2.1 South Africa
- 5.5.5.2.2 Egypt
- 5.5.5.2.3 Rest of Africa
- 5.5.5.1 Middle East
- 5.5.1 North America
6 COMPETITIVE LANDSCAPE
- 6.1 Market Concentration
- 6.2 Strategic Moves
- 6.3 Market Share Analysis
- 6.4 Company Profiles (includes Global level Overview, Market level overview, Core Segments, Financials as available, Strategic Information, Market Rank/Share for key companies, Products and Services, and Recent Developments)
- 6.4.1 Dell Technologies Inc.
- 6.4.2 NetApp Inc.
- 6.4.3 Hewlett Packard Enterprise Co.
- 6.4.4 Synology Inc.
- 6.4.5 Western Digital Corp.
- 6.4.6 Seagate Technology Holdings PLC
- 6.4.7 QNAP Systems Inc.
- 6.4.8 IBM Corp.
- 6.4.9 Hitachi Vantara LLC
- 6.4.10 Cisco Systems Inc.
- 6.4.11 Huawei Technologies Co. Ltd.
- 6.4.12 Lenovo Group Ltd.
- 6.4.13 Super Micro Computer Inc.
- 6.4.14 Buffalo Inc.
- 6.4.15 Zyxel Communications Corp.
- 6.4.16 Asustor Inc.
- 6.4.17 TerraMaster Technology Co. Ltd.
- 6.4.18 Thecus Technology Corp.
- 6.4.19 Promise Technology Inc.
- 6.4.20 Infortrend Technology Inc.
- 6.4.21 Netgear Inc.
- 6.4.22 Pure Storage Inc.
- 6.4.23 Fujitsu Ltd.
- 6.4.24 NEC Corp.
7 MARKET OPPORTUNITIES AND FUTURE OUTLOOK
- 7.1 White-Space and Unmet-Need Assessment

 全球網路附加儲存 (NAS) 市場(至 2032 年):按組件、服務、產品類型、儲存解決方案、部署模式、最終用戶產業和地區分類
 網路附加儲存 (NAS) 市場:按類型、組件、設備類型、產業、部署模式和組織規模分類-2026-2032 年全球市場預測
 2026年全球網路附加儲存(NAS)閘道器市場報告
 網路附加儲存 (NAS) 市場報告:按產品類型、儲存解決方案、部署模式、最終用戶產業和地區分類 (2026–2034)2026年全球雲端網路附加儲存(NAS)閘道器市場報告
 網路附加儲存市場:按儲存解決方案、組織規模、產業和地區分類。2026年全球網路附加儲存市場報告
 網路附加儲存 (NAS) 市場分析及至 2035 年預測:按類型、產品類型、服務、技術、組件、應用、部署類型、最終用戶、功能和解決方案分類
 2026-2030年全球網路附加儲存(NAS)市場NAS網路儲存伺服器市場:2026-2032年全球預測(按部署類型、硬碟位元數量、硬碟類型、連接方式、儲存容量、垂直產業和企業規模分類)