

 |
市場調查報告書
商品編碼
2121938
生物醇:市場佔有率分析、產業趨勢與統計、成長預測(2026-2031)Bio-alcohols - Market Share Analysis, Industry Trends & Statistics, Growth Forecasts (2026 - 2031) |
||||||

※ 本網頁內容可能與最新版本有所差異。詳細情況請與我們聯繫。
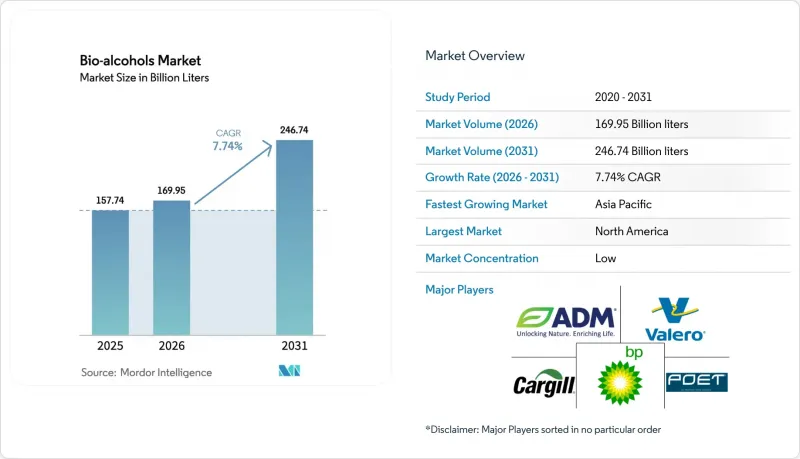
根據 Mordor Intelligence 估計,生物酒精市場規模將在 2026 年達到 1,699.5 億公升,高於 2025 年的 1,577.4 億公升,預計到 2031 年將達到 2,467.4 億公升。
預計從 2026 年到 2031 年,其複合年成長率將達到 7.74%。
本報告按產品類型(生物甲醇、生質乙醇、生物丁醇、生物丁二醇等)、原料(澱粉作物、糖料作物、木質纖維素生質能等)、應用領域(運輸、建築、電子等)和地區(亞太地區、北美地區、歐洲地區、南美地區、中東和非洲地區)進行細分。市場預測以公升為單位。
全球生物醇市場趨勢與洞察
強制摻混乙醇的目標
強制摻混義務能夠保障需求、降低投資者風險並加速工廠擴張。印度的目標是到2030年實現30%的摻混率,目前已達到20%,顯示雄心勃勃的政策能帶來巨大的成長潛力。歐盟的「ReFuelEU Aviation」法規規定,到2025年永續航空燃料(SAF)摻混比例將達到2%,到2050年將提高到70%,為「醇製航空煤油」(ATJ)計畫提供了清晰的路徑。巴西的E27計畫被視為實現高摻混率的典範,前提是物流障礙能夠消除。強制摻混可以保護供應免受商品價格波動的影響,使生產商能夠簽訂長期原料採購合約並降低資金籌措成本。
航空公司在酒精燃料轉噴射燃料航線的SAF認證方面取得快速進展
航空業對淨零排放的追求正迅速加速推進醇基噴射機燃料的研發路徑測試。蘭札噴射機公司(LanzaJet)位於喬治亞的自由松燃料廠(Freedom Pines Fuels)年產量已達900萬加侖,這讓投資者對大型工廠的運作充滿信心。阿克森斯公司(Axens)的Jetanol專案規劃年產能超過10億加侖,凸顯了該技術的巨大資金籌措潛力。由於永續航空燃料(SAF)的售價通常是傳統噴射機燃料的兩到三倍,生質乙醇生產商可以透過將業務重心轉向航空業來獲得更高的利潤率。與航空公司簽訂長期採購協議,例如西南航空與美國生物能源公司(USA Bioenergy)之間的契約,進一步降低了專案的現金流風險。
高醇混合燃料的管道相容性不足
由於腐蝕和吸水問題,大多數石油管線無法輸送高醇燃料混合物,迫使人們依賴卡車和鐵路運輸。這種額外的物流成本削弱了交付價格的競爭力,尤其是在遠離混合終端的地區。管道維修需要眾多所有者之間的合作以及大量的資本投入,而這在某些市場尚未得到充分論證。
細分市場分析
由於成熟的生產設施、標準化的規格和有利的法規,預計到2025年,生質乙醇將維持67.42%的生物醇市場佔有率。其經濟高效的轉化工藝和全球供應鏈進一步鞏固了主導地位。儘管汽油需求趨於平穩,但隨著全國範圍內摻混上限的絕對值提高,生質乙醇市場預計將穩步成長。同時,生物丁醇憑藉其卓越的能量密度和直接替代特性,正在擴大其在高階化學品市場的佔有率,並實現了9.07%的複合年成長率。
將醇類轉化為噴射機燃料的技術進步為乙醇帶來了更高價值的市場機會。 LanzaJet 的早期營運數據顯示,低成本的農業乙醇可以升級為永續航空燃料 (SAF),其售價是前者的兩到三倍。同時,生物甲醇在船用燃料和塑膠領域找到了市場,而生物丁二醇 (bio-BDO) 則滿足了製藥和工程材料等細分市場的需求。總體而言,特種醇正在使生物醇市場多元化,並降低其對道路燃料價格波動的敏感度。
區域分析
預計到2025年,北美將佔據39.02%的市場佔有率,這反映了該地區玉米製乙醇生產集中、鐵路物流網路發達,以及可再生燃料標準(RFS)維持在基準水平。加拿大2025年無污染燃料法規正在擴大美國以外地區對低碳混合燃料的需求。墨西哥新建糖廠的投資正在將北美大陸連接成一個互補的供應鏈。 Summit Next Gen公司投資16億美元在德克薩斯州建設的乙醇-SAF綜合體項目符合JETI撥款資格,該項目清晰地展示了地方政府津貼如何與聯邦稅額扣抵相結合,從而吸引大型企劃。
亞太地區是經濟成長的主要驅動力,年複合成長率達9.21%,這主要得益於印度在實現30%混合燃料目標方面取得的快速進展以及創紀錄的米原料採購量。中國正透過資助與2060年碳中和計畫相關的二氧化碳製醇試點計畫來增強發展勢頭,而日本和韓國則在煉油廠和機場推行綠色燃料獎勵。包括菲律賓在內的東南亞國協也正在放寬混合燃料法規,維持了全部區域的廣泛需求。這些政策正在促進將本地原料與進口技術結合的合資企業,加速產能擴張。
在歐洲,嚴格的碳定價和強制性永續航空燃料(SAF)正在推進,刺激了高價值細分市場的發展。 「ReFuelEU」法規為投資者提供了未來SAF生產擴張的明確指南,而德國和英國正在實施國家層面的補貼,以確保國內生產。包括甜菜和廢棄物生質能在內的原料的柔軟性有助於緩解供應衝擊。南美洲繼續利用先進的第二代糖廠加工廉價的甘蔗和甘蔗渣,以支持向供不應求地區穩定出口。中東和非洲正在進行先導計畫,儘管規模較小,但這是其多元化策略的一部分。
其他好處:
- Excel格式的市場預測(ME)表
- 3個月的分析師支持
目錄
第1章:引言
- 研究假設和市場定義
- 調查範圍
第2章:調查方法
第3章執行摘要
第4章 市場狀況
- 市場概覽
- 市場促進因素
- 強制摻混乙醇的目標
- 航空公司安全航空燃料認證(SAF)在酒精噴射機燃料轉換為航空煤油方面取得了快速進展。
- 煉油廠二氧化碳製醇轉換(CCU)裝置的整合
- 生物醇作為低碳化工原料在消費品領域的應用
- 甲醇新運輸路線
- 市場限制因素
- 原物料價格波動
- 高混合醇類與管道的兼容性不足。
- 從 2027 年起,全球輕型汽車(微型汽車)產量預計將保持穩定。
- 價值鏈分析
- 波特五力模型
第5章 市場規模與成長預測
- 依產品類型
- 生物甲醇
- 生質乙醇
- 生物丁醇
- 生物BDO
- 其他生物醇
- 按原料
- 主要成分為澱粉的作物
- 糖料作物
- 木質纖維素生質能
- 藻類生質能
- 工業廢氣和一般廢棄物
- 透過使用
- 運輸
- 建造
- 電子設備
- 製藥
- 其他用途
- 按地區
- 亞太地區
- 中國
- 印度
- 日本
- 韓國
- 東南亞國協
- 其他亞太國家
- 北美洲
- 美國
- 加拿大
- 墨西哥
- 歐洲
- 德國
- 英國
- 法國
- 義大利
- 其他歐洲國家
- 南美洲
- 巴西
- 阿根廷
- 其他南美國家
- 中東和非洲
- 沙烏地阿拉伯
- 南非
- 其他中東和非洲國家
- 亞太地區
第6章 競爭情勢
- 市場集中度
- 策略趨勢
- 市佔率分析
- 公司簡介
- Abengoa
- ADM
- BASF SE
- BP plc
- Cargill Incorporated
- CropEnergies AG
- Gevo
- Green Plains Inc.
- INEOS
- Mascoma LLC
- POET LLC
- Raizen
- SEKISUI CHEMICAL CO., LTD.
- Valero Energy Corporation
第7章 市場機會與未來展望
According to Mordor Intelligence, bio-alcohols market size in 2026 is estimated at 169.95 billion liters, growing from 2025 value of 157.74 billion liters with 2031 projections showing 246.74 billion liters, growing at 7.74% CAGR over 2026-2031.
This report is Segmented by Product Type (Bio-Methanol, Bio-Ethanol, Bio-Butanol, Bio-BDO, and More), Feedstock (Starch-Based Crops, Sugar-Based Crops, Lignocellulosic Biomass, and More), Application (Transportation, Construction, Electronics, and More), and Geography (Asia-Pacific, North America, Europe, South America, Middle East and Africa). The Market Forecasts are Provided in Terms of Volume (Liters).
Global Bio-alcohols Market Trends and Insights
Mandated Ethanol-Blend Targets
Blend mandates guarantee demand, reduce investor risk, and speed plant expansions. India's goal of 30% blending by 2030, having already reached 20%, shows the upside that ambitious policy can unlock. The EU's ReFuelEU Aviation rule starts with 2% SAF in 2025 and rises to 70% by 2050, offering a clear runway for alcohol-to-jet projects. Brazil's E27 program remains a template for high blend ratios once logistics barriers ease. Because mandates shield volumes from commodity swings, producers can line up long-term feedstock contracts and lower financing costs.
Rapid Airline SAF Certification of Alcohol-to-Jet Pathways
Aviation's net-zero push has sharply accelerated testing of alcohol-to-jet routes. LanzaJet's Freedom Pines Fuels site in Georgia already makes 9 million gallons a year and gives financiers confidence that large plants will run reliably. Axens' Jetanol projects now top 1 billion gallons per year of planned capacity, underlining the technology's bankability. SAF often sells at two to three times the price of conventional jet fuel, so bio-ethanol producers enjoy wider margins when they pivot toward aviation customers. Long-term airline offtake deals, such as Southwest's agreement with USA BioEnergy, further derisk project cash flows.
Insufficient Pipeline Compatibility for High-Blend Alcohols
Most petroleum pipelines cannot handle high alcohol blends due to corrosion and water uptake, forcing reliance on truck or rail. The extra logistics cost erodes delivered-price competitiveness, especially in regions far from blending terminals. Upgrading lines needs cooperation between many owners and warrants high capital that some markets cannot justify yet.
Other drivers and restraints analyzed in the detailed report include:
- Integration of CO2-to-Alcohol CCU Plants at Refineries
- Bio-Alcohol as Low-Carbon Chemical Feedstock in CPG
- Stagnant Global Light-Vehicle Production Post-2027
For complete list of drivers and restraints, kindly check the Table Of Contents.
Segment Analysis
Bio-ethanol kept a 67.42% 2025 Bio-alcohol market share, underpinned by mature plants, standardized specs, and supportive mandates. Its conversion cost edge and global supply chain reinforce leadership. The Bio-alcohol market size for bio-ethanol is expected to expand steadily in line with nationwide blend limits that increase absolute volume even as gasoline peaks. Yet bio-butanol's superior energy density and drop-in compatibility are propelling its 9.07% CAGR and a rising slice of premium chemical demand.
Alcohol-to-jet breakthroughs provide a higher-value outlet for ethanol. LanzaJet's early operating data confirm that low-cost agricultural ethanol can be upgraded into SAF that sells at a 2-3X price multiple. Meanwhile, bio-methanol is carving room in marine fuels and plastics, and bio-BDO caters to pharmaceutical and engineered-material niches. Collectively, specialty alcohols diversify the Bio-alcohol market and lessen sensitivity to road-fuel swings.
Complete Report Scope:
- By Product Type
- Bio-Methanol
- Bio-Ethanol
- Bio-Butanol
- Bio-BDO
- Other Bio-Alcohols
- By Feedstock
- Starch-based Crops
- Sugar-based Crops
- Lignocellulosic Biomass
- Algal Biomass
- Industrial Off-gases and MSW
- By Application
- Transportation
- Construction
- Electronics
- Pharmaceuticals
- Other Applications
- By Geography
- Asia-Pacific
- China
- India
- Japan
- South Korea
- ASEAN Countries
- Rest of Asia-Pacific
- North America
- United States
- Canada
- Mexico
- Europe
- Germany
- United Kingdom
- France
- Italy
- Rest of Europe
- South America
- Brazil
- Argentina
- Rest of South America
- Middle East and Africa
- Saudi Arabia
- South Africa
- Rest of Middle East and Africa
- Asia-Pacific
Geography Analysis
North America's 39.02% 2025 share mirrors its dense corn-to-ethanol corridor, ample rail logistics, and the Renewable Fuel Standard that keeps baseline volumes. Canada's 2025 Clean Fuel Regulation widens demand for low-carbon blends beyond the United States. Mexico's new mill investments knit the continent into a self-reinforcing supply chain. Summit Next Gen's USD 1.6 billion Texas ethanol-to-SAF complex, eligible for JETI subsidies, underlines how local grants align with federal tax credits to lure mega-projects.
Asia-Pacific is the growth engine, tracking a 9.21% CAGR on the back of India's fast-tracked 30% blend agenda and record rice-feedstock pull. China adds momentum by funding CO2-to-alcohol pilots that dovetail with its 2060 neutrality plan, while Japan and South Korea channel green-fuel incentives at refineries and airports. ASEAN markets, including the Philippines, are lifting blending rules too, keeping regional demand broad-based. This policy updraft attracts joint ventures that stitch together local feedstock with imported technology, accelerating capacity rollout.
Europe moves with stringent carbon-pricing and SAF mandates that jump-start premium niches. The ReFuelEU rulebook gives investors clarity on future SAF ramp-ups, while Germany and the UK run national subsidies to ensure domestic production. Feedstock flexibility, including sugar beet and waste biomass, helps buffer supply shocks. South America continues leveraging cheap sugarcane and advanced second-generation mills that process bagasse, supporting steady export flows to deficit regions. The Middle East and Africa, though smaller, are piloting projects as part of diversification strategies.
- Abengoa
- ADM
- BASF SE
- BP p.l.c.
- Cargill Incorporated
- CropEnergies AG
- Gevo
- Green Plains Inc.
- INEOS
- Mascoma LLC
- POET LLC
- Raizen
- SEKISUI CHEMICAL CO., LTD.
- Valero Energy Corporation
Additional Benefits:
- The market estimate (ME) sheet in Excel format
- 3 months of analyst support
TABLE OF CONTENTS
1 Introduction
- 1.1 Study Assumptions and Market Definition
- 1.2 Scope of the Study
2 Research Methodology
3 Executive Summary
4 Market Landscape
- 4.1 Market Overview
- 4.2 Market Drivers
- 4.2.1 Mandated ethanol-blend targets
- 4.2.2 Rapid airline SAF certification of Alcohol-to-Jet pathways
- 4.2.3 Integration of CO2 to alcohol CCU plants at refineries
- 4.2.4 Bio-alcohol use as low-carbon chemical feedstock in CPG
- 4.2.5 Emerging methanol-powered shipping corridors
- 4.3 Market Restraints
- 4.3.1 Feedstock price volatility
- 4.3.2 Insufficient pipeline compatibility for high-blend alcohols
- 4.3.3 Stagnant global light-vehicle production post-2027
- 4.4 Value Chain Analysis
- 4.5 Porter's Five Forces
- 4.5.1 Bargaining Power of Suppliers
- 4.5.2 Bargaining Power of Buyers
- 4.5.3 Threat of New Entrants
- 4.5.4 Threat of Substitutes
- 4.5.5 Degree of Competition
5 Market Size and Growth Forecasts (Volume)
- 5.1 By Product Type
- 5.1.1 Bio-Methanol
- 5.1.2 Bio-Ethanol
- 5.1.3 Bio-Butanol
- 5.1.4 Bio-BDO
- 5.1.5 Other Bio-Alcohols
- 5.2 By Feedstock
- 5.2.1 Starch-based Crops
- 5.2.2 Sugar-based Crops
- 5.2.3 Lignocellulosic Biomass
- 5.2.4 Algal Biomass
- 5.2.5 Industrial Off-gases and MSW
- 5.3 By Application
- 5.3.1 Transportation
- 5.3.2 Construction
- 5.3.3 Electronics
- 5.3.4 Pharmaceuticals
- 5.3.5 Other Applications
- 5.4 By Geography
- 5.4.1 Asia-Pacific
- 5.4.1.1 China
- 5.4.1.2 India
- 5.4.1.3 Japan
- 5.4.1.4 South Korea
- 5.4.1.5 ASEAN Countries
- 5.4.1.6 Rest of Asia-Pacific
- 5.4.2 North America
- 5.4.2.1 United States
- 5.4.2.2 Canada
- 5.4.2.3 Mexico
- 5.4.3 Europe
- 5.4.3.1 Germany
- 5.4.3.2 United Kingdom
- 5.4.3.3 France
- 5.4.3.4 Italy
- 5.4.3.5 Rest of Europe
- 5.4.4 South America
- 5.4.4.1 Brazil
- 5.4.4.2 Argentina
- 5.4.4.3 Rest of South America
- 5.4.5 Middle East and Africa
- 5.4.5.1 Saudi Arabia
- 5.4.5.2 South Africa
- 5.4.5.3 Rest of Middle East and Africa
- 5.4.1 Asia-Pacific
6 Competitive Landscape
- 6.1 Market Concentration
- 6.2 Strategic Moves
- 6.3 Market Share Analysis
- 6.4 Company Profiles (includes Global level Overview, Market level overview, Core Segments, Financials as available, Strategic Information, Market Rank/Share for key companies, Products and Services, and Recent Developments)
- 6.4.1 Abengoa
- 6.4.2 ADM
- 6.4.3 BASF SE
- 6.4.4 BP p.l.c.
- 6.4.5 Cargill Incorporated
- 6.4.6 CropEnergies AG
- 6.4.7 Gevo
- 6.4.8 Green Plains Inc.
- 6.4.9 INEOS
- 6.4.10 Mascoma LLC
- 6.4.11 POET LLC
- 6.4.12 Raizen
- 6.4.13 SEKISUI CHEMICAL CO., LTD.
- 6.4.14 Valero Energy Corporation
7 Market Opportunities and Future Outlook
- 7.1 White-space and Unmet-need Assessment


