


 |
市場調查報告書
商品編碼
2121933
能源領域的物聯網 (IoT):市場佔有率分析、行業趨勢和統計數據以及成長預測 (2026-2031)Internet Of Things In Energy - Market Share Analysis, Industry Trends & Statistics, Growth Forecasts (2026 - 2031) |
||||||

※ 本網頁內容可能與最新版本有所差異。詳細情況請與我們聯繫。
據 Mordor Intelligence 稱,到 2026 年,能源領域的物聯網 (IoT) 市場規模估計為 342.6 億美元,高於 2025 年的 298.7 億美元,預計到 2031 年將達到 679.8 億美元。
預計從 2026 年到 2031 年,其複合年成長率將達到 14.69%。
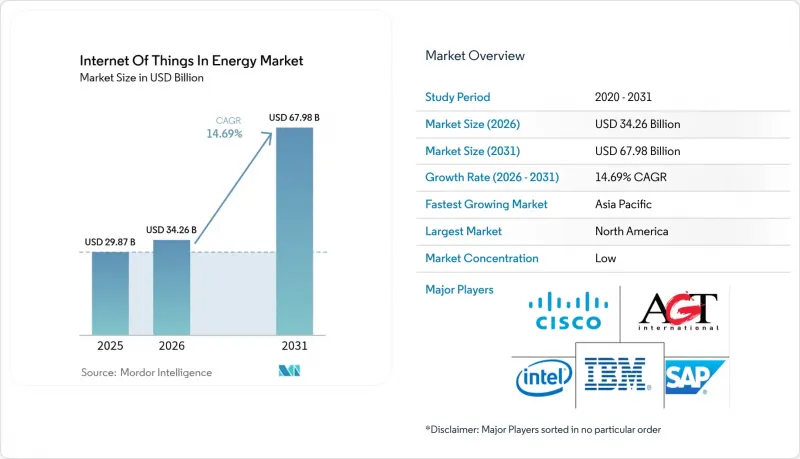
本報告按組件(硬體、軟體和分析、物聯網平台等)、應用(智慧電網監控、能源管理系統、預測性維護等)、連接技術(蜂窩網路(2G-5G)、衛星物聯網等)、部署模型(雲、邊緣等)、最終用戶(電力和燃氣公司、住宅和產消者等)以及地區進行分類。
全球能源物聯網市場趨勢與洞察
強制公共產業。
隨著監管機構要求提高低壓電網的透明度並促進需量反應,強制性高級計量基礎設施已超越試點階段。霍尼韋爾和威瑞森目前正在將原生5G無線功能整合到電錶中,從而實現遠端韌體更新、自癒網狀通訊和自主服務關閉。雖然挪威已完成全國範圍的部署,但只有29.5%的家庭實際查看了他們的用電量數據,這凸顯了真正的節能取決於消費者的參與度和直覺易用的應用程式的可用性。因此,公用事業公司正在將技術部署與客戶教育、遊戲化儀錶板和價格獎勵相結合。高階電錶向配電管理系統提供詳細的間隔數據,使其能夠預測屋頂太陽能發電的併網情況和電動車的叢集,並在不過度擴張容量的情況下平衡負載。
降低 5G/LPWAN 模組的成本
半導體供應的正常化使得窄頻聯網模組的價格在2023年至2025年間下降了28%,從而消除了大規模感測器部署的主要成本障礙。實驗室測試表明,LTE-M相比許多其他低功耗協議,具有更高的吞吐量和更低的能耗,這在電池更換成本高昂的情況下至關重要。半導體製造商正在重新設計整合人工智慧加速功能的微控制器,以實現邊緣異常檢測。調查團隊證明,將LoRa閘道器改造為輕量級運算節點,可以在保持傳統有效載荷格式的同時,將回程傳輸流量減少70%。能源公司目前正在偏遠風電場、農村變電站和閥組部署這些模組,將資產管理功能部署在卡車鮮少到達的地點。
網路安全與OT/IT整合的風險
隨著運行設備更容易透過公共網路訪問,攻擊面也在不斷擴大。將於2025年8月生效的歐盟《網路彈性法案》將強制要求設備製造商記錄軟體元件並及時提供修補程式。許多變電站仍然使用缺乏身份驗證的傳統協議,滲透測試表明,如果網路分段不足,惡意軟體可以在幾分鐘內將其入侵路徑從收費伺服器擴展到斷路器控制系統。空中下載 (OTA) 更新管道、硬體信任根和零信任網路分段在新採購框架中變得至關重要。有效的管治取決於資訊科技 (IT) 團隊和操作技術(OT) 團隊之間更緊密的合作。
細分市場分析
到2025年,智慧電錶、智慧感測器、閘道器和邊緣控制器將佔據能源市場物聯網佔有率的40.40%。這波硬體浪潮為公用事業公司的數位孿生模型提供動力,並將詳細的現場數據傳輸到分析雲端。隨著監管機構要求供應商證明設備從晶片到雲端的完整性,安全硬體模組和可信任執行環境(TEE)正日益受到關注。物聯網安全平台預計到2031年將以17.35%的複合年成長率成長,是整個系統平均成長率的兩倍,因為一次營運漏洞造成的損失可能會抵銷數年效率提升帶來的收益。基於加固型ARM或x86主機板建構的邊緣伺服器配備了人工智慧加速器,可在毫秒內完成故障偵測。東芝最近發布了一款金鑰管理晶片組,可在韌體到達韌體設備之前對其進行簽名,從而縮短合規負責人的審計時間。
軟體和服務正步硬體的後塵。公共產業正在投資全端解決方案,供應商將設備、連接和基於訂閱的儀表板捆綁在一起。在資料科學人才稀缺的地區,託管服務合約越來越受到關注,因為它們可以將整合風險轉移給供應商。因此,業務收益在該市場不斷成長。同時,為了降低地緣政治衝擊對半導體供應鏈的影響,零件供應商正在將其製造地遷移到更靠近需求中心的地方。
得益於一項在變壓器、饋線和電壓調節器上安裝測量儀器的項目,電網即時監測將在2025年貢獻38.10%的收入。人工智慧技術能夠即時調整設定點,即使在白天屋頂太陽能發電量激增的情況下,也能防止電網過壓。互聯電動車基礎設施的複合年成長率最高,達15.05%,因為充電樁既可以作為負載,也可以作為儲能設備。電力公司將這些充電樁視為靈活的節點,可在白天提供無功功率並吸收多餘的電力。政府對雙向充電樁的補貼以及強制使用開放協議進行遙測,進一步加速了物聯網設備在能源市場的應用。
隨著可再生能源營運商追求更高的容量利用率,預測性維護正日益受到重視。離岸風力發電目前正在整合軟體定義網路 (SDN) 環路,即使在惡劣的海洋環境中也能與機艙感測器保持確定性的連接。商業建築的需量反應計畫已將關鍵時段的尖峰時段電力消耗量降低了高達 86%。工業用戶正在實施邊緣分析,以降低單位產量的電力消耗量,這項指標直接影響 ESG 評分卡和投資者評估標準。
區域分析
預計到2025年,北美將佔能源市場物聯網銷售額的37.60%。聯邦政府對電網韌性的投資、各州清潔能源標準的製定以及成熟行動電話網路的普及,正在推動物聯網技術的快速應用。施耐德電機警告稱,資料中心負載的成長速度超過了變電站的建設速度,迫使電力公司部署物聯網感測器,以盡可能從現有輸電線路中提取電流。由於在永凍土區鋪設光纖成本高昂,加拿大偏遠地區的微電網是衛星物聯網早期應用的典範。墨西哥的能源改革吸引了分散式太陽能發電領域的投資者,他們從一開始就尋求預測分析技術。
亞太地區是成長最快的地區,預計到2031年複合年成長率將達到16.58%。日本的超級太陽能專案目標是到2030年達到20吉瓦的裝置容量,採用理論效率超過30%的鈣鈦礦電池。中國「十四五」規劃下的智慧電網部署包括多能源微電網和整合在輸電塔中的5G基地台。印度的可再生能源推廣措施將物聯網感測器與政府補貼的雲端託管相結合,而韓國的工業園區正在工廠部署人工智慧邊緣運算設備以降低用電高峰。
在歐洲,受嚴格的碳排放法規和跨境供需調節市場的推動,物聯網正穩步擴張。歐盟的《網路韌性法案》強制要求所有物聯網預算都必須包含安全支出。在德國的工業4.0舉措中,工廠正在將電能品質計量表整合到生產計畫中,使單位能耗(瓦時/單位)成為與生產週期同等重要的關鍵績效指標(KPI)。在英國,公共部門的節能項目已經實現了兩位數的節能效果,因為設施管理人員現在可以獲得每分鐘的詳細資訊。在法國,核能發電廠的冷卻泵正在安裝振動感測器以延長其運行許可證期限,北歐國家的電網營運商正在試點市場平台以實現即時柔軟性。中東和非洲仍處於物聯網應用的早期階段,但與綠氫能工廠相連的大規模太陽能發電和儲能專案無疑將支撐未來的需求。
其他好處:
- Excel格式的市場預測(ME)表
- 3個月的分析師支持
目錄
第1章:引言
- 研究假設和市場定義
- 調查範圍
第2章:調查方法
第3章執行摘要
第4章 市場狀況
- 市場概覽
- 市場促進因素
- 強制要求電力公司引入智慧電錶並實現電網現代化。
- 降低 5G/LPWAN 模組的成本
- 分散式可再生能源編配的需求
- 利用人工智慧進行預測性維護的投資報酬率範例
- 將柔軟性貨幣化(V2G、P2P能源)
- 碳計量數據的監管
- 市場限制因素
- 網路安全與營運技術/資訊科技整合所帶來的風險
- 傳統SCADA系統之間的互通性差距
- 邊緣運算領域人才短缺
- 半導體供應波動
- 價值鏈分析
- 監理情勢
- 技術展望
- 波特五力分析
第5章 市場規模與成長預測
- 按組件
- 硬體
- 智慧型恆溫器
- 智慧電錶
- 電動車充電站
- 其他
- 軟體和分析
- 物聯網平台
- 物聯網安全
- 物聯網服務
- 硬體
- 透過使用
- 智慧電網監測
- 能源管理系統
- 預測性保護
- 互聯電動車基礎設施
- 分散式可再生能源的整合
- 需量反應和柔軟性
- 透過連接技術
- 蜂窩網路(2G-5G)
- LPWAN(NB-IoT、LoRaWAN、Sigfox)
- 衛星物聯網
- Wi-Fi/BLE
- PLC 和其他
- 按安裝模式
- 雲
- 邊緣
- 現場
- 最終用戶
- 電力和燃氣公司
- 石油和天然氣的上游/中游/下游
- 商業和工業設施
- 住宅及產消者
- 可再生能源發電發電廠
- 按地區
- 北美洲
- 美國
- 加拿大
- 墨西哥
- 南美洲
- 巴西
- 阿根廷
- 歐洲
- 德國
- 英國
- 法國
- 俄羅斯
- 亞太地區
- 中國
- 印度
- 日本
- 韓國
- ASEAN
- 其他亞太國家
- 中東和非洲
- 中東
- 沙烏地阿拉伯
- 土耳其
- 非洲
- 南非
- 中東
- 北美洲
第6章 競爭情勢
- 市場集中度
- 策略趨勢
- 市佔率分析
- 公司簡介
- Cisco Systems
- IBM Corporation
- Siemens AG
- Schneider Electric
- Huawei Technologies
- Intel Corporation
- SAP SE
- Oracle Corporation
- AGT International
- Davra Networks
- Flutura Business Solutions
- Wind River Systems
- Silver Spring Networks
- Verizon Business
- Vodafone IoT
- GE Digital
- Emerson Electric
- Siemens Gamesa(renewable IoT)
- Landis+Gyr
- Kamstrup
第7章 市場機會與未來展望
According to Mordor Intelligence, internet of Things in the energy market size in 2026 is estimated at USD 34.26 billion, growing from 2025 value of USD 29.87 billion with 2031 projections showing USD 67.98 billion, growing at 14.69% CAGR over 2026-2031.
This report is Segmented by Component (Hardware, Software and Analytics, Iot Platforms, and More), Application (Smart Grid Monitoring, Energy Management Systems, Predictive Maintenance, and More), Connectivity Technology (Cellular (2G-5G), Satellite IoT, and More), Deployment Model (Cloud, Edge, and More), End-User (Electric and Gas Utilities, Residential and Prosumer, and More), and Geography
Global Internet Of Things In Energy Market Trends and Insights
Utility Smart-Meter Roll-Outs and Grid-Modernization Mandates
Mandated advanced metering infrastructure has moved beyond the pilot stage as regulators demand visibility of low-voltage networks and demand response outcomes. Honeywell and Verizon now embed native 5G radios into meters, enabling remote firmware updates, self-healing mesh communication, and autonomous service disconnects. Norway completed nationwide roll-outs yet only 29.5% of households checked live consumption data, underscoring that consumer engagement and intuitive apps decide whether hard savings materialize. Utilities therefore pair technical deployment with customer education, gamified dashboards, and tariff incentives. Advanced meters feed granular interval data to distribution management systems so that rooftop solar back-feed and electric vehicle (EV) clustering can be forecast and balanced without over-building capacity.
Falling 5G/LPWAN Module Cost
Chip supply normalization pushed narrow-band IoT module prices down by 28% between 2023 and 2025, removing a key cost barrier for high-volume sensor roll-outs. Laboratory tests show LTE-M offers higher throughput and lower energy consumption than many alternative low-power protocols, which is important where battery swaps are costly. Semiconductor makers are redesigning micro-controllers with integrated AI acceleration so that anomaly detection can occur at the edge. Research teams have proved that turning LoRa gateways into lightweight compute nodes trims backhaul traffic by 70% without breaking legacy payload formats. Energy firms now equip remote wind farms, rural substations, and valve arrays with these modules, placing asset intelligence where trucks rarely visit.
Cyber-Security and OT/IT Convergence Risk
As operational equipment becomes routable on public networks, attack surfaces multiply. The EU Cyber Resilience Act will come into force in August 2025, obliging device makers to document software components and issue timely patches. Many substations still run legacy protocols that lack authentication, and intrusion studies show malware can pivot from billing servers to breaker controls in minutes if segmentation is weak. Over-the-air update pipelines, hardware root-of-trust, and zero-trust segmentation are becoming mandatory across new procurement frameworks. Effective governance hinges on closer collaboration between information-technology and operational-technology teams.
Other drivers and restraints analyzed in the detailed report include:
- Distributed-Renewable Orchestration Needs
- AI-Driven Predictive-Maintenance ROI Cases
- Legacy-SCADA Interoperability Gap
For complete list of drivers and restraints, kindly check the Table Of Contents.
Segment Analysis
Smart meters, intelligent sensors, gateways, and edge controllers collectively secured 40.40% of the Internet of Things in the energy market share in 2025. The hardware wave anchors utility digital twins and pushes granular field data into analytics clouds. Security hardware modules and trusted execution environments gain notice because regulators now ask vendors to prove device integrity from chip to cloud. IoT security platforms are forecast to compound at 17.35% through 2031, twice the system average, as the cost of a single operational breach can erase multi-year efficiency savings. Edge servers built on ruggedised ARM or x86 boards are shipping with AI accelerators that handle fault detection in milliseconds. Toshiba recently unveiled a key-management chipset that signs firmware blobs before they touch the field device, trimming audit times for compliance reviewers.
Software and services follow hardware's beachhead. Utilities are paying for full-stack offerings where the vendor bundles devices, connectivity, and a subscription dashboard. Managed service contracts appeal in regions short of data-science talent because they shift integration risk to the supplier. As a result, services revenue is taking a larger slice of the expanding Internet of Things in the energy market. Meanwhile, component suppliers are moving manufacturing closer to demand centres to buffer any geopolitical shock to semiconductor flows.
Real-time distribution grid monitoring accounted for 38.10% of 2025 revenue thanks to programs that instrument transformers, feeders, and voltage regulators. AI overlays adapt set-points on the fly so that networks avoid over-voltage when rooftop solar spikes midday. Connected EV infrastructure shows the fastest 15.05% CAGR because chargers double as both load and storage assets. Utilities view them as flexible nodes that can supply reactive power and soak up midday excess. Governments are subsidising bidirectional chargers and demanding open-protocol telemetry, which funnels more devices into the Internet of Things in the energy market.
Predictive maintenance sits close behind as renewable owners chase higher capacity factors. Offshore wind farms now integrate software-defined networking rings that maintain deterministic links to nacelle sensors despite harsh marine environments. Demand-response programs inside commercial buildings have trimmed peak kW draw by up to 86% during critical intervals. Industrial users deploy edge analytics to lower electricity per unit of output, a metric that directly feeds ESG scorecards and investor screens.
Complete Report Scope:
- By Component
- Hardware
- Smart Thermostats
- Smart Meters
- EV Charging Stations
- Other Hardware
- Software and Analytics
- IoT Platforms
- IoT Security
- IoT Services
- Hardware
- By Application
- Smart Grid Monitoring
- Energy Management Systems
- Predictive Maintenance
- Connected EV Infrastructure
- Distributed-Renewable Integration
- Demand Response and Flexibility
- By Connectivity Technology
- Cellular (2G-5G)
- LPWAN (NB-IoT, LoRaWAN, Sigfox)
- Satellite IoT
- Wi-Fi/BLE
- PLC and Other
- By Deployment Model
- Cloud
- Edge
- On-premise
- By End-user
- Electric and Gas Utilities
- Oil and Gas Up/Mid/Down-stream
- Commercial and Industrial Facilities
- Residential and Prosumer
- Renewable Power Plants
- By Geography
- North America
- United States
- Canada
- Mexico
- South America
- Brazil
- Argentina
- Europe
- Germany
- United Kingdom
- France
- Russia
- Asia Pacific
- China
- India
- Japan
- South Korea
- ASEAN
- Rest of Asia Pacific
- Middle East and Africa
- Middle East
- Saudi Arabia
- Turkey
- Africa
- South Africa
- Middle East
- North America
Geography Analysis
North America commanded 37.60% of 2025 revenue for the Internet of Things in the energy market. Federal investment in grid resilience, state-level clean-energy standards, and a mature cellular footprint enable rapid adoption. Schneider Electric warns that data-centre load is climbing faster than substation build-outs, forcing utilities to deploy IoT sensors to squeeze every amp from existing lines. Canada's remote microgrids are early satellite IoT adopters because fibre drops are expensive in permafrost. Mexico's energy reform is attracting distributed solar investors who demand predictive analytics from day one.
Asia Pacific is the fastest-growing region at a 16.58% CAGR through 2031. Japan's super-solar project targets 20 GW by 2030 using perovskite cells with a theoretical efficiency beyond 30%. China's smart-grid rollout under the 14th Five-Year Plan includes multi-energy microgrids and 5G base stations embedded in transmission pylons. India's renewables push blends IoT sensors with government-subsidised cloud hosting, while South Korean industrial parks equip factories with AI edge boxes to shave power peaks.
Europe shows steady expansion on the back of stringent carbon laws and cross-border balancing markets. The EU Cyber Resilience Act hard-codes security spending into every IoT budget. Germany's Industry 4.0 initiatives mean factories integrate power-quality meters with production scheduling so that watt-hours per unit become a KPI as important as takt time. The United Kingdom's public-sector energy efficiency program has already logged double-digit savings after building managers gained minute-level insights. France upgrades nuclear station cooling pumps with vibration sensors to extend operating licenses, and Nordic grid operators test market platforms for real-time flexibility. The Middle East and Africa are earlier in the curve but mega solar-and-storage projects linked to green-hydrogen plants guarantee future demand.
- Cisco Systems
- IBM Corporation
- Siemens AG
- Schneider Electric
- Huawei Technologies
- Intel Corporation
- SAP SE
- Oracle Corporation
- AGT International
- Davra Networks
- Flutura Business Solutions
- Wind River Systems
- Silver Spring Networks
- Verizon Business
- Vodafone IoT
- GE Digital
- Emerson Electric
- Siemens Gamesa (renewable IoT)
- Landis+Gyr
- Kamstrup
Additional Benefits:
- The market estimate (ME) sheet in Excel format
- 3 months of analyst support
TABLE OF CONTENTS
1 INTRODUCTION
- 1.1 Study Assumptions and Market Definition
- 1.2 Scope of the Study
2 RESEARCH METHODOLOGY
3 EXECUTIVE SUMMARY
4 MARKET LANDSCAPE
- 4.1 Market Overview
- 4.2 Market Drivers
- 4.2.1 Utility smart-meter roll-outs and grid-modernization mandates
- 4.2.2 Falling 5G/LPWAN module costs
- 4.2.3 Distributed-renewable orchestration needs
- 4.2.4 AI-driven predictive-maintenance ROI cases
- 4.2.5 Flexibility monetisation (V2G, P2P energy)
- 4.2.6 Carbon-accounting data regulations
- 4.3 Market Restraints
- 4.3.1 Cyber-security and OT/IT convergence risk
- 4.3.2 Legacy-SCADA interoperability gaps
- 4.3.3 Edge-compute talent scarcity
- 4.3.4 Semiconductor-supply volatility
- 4.4 Value Chain Analysis
- 4.5 Regulatory Landscape
- 4.6 Technological Outlook
- 4.7 Porter's Five Forces Analysis
- 4.7.1 Threat of New Entrants
- 4.7.2 Bargaining Power of Buyers
- 4.7.3 Bargaining Power of Suppliers
- 4.7.4 Threat of Substitutes
- 4.7.5 Intensity of Rivalry
5 MARKET SIZE AND GROWTH FORECASTS (VALUE)
- 5.1 By Component
- 5.1.1 Hardware
- 5.1.1.1 Smart Thermostats
- 5.1.1.2 Smart Meters
- 5.1.1.3 EV Charging Stations
- 5.1.1.4 Other Hardware
- 5.1.2 Software and Analytics
- 5.1.3 IoT Platforms
- 5.1.4 IoT Security
- 5.1.5 IoT Services
- 5.1.1 Hardware
- 5.2 By Application
- 5.2.1 Smart Grid Monitoring
- 5.2.2 Energy Management Systems
- 5.2.3 Predictive Maintenance
- 5.2.4 Connected EV Infrastructure
- 5.2.5 Distributed-Renewable Integration
- 5.2.6 Demand Response and Flexibility
- 5.3 By Connectivity Technology
- 5.3.1 Cellular (2G-5G)
- 5.3.2 LPWAN (NB-IoT, LoRaWAN, Sigfox)
- 5.3.3 Satellite IoT
- 5.3.4 Wi-Fi/BLE
- 5.3.5 PLC and Other
- 5.4 By Deployment Model
- 5.4.1 Cloud
- 5.4.2 Edge
- 5.4.3 On-premise
- 5.5 By End-user
- 5.5.1 Electric and Gas Utilities
- 5.5.2 Oil and Gas Up/Mid/Down-stream
- 5.5.3 Commercial and Industrial Facilities
- 5.5.4 Residential and Prosumer
- 5.5.5 Renewable Power Plants
- 5.6 By Geography
- 5.6.1 North America
- 5.6.1.1 United States
- 5.6.1.2 Canada
- 5.6.1.3 Mexico
- 5.6.2 South America
- 5.6.2.1 Brazil
- 5.6.2.2 Argentina
- 5.6.3 Europe
- 5.6.3.1 Germany
- 5.6.3.2 United Kingdom
- 5.6.3.3 France
- 5.6.3.4 Russia
- 5.6.4 Asia Pacific
- 5.6.4.1 China
- 5.6.4.2 India
- 5.6.4.3 Japan
- 5.6.4.4 South Korea
- 5.6.4.5 ASEAN
- 5.6.4.6 Rest of Asia Pacific
- 5.6.5 Middle East and Africa
- 5.6.5.1 Middle East
- 5.6.5.1.1 Saudi Arabia
- 5.6.5.1.2 Turkey
- 5.6.5.2 Africa
- 5.6.5.2.1 South Africa
- 5.6.5.1 Middle East
- 5.6.1 North America
6 COMPETITIVE LANDSCAPE
- 6.1 Market Concentration
- 6.2 Strategic Moves
- 6.3 Market Share Analysis
- 6.4 Company Profiles (includes Global level Overview, Market level overview, Core Segments, Financials as available, Strategic Information, Market Rank/Share for key companies, Products and Services, and Recent Developments)
- 6.4.1 Cisco Systems
- 6.4.2 IBM Corporation
- 6.4.3 Siemens AG
- 6.4.4 Schneider Electric
- 6.4.5 Huawei Technologies
- 6.4.6 Intel Corporation
- 6.4.7 SAP SE
- 6.4.8 Oracle Corporation
- 6.4.9 AGT International
- 6.4.10 Davra Networks
- 6.4.11 Flutura Business Solutions
- 6.4.12 Wind River Systems
- 6.4.13 Silver Spring Networks
- 6.4.14 Verizon Business
- 6.4.15 Vodafone IoT
- 6.4.16 GE Digital
- 6.4.17 Emerson Electric
- 6.4.18 Siemens Gamesa (renewable IoT)
- 6.4.19 Landis+Gyr
- 6.4.20 Kamstrup
7 MARKET OPPORTUNITIES AND FUTURE OUTLOOK
- 7.1 White-space and Unmet-need Assessment

 2026年全球能源網際網路市場報告
 物聯網能源網管理市場規模、佔有率和成長分析:按組件組合、應用功能領域、最終用戶公用事業類型和地區分類 - 產業預測,2026-2033 年
 物聯網能源管理市場規模、佔有率、成長及全球產業分析:按類型、應用和地區分類的洞察,2026-2034 年預測2026年全球能源網管理物聯網(IoT)市場報告
 物聯網能源市場:2026-2032年全球市場預測(按服務類型、連接技術、部署模式、應用程式和最終用戶分類)2026年全球能源物聯網市場報告
 能源市場中的物聯網 (IoT):按連接方式、行業、技術、部署模式、應用、國家和地區分類 - 全球行業分析、市場規模、市場佔有率和預測 (2026–2033)
 能源領域物聯網 (IoT) 市場規模、佔有率和成長分析(按組件、解決方案、服務、網路技術、應用和地區分類)—產業預測 (2026-2033)全球油氣數位孿生市場:依類型、應用、部署模式和公司規模劃分 - 市場規模、行業趨勢、機會分析和預測(2025-2033 年)
 全球物聯網 (IoT) 能源市場規模研究與預測,按組件(解決方案和服務)、按應用(石油天然氣和煤礦)、按部署、按連接性和區域預測 2025-2035