


 |
市場調查報告書
商品編碼
2121871
能源採集系統:市場佔有率分析、產業趨勢與統計、成長預測(2026-2031)Energy Harvesting Systems - Market Share Analysis, Industry Trends & Statistics, Growth Forecasts (2026 - 2031) |
||||||

※ 本網頁內容可能與最新版本有所差異。詳細情況請與我們聯繫。
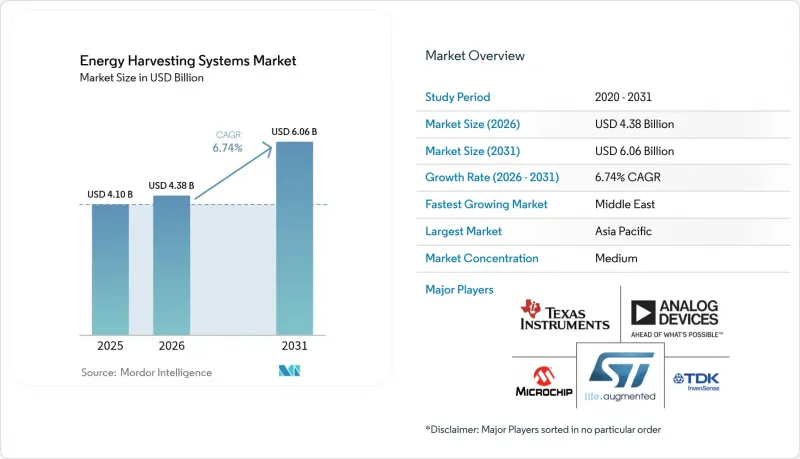
據 Mordor Intelligence 稱,能源採集系統市場預計到 2026 年價值 43.8 億美元,高於 2025 年的 41 億美元,預計到 2031 年將達到 60.6 億美元。
預計從 2026 年到 2031 年,其複合年成長率將達到 6.74%。
本報告按技術(能源採集、振動能源採集等)、組件(能源採集感測器、電源管理IC等)、功率範圍(小於10MW、10-100MW等)、應用(家用電子電器、建築及家庭自動化、工業IoT及自動化等)及地區細分。市場預測以美元計價。
全球能源採集系統市場趨勢及洞察
智慧建築中無電池物聯網感測器節點的普及
歐盟生態設計法規2024/1781強制要求商業建築使用節能控制系統,迫使建築管理人員部署無需電池的無線感測器。巴黎和奧維耶多的試點計畫在部署了太陽能和射頻供電的感測器後,平均降低了36.8千瓦的能耗。這些感測器能夠傳輸人員佔用和環境數據。射頻能量採集器可轉換10%至50%的環境能量,在受控的室內區域,轉換效率可達70%以上,從而確保感測器在建築物的整個生命週期內持續運作。隨著業主越來越關注總體擁有成本(TCO),並意識到更換三次電池的成本超過了感測器的初始硬體成本,向能源採集解決方案的轉變正在加速。隨著採購團隊將預算從維護轉向支援分析功能的硬體,商業房地產領域對能源採集系統市場的需求持續旺盛。
亞太地區工廠永續低功耗自動化
中國、日本和韓國的工業集團正在部署能源採集,以履行企業碳排放承諾並減少因更換電池而導致的意外停機時間。西班牙電信技術公司(Telefónica Tech)已在石油和氣體純化部署了經ATEX認證的熱電發電機,為電池供應受到嚴格限制的振動感測節點供電。韓國科學技術研究院(KIST)的研究人員開發了一種結合熱電效應和壓電效應的混合能源採集,可將重型設備監測的功率輸出提高50%以上。緊密的製造生態系統促進了試點部署,並實現了零件供應商之間的快速反饋循環,從而進一步降低了零件成本。隨著生產工廠的能源基準值在監管審計中變得越來越重要,企業高管正在推動在多個工廠地點實現能源採集平台的標準化,這進一步增強了區域合作的勢頭。
農村安裝環境中的環境射頻能量密度較低。
實地測試表明,70%的農民由於節點電池電量消耗過快而放棄了無線感測器的試點部署。在射頻密度低於可恢復水準的地區,這個問題更為嚴重。農業技術整合商目前正在採用將小型太陽能瓦片與灌溉泵浦上的振動感測器結合的系統,以應對陰天和射頻訊號弱的情況。然而,混合設計會增加成本並使維護計劃更加複雜,從而減緩了成本敏感型農場的廣泛採用。在農村通訊基礎設施建成之前,這項限制將限制能源採集系統市場在農業和環境監測領域的短期成長潛力。
細分市場分析
2025年,光伏能源採集系統將佔據能源採集系統市場41.65%的佔有率。其技術成熟度高、每瓦成本低,且晝夜能量變化規律可預測,確保光電系統仍是建築和戶外安裝的首選。同時,受5G密集部署帶來的環境電磁輻射日益增強的推動,射頻能量採集預計到2031年將達到10.62%的複合年成長率。振動和電磁能量電力源器應用於旋轉能量豐富的機械設備中,而熱席貝克元件則應用於汽車廢氣和工業爐等特定領域。結合多種方法的混合架構即使在光照或運動中斷的情況下也能實現持續供電,使其適用於關鍵任務應用情境。整合商正透過將智慧最大功率點追蹤(MPPT)與自適應儲能結合,最佳化波動電源的能源採集系統市場的韌性。
混合系統已有許多成功案例。 Ambient Photonics公司在200勒克斯的光照環境下,其輸出功率是傳統電池的三倍,從而實現了室內遙控器和鍵盤的製造。同時,韓國科學技術研究院(KIST)報告稱,透過在懸臂梁平台上整合熱電和壓電通道,輸出功率提高了50%。這些進步縮短了投資回收期,延長了運作保證,促使原始設備製造商(OEM)在其提案書中指定採用多源設計。隨著射頻能量採集效率的提高和組件價格的下降,能源採集系統市場將出現整合模組,這些模組能夠每隔幾毫秒自動選擇最高效的電源,以滿足負載需求。
到2025年,電源管理IC將佔能源採集系統市場以金額為準的37.40%,因為所有能源採集結構都需要精確的電壓調節和儲能控制。隨著設計人員不再侷限於單一電源架構,而是需要專用的轉換層,預計到2031年,能源採集感測器的複合年成長率將達到9.05%。薄膜電池和超級電容用於緩衝間歇性能量流,而超低功耗微控制器則進行分析,以驗證感測器的引入。意法半導體(STMicroelectronics)的SPV1050對光伏和熱電輸入實現了高達99%的轉換效率,顯示先進的電壓調節技術能夠延長節點壽命。旭化成(Asahi Kasei)的AP4413系列在1.43平方毫米的晶片上整合了電池均衡和涓流充電控制功能,為注重成本的消費性電子產品提供了能源採集解決方案。
產業發展藍圖正朝著晶片系統(SoC) 封裝方向發展,這種封裝將能源採集前端、升降壓轉換器和微控制器整合在單一多層基板上。這種整合消除了基板級互連造成的損耗,簡化了認證流程,並將目標應用場景從工業自動化擴展到智慧玩具。在預測期內,整合式電源管理積體電路 (PMIC) 的平均售價 (ASP) 下降將推動出貨量成長,並進一步鞏固能源採集系統市場。
區域分析
預計到2025年,亞洲將佔全球銷售額的34.70%,這主要得益於中國大規模的物聯網部署以及日本在壓電材料領域的領先地位,例如TDK株式會社(tdk.com)。從首爾到深圳,政府支持的智慧城市項目正在津貼感測器基礎設施建設,而台灣和馬來西亞的契約製造製造商則提供經濟高效的組裝工藝,縮短產品週期。韓國的半導體生態系統正在擴大其客製化電源管理積體電路(PMIC)的製造規模,而新加坡的物流園區正在測試大規模環境物聯網陣列,以驗證能量採集器在實際環境中的可靠性。
預計中東地區將擁有最快的成長軌跡,到2031年複合年成長率將達到8.78%。沙烏地阿拉伯的「2030願景」將可再生能源置於其特大城市規劃的核心地位,而Haram清真寺目前正在試驗壓電地地板材料,可以將朝聖者的腳步聲轉化為電能(doi.org)。波灣合作理事會(GCC)成員國的電力公司正在將太陽能收集器整合到智慧電錶外殼中,以避免機殼電池維護。以色列和阿拉伯聯合大公國(阿拉伯聯合大公國)處於區域研發集群的核心地位,叢集連接了奈米材料實驗室和風險投資基金,從而加速了高效能太陽能收集器的商業化進程。
在北美和歐洲,市場需求成熟且強勁,這得益於強調生命週期永續性的法規結構。美國能源局提議對充電器的待機功耗設定更嚴格的限制,鼓勵家電製造商轉型使用環保電源。在德國和英國,工廠的旋轉機械中正在安裝振動發電機,據稱這些設備在三到五年內可提高淨現值。在這些經濟體中,工程團隊在選擇感測器平台時,會量化其碳減排效果,這一趨勢使得能量能源採集系統市場訂單穩定,即使初始投資成本較高。
其他好處:
- Excel格式的市場預測(ME)表
- 3個月的分析師支持
目錄
第1章:引言
- 研究假設和市場定義
- 調查範圍
第2章:調查方法
第3章執行摘要
第4章 市場狀況
- 市場概覽
- 市場促進因素
- 智慧建築中無電池物聯網感測器節點的普及(歐洲和北美)
- 強制亞太地區工廠實施永續的低功耗自動化。
- 快速縮小超低功耗MCU的體積,以實現亞瓦級閾值電壓。
- 鐵路和飛機製造商無線狀態監控系統的擴展
- 將太陽能裝置整合到穿戴式裝置和醫療貼片中
- 市場限制因素
- 農村安裝環境中的環境射頻能量密度較低。
- 缺乏通用的電源管理標準
- 競爭性的 LPWAN 電池正在減少對車載能量採集器的需求。
- 運輸設備維修涉及較高的初始設計和整合成本。
- 價值供應鏈分析
- 監管和技術展望
- 波特五力分析
- 投資分析
第5章 市場規模與成長預測
- 透過技術
- 光能(陽光/太陽能)能源採集
- 振動(壓電和電磁)能源採集
- 熱能(席貝克/熱電)能源採集
- 射頻能源採集
- 混合/多源能源採集
- 按組件
- 能源採集能器
- 電源管理積體電路
- 儲能單元(薄膜電池、超級電容)
- 超低功耗感測器和微控制器
- 輸出範圍
- 小於10微瓦
- 10-100微瓦
- 100微瓦至1毫瓦
- 1-10毫瓦
- 超過10毫瓦
- 透過使用
- 家用電子產品
- 建築和家庭自動化
- 工業IoT和自動化
- 運輸
- 車
- 鐵路
- 航空
- 醫療保健穿戴式裝置
- 國防與安全
- 農業和環境監測
- 按地區
- 北美洲
- 美國
- 加拿大
- 墨西哥
- 歐洲
- 德國
- 英國
- 法國
- 義大利
- 西班牙
- 北歐國家(瑞典、挪威、丹麥、芬蘭)
- 比荷盧經濟聯盟(比利時、荷蘭、盧森堡)
- 亞太地區
- 中國
- 日本
- 印度
- 韓國
- 東協(新加坡、馬來西亞、泰國、印尼、菲律賓、越南)
- 南美洲
- 巴西
- 阿根廷
- 中東
- 沙烏地阿拉伯
- 阿拉伯聯合大公國
- 以色列
- 土耳其
- 非洲
- 南非
- 奈及利亞
- 肯亞
- 北美洲
第6章 競爭情勢
- 市場集中度
- 策略趨勢
- 市佔率分析
- 公司簡介
- Microchip Technology Inc.
- STMicroelectronics NV
- Texas Instruments Incorporated
- Analog Devices Inc.
- Renesas Electronics Corporation
- NXP Semiconductors NV
- onsemi(ON Semiconductor Corp.)
- TDK Corporation(InvenSense)
- Powercast Corporation
- Cymbet Corporation
- EnOcean GmbH
- e-peas SA
- ABB Ltd.
- Advanced Linear Devices Inc.
- Cap-XX Limited
- Fujitsu Components America Inc.
- G24 Power Ltd.
- Drayson Technologies Ltd.
- Piezo.com(Mide Technology)
- LORD MicroStrain(Parker Hannifin)
第7章 市場機會與未來展望
According to Mordor Intelligence, the energy harvesting systems market size in 2026 is estimated at USD 4.38 billion, growing from 2025 value of USD 4.10 billion with 2031 projections showing USD 6.06 billion, growing at 6.74% CAGR over 2026-2031.
This report is Segmented by Technology (Light Energy Harvesting, Vibration Energy Harvesting, and More), Component (Energy-Harvesting Transducers, Power-Management ICs, and More), Power Range (Less Than 10 MW, 10-100 MW, and More), Application (Consumer Electronics, Building and Home Automation, Industrial IoT and Automation, and More), Geography. The Market Forecasts are Provided in Terms of Value (USD).
Global Energy Harvesting Systems Market Trends and Insights
Proliferation of Battery-less IoT Sensor Nodes in Smart Buildings
The European Union Ecodesign Regulation 2024/1781 obliges commercial properties to use energy-efficient control systems, which pushes building managers toward battery-free wireless sensors Demonstrations in Paris and Oviedo logged 36.8 kW average power savings after integrating solar and RF-powered sensors that communicate occupancy and environmental data. RF harvesters convert 10-50% of ambient energy and more than 70% in tuned indoor zones, keeping sensors operational for the entire building life cycle. Facility owners increasingly weigh total cost of ownership and find that three battery replacement cycles eclipse initial sensor hardware costs, accelerating migration to harvesting solutions. As procurement teams pivot budgets from maintenance to analytics-ready hardware, the energy harvesting systems market gains sustained demand from the commercial real-estate sector.
Mandates for Sustainable Low-Power Automation in APAC Factories
Industrial groups across China, Japan, and South Korea install harvesters to satisfy corporate carbon pledges and cut unscheduled downtime tied to battery swaps. Telefonica Tech rolled out ATEX-certified thermoelectric generators that power vibration nodes in oil and gas refineries where battery access is tightly restricted. Researchers at the Korea Institute of Science and Technology combined thermoelectric and piezoelectric effects in a hybrid harvester that boosts power output by more than 50% for heavy-machinery monitoring. Dense manufacturing ecosystems allow quick feedback loops between pilot deployments and component suppliers, further trimming bill-of-materials cost. As regulatory audits emphasize energy baselines in production plants, executives increasingly standardize harvesting platforms across multiple factory sites, reinforcing regional momentum.
Low Energy Density of Ambient RF in Rural Installations
Field trials show that 70% of growers abandon wireless sensor pilots because nodes exhaust batteries faster than expected, a gap magnified where RF density dips below harvestable levels. Agritech integrators now blend small solar tiles with vibration strips on irrigation pumps to hedge against cloudy seasons and weak RF signals. Even so, hybrid designs raise costs and complicate maintenance schedules, delaying wide deployment in cost-sensitive farms. Until rural connectivity infrastructure expands, this restraint caps immediate upside for the energy harvesting systems market in agriculture and environmental monitoring.
Other drivers and restraints analyzed in the detailed report include:
- Rapid Miniaturization of Ultra-Low-Power MCUs Enabling Sub-µW Thresholds
- Growing Deployment of Wireless Condition-Monitoring in Rail & Aviation OEMs
- Absence of Universal Power-Management Standards
For complete list of drivers and restraints, kindly check the Table Of Contents.
Segment Analysis
Light-based photovoltaic harvesters controlled 41.65% of the energy harvesting systems market share in 2025. Superior maturity, low cost per watt, and predictable diurnal energy profiles keep photovoltaics in pole position for building and outdoor installations. RF harvesting, however, posts an 10.62% CAGR to 2031 as dense 5G deployments raise ambient electromagnetic levels that can be scavenged for sensor power. Vibration and electromagnetic harvesters serve machinery where rotational energy is plentiful, while thermal Seebeck devices find niches in automotive exhaust and industrial furnaces. Hybrid architectures that blend multiple modalities deliver continuity during light or motion lulls, appealing to mission-critical use cases. The energy harvesting systems market gains resilience as integrators pair intelligent maximum-power-point tracking with adaptive storage to optimize yield across variable sources.
Hybrid proof points abound. Ambient Photonics records triple the power output in 200 lux compared with legacy cells, unlocking indoor remote controls and keyboards. Meanwhile, the Korea Institute of Science and Technology reports a 50% power bump by merging thermoelectric and piezoelectric channels in a cantilever platform. These advances compress payback periods and extend uptime guarantees, encouraging original-equipment manufacturers to specify multi-source designs in request-for-proposal documents. As RF harvesting efficiency rises and component prices drop, the energy harvesting systems market will witness converged modules that auto-select the most productive source every few milliseconds to sustain load demands.
Power-management ICs captured 37.40% of the energy harvesting systems market size in 2025 by value because every harvester topology requires accurate voltage regulation and storage orchestration. Energy-harvesting transducers exhibit a 9.05% CAGR to 2031 as designers diversify beyond single-source architectures and need specialized conversion layers. Thin-film batteries and supercapacitors buffer intermittent energy streams, while ultra-low-power microcontrollers perform the analytics that justify sensor deployments. STMicroelectronics' SPV1050 achieves up to 99% conversion efficiency for photovoltaic and thermoelectric inputs, highlighting how sophisticated regulation extends node lifetimes. Asahi Kasei's AP4413 series integrates cell-balancing and trickle-charge control in a 1.43 mm2 die, bringing harvesting solutions to cost-sensitive consumer gadgets.
Industry roadmaps converge on system-on-chip packages that embed harvesting front ends, buck-boost converters, and microcontrollers within a single laminate. This consolidation removes board-level interconnect losses and simplifies certification, expanding addressable use cases from industrial automation to smart toys. Over the forecast window, falling ASPs for integration-ready PMICs will spur volume shipments, further fortifying the energy harvesting systems market.
Complete Report Scope:
- By Technology
- Light (Solar/Photovoltaic) Energy Harvesting
- Vibration (Piezoelectric and Electromagnetic) Energy Harvesting
- Thermal (Seebeck / Thermoelectric) Energy Harvesting
- RF (Radio-Frequency) Energy Harvesting
- Hybrid / Multi-Source Energy Harvesting
- By Component
- Energy-Harvesting Transducers
- Power-Management ICs
- Energy-Storage Units (Thin-Film Batteries, Supercapacitors)
- Ultra-Low-Power Sensors and MCUs
- By Power Range
- Less than 10 micro W
- 10-100 micro W
- 100 micro W-1 mW
- 1-10 mW
- Greater than 10 mW
- By Application
- Consumer Electronics
- Building and Home Automation
- Industrial IoT and Automation
- Transportation
- Automotive
- Rail
- Aviation
- Healthcare and Wearables
- Defense and Security
- Agriculture and Environmental Monitoring
- By Geography
- North America
- United States
- Canada
- Mexico
- Europe
- Germany
- United Kingdom
- France
- Italy
- Spain
- Nordics (Sweden, Norway, Denmark, Finland)
- Benelux (Belgium, Netherlands, Luxembourg)
- Asia-Pacific
- China
- Japan
- India
- South Korea
- ASEAN (Singapore, Malaysia, Thailand, Indonesia, Philippines, Vietnam)
- South America
- Brazil
- Argentina
- Middle East
- Saudi Arabia
- United Arab Emirates
- Israel
- Turkey
- Africa
- South Africa
- Nigeria
- Kenya
- North America
Geography Analysis
Asia held 34.70% of 2025 global revenue, benefiting from China's immense IoT roll-outs and Japan's leadership in piezoelectric materials through firms such as TDK Corporation tdk.com. Government-backed smart-city programs from Seoul to Shenzhen subsidize sensor infrastructure, while contract manufacturers in Taiwan and Malaysia offer cost-efficient assembly paths that shorten product cycles. South Korea's semiconductor ecosystem extends bespoke PMIC fabrication, and Singapore's logistics parks test large-scale ambient IoT arrays that showcase real-world harvester robustness.
The Middle East records the fastest trajectory at a 8.78% CAGR to 2031. Saudi Arabia's Vision 2030 positions renewable energy at the center of megacity planning, and indoor navigation beacons at the Al-Haram mosque now trial piezo tile flooring that converts pilgrim footsteps into grid power doi.org. Gulf Cooperation Council utilities integrate photovoltaic harvesters into smart-meter housings to avoid truck rolls for battery service. Israel and the United Arab Emirates anchor regional R&D clusters that pair nano-material labs with venture funds, accelerating commercialization timelines for high-efficiency harvesters.
North America and Europe show mature yet solid demand tied to regulatory frameworks that emphasize lifecycle sustainability. The United States Department of Energy proposes stricter standby limits for chargers, nudging appliance makers toward ambient power paths. Germany and the United Kingdom equip factories with vibration harvesters for rotating machinery, citing net present value gains over three to five years. Across these economies, engineering teams now quantify carbon abatement when selecting sensor platforms, a trend that channels steady orders into the energy harvesting systems market even where initial capital outlay is higher.
- Microchip Technology Inc.
- STMicroelectronics N.V.
- Texas Instruments Incorporated
- Analog Devices Inc.
- Renesas Electronics Corporation
- NXP Semiconductors N.V.
- onsemi (ON Semiconductor Corp.)
- TDK Corporation (InvenSense)
- Powercast Corporation
- Cymbet Corporation
- EnOcean GmbH
- e-peas S.A.
- ABB Ltd.
- Advanced Linear Devices Inc.
- Cap-XX Limited
- Fujitsu Components America Inc.
- G24 Power Ltd.
- Drayson Technologies Ltd.
- Piezo.com (Mide Technology)
- LORD MicroStrain (Parker Hannifin)
Additional Benefits:
- The market estimate (ME) sheet in Excel format
- 3 months of analyst support
TABLE OF CONTENTS
1 INTRODUCTION
- 1.1 Study Assumptions and Market Definition
- 1.2 Scope of the Study
2 RESEARCH METHODOLOGY
3 EXECUTIVE SUMMARY
4 MARKET LANDSCAPE
- 4.1 Market Overview
- 4.2 Market Drivers
- 4.2.1 Proliferation of Battery-less IoT Sensor Nodes in Smart Buildings (Europe and North America)
- 4.2.2 Mandates for Sustainable Low-Power Automation in APAC Factories
- 4.2.3 Rapid Miniaturization of Ultra-Low-Power MCUs Enabling Sub-W Thresholds
- 4.2.4 Growing Deployment of Wireless Condition-Monitoring in Rail and Aviation OEMs
- 4.2.5 Integration of Photovoltaic Harvesters into Wearables and Medical Patches
- 4.3 Market Restraints
- 4.3.1 Low Energy Density of Ambient RF in Rural Installations
- 4.3.2 Absence of Universal Power-Management Standards
- 4.3.3 Competing LPWAN Batteries Reducing Need for On-Board Harvesters
- 4.3.4 High Up-front Design-Integration Costs for Transportation Retrofits
- 4.4 Value / Supply-Chain Analysis
- 4.5 Regulatory and Technological Outlook
- 4.6 Porter's Five Forces Analysis
- 4.6.1 Bargaining Power of Suppliers
- 4.6.2 Bargaining Power of Buyers
- 4.6.3 Threat of New Entrants
- 4.6.4 Threat of Substitutes
- 4.6.5 Intensity of Competitive Rivalry
- 4.7 Investment Analysis
5 MARKET SIZE AND GROWTH FORECASTS (VALUE)
- 5.1 By Technology
- 5.1.1 Light (Solar/Photovoltaic) Energy Harvesting
- 5.1.2 Vibration (Piezoelectric and Electromagnetic) Energy Harvesting
- 5.1.3 Thermal (Seebeck / Thermoelectric) Energy Harvesting
- 5.1.4 RF (Radio-Frequency) Energy Harvesting
- 5.1.5 Hybrid / Multi-Source Energy Harvesting
- 5.2 By Component
- 5.2.1 Energy-Harvesting Transducers
- 5.2.2 Power-Management ICs
- 5.2.3 Energy-Storage Units (Thin-Film Batteries, Supercapacitors)
- 5.2.4 Ultra-Low-Power Sensors and MCUs
- 5.3 By Power Range
- 5.3.1 Less than 10 micro W
- 5.3.2 10-100 micro W
- 5.3.3 100 micro W-1 mW
- 5.3.4 1-10 mW
- 5.3.5 Greater than 10 mW
- 5.4 By Application
- 5.4.1 Consumer Electronics
- 5.4.2 Building and Home Automation
- 5.4.3 Industrial IoT and Automation
- 5.4.4 Transportation
- 5.4.4.1 Automotive
- 5.4.4.2 Rail
- 5.4.4.3 Aviation
- 5.4.5 Healthcare and Wearables
- 5.4.6 Defense and Security
- 5.4.7 Agriculture and Environmental Monitoring
- 5.5 By Geography
- 5.5.1 North America
- 5.5.1.1 United States
- 5.5.1.2 Canada
- 5.5.1.3 Mexico
- 5.5.2 Europe
- 5.5.2.1 Germany
- 5.5.2.2 United Kingdom
- 5.5.2.3 France
- 5.5.2.4 Italy
- 5.5.2.5 Spain
- 5.5.2.6 Nordics (Sweden, Norway, Denmark, Finland)
- 5.5.2.7 Benelux (Belgium, Netherlands, Luxembourg)
- 5.5.3 Asia-Pacific
- 5.5.3.1 China
- 5.5.3.2 Japan
- 5.5.3.3 India
- 5.5.3.4 South Korea
- 5.5.3.5 ASEAN (Singapore, Malaysia, Thailand, Indonesia, Philippines, Vietnam)
- 5.5.4 South America
- 5.5.4.1 Brazil
- 5.5.4.2 Argentina
- 5.5.5 Middle East
- 5.5.5.1 Saudi Arabia
- 5.5.5.2 United Arab Emirates
- 5.5.5.3 Israel
- 5.5.5.4 Turkey
- 5.5.6 Africa
- 5.5.6.1 South Africa
- 5.5.6.2 Nigeria
- 5.5.6.3 Kenya
- 5.5.1 North America
6 COMPETITIVE LANDSCAPE
- 6.1 Market Concentration
- 6.2 Strategic Moves
- 6.3 Market Share Analysis
- 6.4 Company Profiles {(includes Global level Overview, Market level overview, Core Segments, Financials as available, Strategic Information, Market Rank/Share for key companies, Products and Services, and Recent Developments)}
- 6.4.1 Microchip Technology Inc.
- 6.4.2 STMicroelectronics N.V.
- 6.4.3 Texas Instruments Incorporated
- 6.4.4 Analog Devices Inc.
- 6.4.5 Renesas Electronics Corporation
- 6.4.6 NXP Semiconductors N.V.
- 6.4.7 onsemi (ON Semiconductor Corp.)
- 6.4.8 TDK Corporation (InvenSense)
- 6.4.9 Powercast Corporation
- 6.4.10 Cymbet Corporation
- 6.4.11 EnOcean GmbH
- 6.4.12 e-peas S.A.
- 6.4.13 ABB Ltd.
- 6.4.14 Advanced Linear Devices Inc.
- 6.4.15 Cap-XX Limited
- 6.4.16 Fujitsu Components America Inc.
- 6.4.17 G24 Power Ltd.
- 6.4.18 Drayson Technologies Ltd.
- 6.4.19 Piezo.com (Mide Technology)
- 6.4.20 LORD MicroStrain (Parker Hannifin)
7 MARKET OPPORTUNITIES AND FUTURE OUTLOOK
- 7.1 White-space and Unmet-Need Assessment

 振動能源採集系統市場規模、佔有率和成長分析:按技術、組件、應用、終端用戶產業和地區分類 - 產業預測,2026-2033年
 能源採集型智慧玻璃市場分析及至2035年預測:按類型、產品、技術、組件、應用、材料類型、最終用戶、功能及安裝類型分類
 能源採集系統市場報告:趨勢、預測與競爭分析(至2035年)
 能源採集系統市場:按能源來源、組件、系統類型、輸出、部署方式和應用分類-全球市場預測(2026-2032 年)
 儲能奈米材料市場:預測至2034年-按奈米材料材料類型、儲能技術、應用、最終用戶和地區分類的全球分析壓電式能量採集市場預測至2034年-按元件類型、材料、應用、最終用戶和地區分類的全球分析先進能源採集材料市場預測至2034年—按材料類型、技術、外形規格、應用、最終用戶和地區分類的全球分析能源轉換材料市場預測至2034年-按材料類型、材料等級、形態、應用、最終用戶和地區分類的全球分析
 環境能源採集市場:規模、佔有率、成長、全球產業分析、區域趨勢及2026-2034年預測
 能量採集系統市場-全球產業規模、佔有率、趨勢、機會、預測:按技術、應用、組件、地區和競爭格局分類,2021-2031年