


 |
市場調查報告書
商品編碼
2121683
乙二醇:市場佔有率分析、產業趨勢與統計、成長預測(2026-2031)Monoethylene Glycol - Market Share Analysis, Industry Trends & Statistics, Growth Forecasts (2026 - 2031) |
||||||

※ 本網頁內容可能與最新版本有所差異。詳細情況請與我們聯繫。
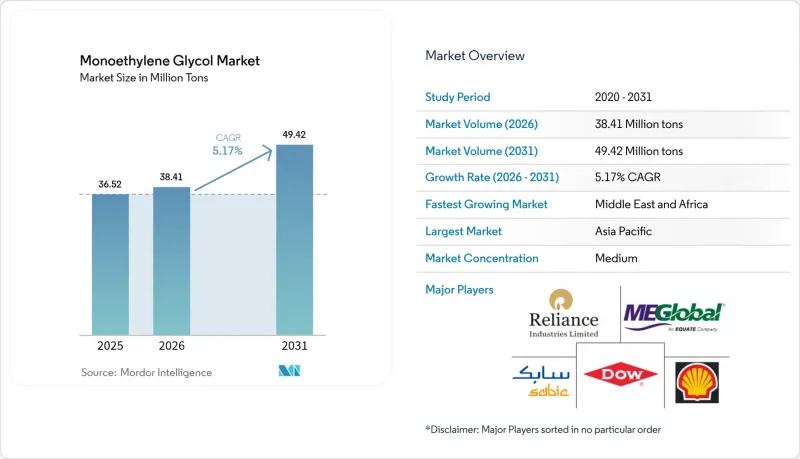
據 Mordor Intelligence 稱,2025 年乙二醇市場價值為 3,652 萬噸,預計到 2031 年將達到 4,942 萬噸,而 2026 年為 3,841 萬噸,預測期(2026-2031 年)複合年成長率為 5.17%。
本報告按應用領域(聚酯纖維、 寶特瓶、PET薄膜和片材、防凍劑、工業用途)、終端用戶行業(紡織服裝、包裝、汽車和運輸、塑膠、其他終端用戶行業)以及地區(亞太地區、北美地區、歐洲地區、南美地區、中東和非洲)進行細分。市場預測以噸為單位。
全球單乙二醇市場趨勢與洞察
PET包裝的需求正在激增。
消費品公司正轉向輕質回收包裝,這導致寶特瓶和容器中MEG的消耗量增加。諷刺的是,可口可樂公司2030年的再生材料目標反而刺激了對原生PET的需求,因為用於瓶子的rPET供應仍然無法滿足不斷成長的回收目標。電子商務的擴張也推高了需求,例如亞馬遜的「無挫包裝」計畫指定使用高阻隔阻隔性PET薄膜,以最大限度地提高體積效率和抗跌落性能。新興市場從玻璃到PET的轉變正在加速,已開發國家的高階飲料品牌則傾向於使用高透明度的MEG來改善其光學性能。用於乳製品和果汁的特殊多層瓶進一步拓展了MEG的應用範圍。總而言之,品牌所有者的永續發展目標更多地起到了推動對更高品質、高MEG含量等級產品需求的催化劑作用,而不是限制因素。
擴大亞太地區的聚酯纖維產能
中國紡織業的重組正在推動百萬噸級聚酯複合材料生產設施的發展,這些設施最佳化了乙二醇(MEG)的採購,並整合了電力、蒸氣和水等公用設施,從而降低了單位成本。印度的生產連結獎勵計畫計劃(PLI)專注於合成纖維,該計劃正在為當地煉油廠開拓新的市場,並增加從海灣國家的乙二醇進口。越南在貿易結構重組的推動下迅速崛起為服飾中心,這為鄰近的新加坡和泰國供應商創造了有利的需求基礎。同時,對化學回收的投資正在實施閉合迴路工藝,這些工藝需要原生乙二醇和再生乙二醇,從而確保了雙支柱成長。因此,乙二醇市場正受益於供應量的增加和產品組合的日益多樣化。
乙烯/原油原料價格波動
乙烯成本的波動正對利潤率構成壓力,尤其是在老舊的石腦油基裝置中。 2024年,布蘭特原油價格的波動直接影響了乙二醇的現金成本曲線。中東的一體化裝置享有原料供應的穩定性,而依賴進口的亞洲裝置則容易受到運費和外匯衝擊的影響,加劇價格波動。庫存管理的時機至關重要。擁有自有裂解裝置的製造商可以進行避險,但單一買家則面臨負價差的風險。在經濟下行週期,用於解決瓶頸問題的資本預算可能會被凍結,從而可能延遲效率提升。因此,乙二醇市場面臨短期價格波動,這給投資者情緒帶來了壓力。
細分市場分析
預計到2025年,聚酯纖維將佔銷售量的44.02%,鞏固其在乙二醇市場的主要銷售通路地位。中國高產能紡紗廠和南亞不斷擴張的業務確保了即使在服裝市場經濟波動時期,也能保持基本負載的需求。 PET薄膜和片材雖然規模較小,但由於電子包裝應用對厚度公差和阻隔性的嚴格要求,其複合年成長率仍達5.86%。連續流延技術的改進使得產品在保持機械強度的同時能夠做得更薄,從而提高了單位薄膜的乙二醇消耗量。防凍劑和工業應用的需求推動了利潤率的穩定成長, 寶特瓶在飲料業也正逐步取代玻璃瓶和鋁瓶。
專業化應用正在拓展價值創造的範圍。用於包裝零食、乳製品和營養補充劑的金屬化PET薄膜因其更長的保存期限而獲得高利潤率。在汽車內裝領域,覆以非動物皮革替代品飾面的PET基材正在幫助汽車製造商滿足永續發展標準。這些趨勢推高了下游產品的平均售價,抵消了原物料價格的波動,並支撐了乙二醇市場的長期盈利。此外,東南亞低缺陷率的PET片材生產線正在為韓國和日本的電子組裝製造商供貨,形成了一個完整的區域價值鏈,鞏固了長達三年的乙二醇供應合約。
區域分析
到2025年,亞太地區將佔全球產量的53.10%。這主要得益於中國寧波和海南的超大型聚酯產業叢集,以及印度製造地的擴張,後者又得益於生產關聯激勵計畫(PLI)。從煉油廠到聚酯工廠的一體化產業園區最佳化了物流和公用設施,使得每噸成本遠低於全球平均水準。越南、印尼和泰國正吸引尋求「中國+1」籌資策略的品牌進行更多投資,從而形成強大的區域需求網路。碳排放交易的合規性提高了營運標準,迫使中國的小規模企業進行整合,並使大型、節能的一體化工廠更具優勢。因此,亞太地區的乙二醇市場正享受著其他地區難以複製的規模經濟效益。
預計中東和非洲將錄得最高成長率,年複合成長率達5.98%,主要得益於沙烏地阿拉伯「2030願景」的多元化發展策略,該策略優先發展下游石化產品。廉價的乙烷原料、波灣合作理事會以及政府支持的基礎設施,使海灣合作理事會(GCC)成員國的生產商在向歐洲和非洲運輸產品方面擁有成本優勢。衣索比亞和埃及等非洲國家正開始建立紡織產業叢集,從沙烏地阿拉伯和阿曼進口乙二醇(MEG),從而形成循環供應鏈,並針對銷往歐盟的成品服飾簽訂了關稅豁免協議。儘管政治穩定和可靠的電力供應仍然是挑戰,但早期的成功表明該地區具有巨大的發展潛力。
北美和歐洲面臨著更嚴格的碳定價體系和一次性塑膠法規,但憑藉高價值的細分應用和先進的回收基礎設施,它們仍然發揮著至關重要的作用。美國頁岩氣正在推動具有成本競爭力的乙烯裂解裝置的發展,但德克薩斯州的用水限制可能會限制未來解決瓶頸問題的努力。歐盟的碳邊境調節機制將於2026年生效,該機制將對生產過程中產生的排放課稅,並可能使購買可再生能源認證的本地乙二醇生產商受益。這些措施將鼓勵國內對低碳乙二醇(例如生物基和二氧化碳衍生級乙二醇)的投資,從而在乙二醇市場中創造一個高階細分市場。
其他好處:
- Excel格式的市場預測(ME)表
- 3個月的分析師支持
目錄
第1章:引言
- 研究假設和市場定義
- 調查範圍
第2章:調查方法
第3章執行摘要
第4章 市場狀況
- 市場概覽
- 市場促進因素
- PET包裝的需求正在激增。
- 擴大亞太地區的聚酯纖維產能
- 汽車產業向電動汽車電子冷卻劑和導熱材料的過渡
- 一個致力於利用廉價乙烷生產乙二醇(MEG)的中東計畫。
- 間接二氧化碳製乙二醇轉化技術的商業化
- 市場限制因素
- 乙烯和原油等原料價格的波動
- 塑膠法規抑制了對原生PET的需求。
- 中國和歐盟對製程用水和碳排放強度的處罰
- 價值鏈分析
- 波特五力模型
第5章 市場規模與成長預測
- 透過使用
- 聚酯纖維
- 寶特瓶
- PET薄膜和片材
- 防凍液
- 產業
- 按最終用戶行業分類
- 紡織服裝
- 包裝
- 汽車和運輸業
- 塑膠
- 其他終端用戶產業(電子產品、油漆)
- 按地區
- 亞太地區
- 中國
- 印度
- 日本
- 韓國
- 其他亞太國家
- 北美洲
- 美國
- 加拿大
- 墨西哥
- 歐洲
- 德國
- 英國
- 義大利
- 法國
- 西班牙
- 其他歐洲國家
- 南美洲
- 巴西
- 阿根廷
- 其他南美國家
- 中東和非洲
- 沙烏地阿拉伯
- 南非
- 其他中東和非洲國家
- 亞太地區
第6章 競爭情勢
- 市場集中度
- 策略趨勢
- 市佔率和排名分析
- 公司簡介
- BASF
- China Petrochemical Corporation
- Dow
- Eastman Chemical Company
- Exxon Mobil Corporation
- Formosa Plastics Corporation
- Hengil Group Co., Ltd
- Huntsman International LLC
- India Glycols Limited
- Indorama Ventures Public Company Limited.
- LG Chem
- MEGlobal
- Mitsubishi Chemical Corporation
- NAN YA PLASTICS CORPORATION
- PTT Global Chemical Public Company Limited
- Reliance Industries Limited
- SABIC
- Shell plc
- Sustainea
第7章 市場機會與未來展望
According to Mordor Intelligence, the monoethylene glycol market size was valued at 36.52 million tons in 2025 and estimated to grow from 38.41 million tons in 2026 to reach 49.42 million tons by 2031, at a CAGR of 5.17% during the forecast period (2026-2031).
This report is Segmented by Application (Polyester Fibre, PET Bottles, PET Film and Sheets, Antifreeze, and Industrial), End-User Industry (Textile and Apparel, Packaging, Automotive and Transportation, Plastics, and Other End-User Industries), and Geography (Asia-Pacific, North America, Europe, South America, and Middle-East and Africa). The Market Forecasts are Provided in Terms of Volume (Tons).
Global Monoethylene Glycol Market Trends and Insights
PET Packaging Demand Surge
Consumer goods companies are pivoting toward lightweight, recyclable packaging, which increases MEG consumption through PET bottles and containers. Coca-Cola's goal of using recycled content by 2030 paradoxically lifts virgin PET demand because bottle-grade rPET availability still lags rising collection targets. E-commerce expansion adds volume as Amazon's Frustration-Free Packaging program specifies high-barrier PET films that maximize cube efficiency and drop resilience. Emerging markets are accelerating the shift from glass to PET, and premium beverage brands in developed countries are favoring clarifying-grade MEG that improves optical properties. Specialty multilayer bottles for dairy and juice further widen the application mix. Overall, brand-owner sustainability targets act less as demand dampeners and more as catalysts for higher-quality, MEG-intensive grades.
Polyester-Fiber Capacity Additions in Asia-Pacific
Consolidation in China's textile sector is driving the development of million-ton polyester complexes that optimize MEG procurement and integrate power, steam, and water utilities to achieve lower per-unit costs. India's Production Linked Incentive scheme commits to synthetic fiber, unlocking fresh offtake for local refineries and increasing inbound MEG cargoes from the Gulf. Vietnam's rapid ascendancy as a garment hub, spurred by trade realignment, adds demand nodes that favor nearby suppliers in Singapore and Thailand. Parallel investment in chemical recycling introduces a closed-loop pathway that requires both virgin and recycled MEG, ensuring dual-stream growth. As a result, the monoethylene glycol market benefits from both volume expansion and product-mix upgrades.
Volatile Ethylene/Crude Oil Feedstock Pricing
Ethylene cost swings compress margins, especially for older naphtha-based plants. Brent crude fluctuated in 2024, directly feeding MEG cash-cost curves. Integrated Middle Eastern complexes enjoy feedstock stability, whereas import-dependent Asian facilities are vulnerable to freight and currency shocks that amplify volatility. Inventory timing becomes critical; producers with internal cracker integration can hedge, while standalone buyers risk negative spreads. Capital budgets for debottlenecking pause during downcycles, potentially delaying efficiency upgrades. Consequently, the monoethylene glycol market faces near-term pricing turbulence that weighs on investment sentiment.
Other drivers and restraints analyzed in the detailed report include:
- Automotive Shift Toward E-Coolants and EV Thermal Fluids
- Middle-East On-Purpose MEG Projects Leveraging Cheap Ethane
- Anti-Plastic Regulations Curbing Virgin PET
For complete list of drivers and restraints, kindly check the Table Of Contents.
Segment Analysis
Polyester Fibre accounted for 44.02% of volume in 2025, cementing its role as the primary offtake channel for the monoethylene glycol market. High-throughput Chinese spinning mills and expanding South Asian operations secure base-load demand, even during apparel cycles. PET Film and Sheets, although smaller, posts a 5.86% CAGR thanks to electronics packaging that requires tight-tolerance thickness and superior barrier films. Continuous casting technology upgrades permit thinner gauges that still meet mechanical strength, thereby lifting MEG consumption per unit of film. Antifreeze and industrial uses add stable, margin-accretive volume, while PET Bottles show steady replacement of glass and aluminum in beverages.
Specialty applications broaden value capture. Metalized PET films for snack, dairy, and nutraceutical packaging fetch higher margins due to extended shelf-life performance. In automotive interiors, PET substrates laminated with vegan leather finishes help OEMs meet sustainability benchmarks. These developments raise the average selling price of downstream products, offsetting feedstock price swings and supporting the long-term profitability of the monoethylene glycol market. Furthermore, low-defect PET sheet lines in Southeast Asia supply South Korean and Japanese electronics assemblers, creating integrated regional value chains that lock in MEG supply contracts for up to three years.
Complete Report Scope:
- By Application
- Polyester Fibre
- PET Bottles
- PET Film and Sheets
- Antifreeze
- Industrial
- By End-User Industry
- Textile and Apparel
- Packaging
- Automotive and Transportation
- Plastics
- Other End-user Industries (Electronics, Paints)
- By Geography
- Asia-Pacific
- China
- India
- Japan
- South Korea
- Rest of Asia-pacific
- North America
- United States
- Canada
- Mexico
- Europe
- Germany
- United Kingdom
- Italy
- France
- Spain
- Rest of Europe
- South America
- Brazil
- Argentina
- Rest of South America
- Middle-East and Africa
- Saudi Arabia
- South Africa
- Rest of Middle-East and Africa
- Asia-Pacific
Geography Analysis
Asia-Pacific controlled 53.10% of global volume in 2025, powered by China's mega-scale polyester clusters in Ningbo and Hainan and India's PLI-driven manufacturing build-out. Integrated refinery-to-polyester parks streamline logistics and utilities, resulting in per-ton costs that are well below global averages. Vietnam, Indonesia, and Thailand capture incremental investments from brands seeking China-plus-one sourcing strategies, creating a robust regional mesh of demand centers. Emission-trading compliance raises operating thresholds, pushing smaller Chinese players toward consolidation and favoring large, energy-efficient complexes. Thus, the monoethylene glycol market in Asia-Pacific enjoys scale economies that are difficult for other regions to replicate.
The Middle East and Africa are projected to post the highest forecast growth at 5.98% CAGR, underpinned by Saudi Arabia's Vision 2030 diversification, which prioritizes downstream petrochemicals. Cheap ethane feedstock, access to deepwater ports, and state-backed infrastructure give Gulf Cooperation Council producers a shipping cost advantage in Europe and Africa. African nations, such as Ethiopia and Egypt, are beginning to build textile clusters that import MEG from Saudi Arabia and Oman, thereby closing the loop with duty-free agreements for finished garments destined for the EU. Political stability and reliable power remain challenges, yet early success stories demonstrate the region's scalability potential.
North America and Europe are facing stricter carbon-pricing regimes and single-use plastic rules, yet they remain relevant through high-value niche applications and sophisticated recycling infrastructure. U.S. shale gas unlocks cost-competitive ethylene crackers, although water-usage restrictions in states like Texas may constrain future debottlenecking efforts. The EU's Carbon Border Adjustment Mechanism, effective 2026, imposes levies on embedded emissions, potentially favoring local glycol producers who purchase renewable electricity certificates. These measures encourage domestic investment in low-carbon MEG variants, such as bio-based and CO2-derived grades, creating a premium tier within the monoethylene glycol market.
- BASF
- China Petrochemical Corporation
- Dow
- Eastman Chemical Company
- Exxon Mobil Corporation
- Formosa Plastics Corporation
- Hengil Group Co., Ltd
- Huntsman International LLC
- India Glycols Limited
- Indorama Ventures Public Company Limited.
- LG Chem
- MEGlobal
- Mitsubishi Chemical Corporation
- NAN YA PLASTICS CORPORATION
- PTT Global Chemical Public Company Limited
- Reliance Industries Limited
- SABIC
- Shell plc
- Sustainea
Additional Benefits:
- The market estimate (ME) sheet in Excel format
- 3 months of analyst support
TABLE OF CONTENTS
1 Introduction
- 1.1 Study Assumptions and Market Definition
- 1.2 Scope of the Study
2 Research Methodology
3 Executive Summary
4 Market Landscape
- 4.1 Market Overview
- 4.2 Market Drivers
- 4.2.1 PET packaging demand surge
- 4.2.2 Polyester-fiber capacity additions in Asia-Pacific
- 4.2.3 Automotive shift toward e-coolants and EV thermal fluids
- 4.2.4 Middle-East on-purpose MEG (Monoethylene Glycol) projects leveraging cheap ethane
- 4.2.5 Commercialisation of indirect CO2-to-MEG technologies
- 4.3 Market Restraints
- 4.3.1 Volatile ethylene/crude oil feedstock pricing
- 4.3.2 Anti-plastic regulations curbing virgin PET
- 4.3.3 Process-water and carbon intensity penalties in China and European Union
- 4.4 Value Chain Analysis
- 4.5 Porter's Five Forces
- 4.5.1 Bargaining Power of Suppliers
- 4.5.2 Bargaining Power of Buyers
- 4.5.3 Threat of New Entrants
- 4.5.4 Threat of Substitutes
- 4.5.5 Degree of Competition
5 Market Size and Growth Forecasts (Volume)
- 5.1 By Application
- 5.1.1 Polyester Fibre
- 5.1.2 PET Bottles
- 5.1.3 PET Film and Sheets
- 5.1.4 Antifreeze
- 5.1.5 Industrial
- 5.2 By End-User Industry
- 5.2.1 Textile and Apparel
- 5.2.2 Packaging
- 5.2.3 Automotive and Transportation
- 5.2.4 Plastics
- 5.2.5 Other End-user Industries (Electronics, Paints)
- 5.3 By Geography
- 5.3.1 Asia-Pacific
- 5.3.1.1 China
- 5.3.1.2 India
- 5.3.1.3 Japan
- 5.3.1.4 South Korea
- 5.3.1.5 Rest of Asia-pacific
- 5.3.2 North America
- 5.3.2.1 United States
- 5.3.2.2 Canada
- 5.3.2.3 Mexico
- 5.3.3 Europe
- 5.3.3.1 Germany
- 5.3.3.2 United Kingdom
- 5.3.3.3 Italy
- 5.3.3.4 France
- 5.3.3.5 Spain
- 5.3.3.6 Rest of Europe
- 5.3.4 South America
- 5.3.4.1 Brazil
- 5.3.4.2 Argentina
- 5.3.4.3 Rest of South America
- 5.3.5 Middle-East and Africa
- 5.3.5.1 Saudi Arabia
- 5.3.5.2 South Africa
- 5.3.5.3 Rest of Middle-East and Africa
- 5.3.1 Asia-Pacific
6 Competitive Landscape
- 6.1 Market Concentration
- 6.2 Strategic Moves
- 6.3 Market Share(%)/Ranking Analysis
- 6.4 Company Profiles (includes Global level Overview, Market level overview, Core Segments, Financials as available, Strategic Information, Market Rank/Share for key companies, Products and Services, and Recent Developments)
- 6.4.1 BASF
- 6.4.2 China Petrochemical Corporation
- 6.4.3 Dow
- 6.4.4 Eastman Chemical Company
- 6.4.5 Exxon Mobil Corporation
- 6.4.6 Formosa Plastics Corporation
- 6.4.7 Hengil Group Co., Ltd
- 6.4.8 Huntsman International LLC
- 6.4.9 India Glycols Limited
- 6.4.10 Indorama Ventures Public Company Limited.
- 6.4.11 LG Chem
- 6.4.12 MEGlobal
- 6.4.13 Mitsubishi Chemical Corporation
- 6.4.14 NAN YA PLASTICS CORPORATION
- 6.4.15 PTT Global Chemical Public Company Limited
- 6.4.16 Reliance Industries Limited
- 6.4.17 SABIC
- 6.4.18 Shell plc
- 6.4.19 Sustainea
7 Market Opportunities and Future Outlook
- 7.1 White-space and Unmet-need Assessment

 單乙二醇市場:依純度、應用、終端用戶產業及通路分類-2026-2032年全球市場預測
 2026-2034年全球單乙二醇市場規模、佔有率、趨勢和成長分析報告
 單乙二醇市場:按應用、終端用戶產業和地區分類。
 全球單乙二醇市場報告(2026 年)
 全球單乙二醇市場:依等級及應用分析 - 市場規模、產業動態、機會分析及預測(2026-2035)
 乙二醇市場-全球產業規模、佔有率、趨勢、機會與預測,按應用、最終用途、地區和競爭細分,2020-2030 年
 單乙二醇的全球市場:各用途,各終端用戶業界,各地區,機會,預測,2018年~2032年
 單乙二醇 (MEG) 的全球市場 (2015-2030年):工廠生產能力、生產量、運作效率、供需數量、終端用戶產業、銷售管道、地區需求、企業佔有率、國際貿易