


 |
市場調查報告書
商品編碼
2121663
資料中心UPS:市場佔有率分析、產業趨勢與統計及成長預測(2026-2031)Data Center UPS - Market Share Analysis, Industry Trends & Statistics, Growth Forecasts (2026 - 2031) |
||||||

※ 本網頁內容可能與最新版本有所差異。詳細情況請與我們聯繫。
根據 Mordor Intelligence 預測,資料中心 UPS 的市場規模預計將在 2026 年達到 44.8 億美元,到 2031 年達到 64.6 億美元,複合年成長率為 7.59%。
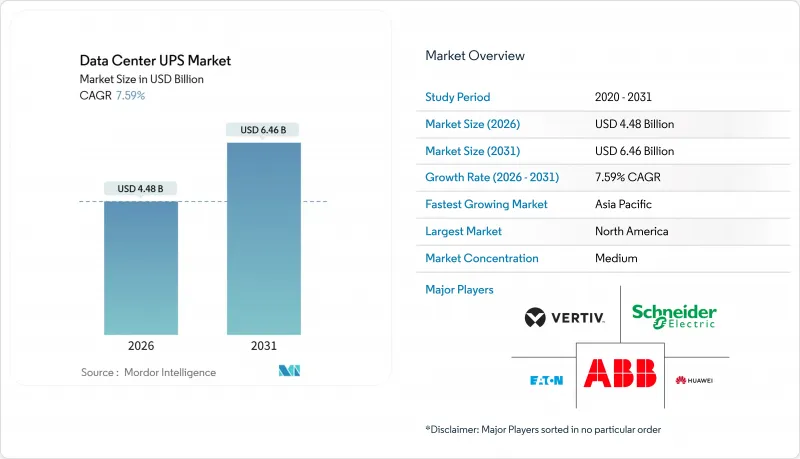
本報告按UPS類型(備用式、線上互動式等)、功率容量(20 kVA以下等)、架構(集中式等)、電池類型(VRLA鉛酸電池、鋰離子電池等)、等級(Tier 1、Tier 2、Tier 3、Tier 4)、資料中心規模(小規模、中型資料等)、數位中心和地區類型(等據點)和地區進行細分中心。市場預測以美元(USD)計價。
全球資料中心UPS市場趨勢及洞察
超大規模資料中心的建設正在加速,越來越多的設施容量超過 10 兆瓦。
預計到2025年,超大規模業者將運作47個容量超過10兆瓦的園區,年增38%,從而形成一個持續多年的UPS採購計畫。典型的園區設計部署4到6組2-3兆伏安的UPS,單筆合約金額超過1500萬美元,便於供應商定製冷卻介面和電池機殼配置。鑑於北維吉尼亞和新加坡的電力公司目前表示併網等待時間為36-48個月,開發商正在指定使用配備柴油旋轉備用電源的UPS設備,以應對持續數小時的停電。模組化機架可以以500千伏安為增量進行擴展,使建造者能夠隨著伺服器機架的部署分階段進行資本支出,從而減少因閒置容量造成的損失。歐盟和印度與主權人工智慧相關的法規正在進一步加速5-8兆瓦規模設施的部署,並將超大規模設施的覆蓋範圍擴展到傳統的北美地區之外。
AI 和 ML 工作負載的功率密度正在飆升:每個機架超過 20 kW。
到2026年,訓練叢集的功率密度將超過每機架100千瓦,遠遠超過兩年前15-20千瓦的標準。這種巨大的轉變迫使UPS製造商重新設計其配電單元,以處理400安培的持續電流而不會出現電壓降。由於長銅線造成的電阻損耗,集中式機房難以應付如此高密度的環境,這加速了安裝在負載10公尺範圍內的柱式模組的轉變。晶片級液冷消除了風扇的寄生電力消耗,使營運商能夠將UPS的額定容量降低高達20%。鋰離子電池的能量密度為250瓦時/公升(相較之下,VRLA電池的能量密度為80瓦時/公升),從而縮小了面積,釋放了機架空間並降低了每機架的UPS成本。日益成長的複雜性加劇了技能差距,促使買家選擇包含安裝、試運行和遠端監控的承包工程合約。
雙轉換情況下,初始資本支出(CAPEX)約高出 35%。
採用雙級逆變器和大型散熱器的雙轉換系統比線上互動式UPS貴約35%,這給力求達到Tier III標準的企業帶來了沉重的資本預算壓力。目前,租賃方案將UPS容量打包成服務,透過將資本支出(CAPEX)轉化為營運支出(OPEX)來降低採用門檻,但新興市場的利率仍超過10%,阻礙了其廣泛應用。模組化機架可以以100-500 kVA為增量進行擴展,允許買家推遲資本支出,但由於韌體不一致和負載平衡邏輯等互通性問題,可能會暴露出潛在的可靠性風險。低成本的中國進口產品提供了一種替代方案,但對智慧財產權和售後服務的擔憂限制了其在亞太地區以外地區的普及。因此,價格差異限制了資料中心UPS市場中預算敏感型使用者的潛在目標群體。
細分市場分析
模組化和平行冗餘機架預計將以 8.13% 的複合年成長率成長,超過資料中心 UPS 市場的整體成長速度。雙轉換在線式 UPS 仍將主導市場,在 2025 年將佔據 44.65% 的市場佔有率,滿足 Tier III 和 Tier IV 機房對無縫容錯移轉轉移的需求。線上互動式 UPS 產品在小規模企業的伺服器機房中佔有一席之地,其 40% 的成本優勢彌補了諧波失真和較短的運作。同時,備用 UPS 被廣泛部署在邊緣機櫃中,以滿足對超低資本支出 (Capex) 的需求。旋轉式和飛輪式 UPS 適用於柴油發電機起火後運轉時間不超過 20 秒的場所,雖然機械結構複雜,但電池維護成本較高。
隨著機架密度不斷提高,採購決策正朝著模組化方向發展,因為資料中心的負載在一個租賃週期內可能從 500 kVA 飆升至 2 MVA。能夠以 100-500 kVA 為增量進行點擊式擴展的機架,避免了在 30% 負載下運作出現的效率下降,並提高了年度電源使用效率 (PUE)。軟體定義控制層可以調節負載平衡,但這會帶來韌體管理風險,需要營運商進行審計。因此,模組化設計與按需功率測量的託管租賃模式一起,正持續獲得廣泛應用。
預計到2025年,容量超過200 kVA的系統將佔總銷售額的52.23%,並且到2031年將維持8.56%的複合年成長率,高於整體市場成長率。人工智慧訓練叢集(每個機架功率超過100 kW)對並聯UPS組的持續需求,凸顯了大型機架系統的經濟優勢。
21–200 kVA 等級的設備適用於企業和區域託管機房,這些機房的功率密度通常低於每機架 15 kW。 20 kVA 以下的設備則安裝在零售和電信行業的邊緣節點,但由於伺服器機架整合式電源模組無需外置機櫃,因此面臨價格壓力。企業站點向兆瓦級園區的整合進一步增加了對更大功率機架的需求。
即使到了2025年,集中式機房仍佔46.21%的市場佔有率,但隨著營運商追求更高的能源效率和更快的維修速度,分散式架構正以8.72%的複合年成長率快速擴張。將UPS模組放置在距離負載10公尺以內,可減少高達5%的銅纜損耗。
另一方面,Tier IV設施仍然傾向於採用2N+1集中式佈局,這種佈局簡化了認證審核。在分階段擴建中,分散式設計更具優勢,因為初始設備安裝可以從單排開始,從而可以將40-60%的UPS資本投資推遲到租戶需求真正出現時再進行。在現有設施的維修中,考慮到下沉式交換器和母線槽的成本,通常會保留集中式機房。
區域分析
北美地區,尤其是北維吉尼亞、矽谷和達拉斯-沃斯堡地區,擁有大量超大規模資料中心,預計到2025年將佔全球收入的39.43%。然而,由於土地稀缺和公共產業長達48個月的等待期,投資者的目光轉向了鳳凰城、亞特蘭大和哥倫布等城市,北美地區的成長速度正在放緩。加拿大憑藉其豐富的水力資源和涼爽的氣候吸引超大規模資料中心超大規模資料中心業者,但跨境資料監管使得工作負載部署到美國變得複雜。墨西哥正致力於蒙特雷和克雷塔羅的電網升級,以滿足近岸外包的需求。到2025年,鋰離子電池的普及率將超過40%,凸顯了企業日益關注總擁有成本(TCO)的趨勢。該地區擁有超過120個認證機房,並且是全球採用Tier IV標準的領先地區。
亞太地區預計將以9.02%的複合年成長率成長。中國二線城市憑藉低成本的可再生能源吸引了大量建設項目,而一線大都會圈則面臨能源供應上限。印度的資料中心託管需求激增,主要受數位支付成長和強制性資料在地化推動,但每月4-6小時的停電迫使企業對UPS系統進行過度設計。新加坡部分取消了2019年設定的2024年建設上限,但僅限於電源使用效率(PUE)低於1.3的設施。日本和澳洲擁有成熟的三線城市基礎設施,但土地資源匱乏,加速了模組化UPS機架的普及。東南亞,尤其是馬來西亞和印度尼西亞,行動商務推動了邊緣運算需求,部署主要集中在20-100 kVA頻寬。
到2025年,歐洲將佔全球人工智慧支出的約25%,但在一些城市建設暫停令限制水和電力分配的地區,成長速度正在放緩。將於2026年生效的碳邊境調節機制將對高碳排放零件的供應鏈進行懲罰,引導採購流向斯堪的斯堪地那維亞和德國的可再生能源運作工廠。政府主導的人工智慧應用強制令正在加速四級基礎設施的建設,促進了斯德哥爾摩和米蘭等二線城市的經濟成長。英國正受惠於脫歐後的數據監管政策,而南歐則利用太陽能和廉價土地來與傳統樞紐城市競爭。南美洲規模仍然小規模,但巴西的數據主權法和智利的綠色能源正在吸引早期參與企業。中東地區正透過100億美元的區域人工智慧中心撥款加速成長,而非洲的主導中心則集中在南非和奈及利亞,電信業者正在這些國家建立邊緣基礎設施。
其他好處:
- Excel格式的市場預測(ME)表
- 3個月的分析師支持
目錄
第1章:引言
- 研究假設和市場定義
- 調查範圍
第2章:調查方法
第3章執行摘要
第4章 市場狀況
- 市場概覽
- 市場促進因素
- 超大規模資料中心的建置正在加速,容量為 10 MW 或以上的設施數量正在增加。
- 零售和電信產業邊緣微型資料中心的激增。
- 超大規模資料中心業者的碳中和採購義務
- 在 500 kVA 或以上的 UPS 系統中,鋰離子 TCO 比 VRLA 具有優越性。
- AI/ML 工作負載的功率密度正在迅速增加(每個機架 20 kW 或更多)。
- 新興市場強制性三級以上運轉率標準
- 市場限制因素
- 雙倍轉換法的初始資本投資溢價(約35%)
- 有關併網儲能的法規仍處於起步階段。
- 電力電子元件供應鏈波動
- 歐盟主要城市資料中心暫停用水和能源使用
- 產業價值鏈分析
- 監理情勢
- 技術展望
- 波特五力分析
- 宏觀經濟因素對市場的影響
第5章 市場規模與成長預測
- 不同類型的UPS
- 支援
- 行交互類型
- 雙轉換在線
- 模組化/並行冗餘
- 旋轉式和飛輪式
- 按功率容量
- 20千伏安或以下
- 21~200 kVA
- 超過200千伏安
- 以建築學為例
- 集中
- 分佈式(行級別)
- 模組化和可擴展類型
- 依電池類型
- 鉛酸蓄電池(VRLA)
- 鋰離子
- 鎳、鎘及其他
- 層級類型
- 一級和二級
- 三級
- 第四級
- 按資料中心規模
- 小規模資料中心
- 中型資料中心
- 大型資料中心
- 超大規模資料中心
- 依資料中心類型
- 託管資料中心
- 超大規模資料中心業者資料中心/雲端服務供應商
- 企業和邊緣資料中心
- 按地區
- 北美洲
- 美國
- 加拿大
- 墨西哥
- 南美洲
- 巴西
- 智利
- 阿根廷
- 其他南美國家
- 歐洲
- 英國
- 德國
- 法國
- 義大利
- 西班牙
- 其他歐洲國家
- 亞太地區
- 中國
- 日本
- 印度
- 新加坡
- 澳洲
- 馬來西亞
- 其他亞太國家
- 中東和非洲
- 中東
- 阿拉伯聯合大公國
- 沙烏地阿拉伯
- 土耳其
- 其他中東國家
- 非洲
- 南非
- 奈及利亞
- 其他非洲國家
- 中東
- 北美洲
第6章 競爭情勢
- 市場集中度
- 策略趨勢
- 市佔率分析
- 公司簡介
- ABB Ltd
- Schneider Electric SE
- Eaton Corporation plc
- Vertiv Holdings Co.
- Huawei Technologies Co. Ltd.
- Power Innovations International LLC
- Mitsubishi Electric Corp.
- Riello Elettronica SpA
- SOCOMEC Group SA
- Piller Power Systems GmbH
- Toshiba Corp.
- Gamatronic(SolarEdge Technologies Inc.)
- Delta Electronics Inc.
- Kohler Co.
- Legrand SA
- Socomec UPS India Pvt Ltd.
- Caterpillar Inc.
- AEG Power Solutions BV
- Tripp Lite(Eaton)
- Kehua Tech Co. Ltd.
第7章 市場機會與未來展望
According to Mordor Intelligence, the data center UPS market size stood at USD 4.48 billion in 2026 and is projected to reach USD 6.46 billion by 2031, reflecting a 7.59% CAGR.
This report is Segmented by UPS Type (Standby, Line-Interactive, and More), Power Capacity (<=20 KVA, and More), Architecture (Centralized, and More), Battery Type (Lead-Acid VRLA, Lithium-Ion, and More), Tier Type (Tier 1 and 2, Tier 3, and Tier 4), Data Center Size (Small, Medium, and More), Data Center Type (Colocation, and More), and Geography. The Market Forecasts are Provided in Terms of Value (USD).
Global Data Center UPS Market Trends and Insights
Hyperscale Data-Center Build-Outs Accelerating >=10 MW Facilities
Hyperscale operators commissioned 47 campuses above 10 MW in 2025, a 38% annual jump that locks in multi-year UPS procurement pipelines. Typical site designs deploy four to six 2-3 MVA strings, creating single-contract values of USD 15 million or more and spurring vendor customization of cooling interfaces and battery enclosure formats. Utilities in Northern Virginia and Singapore now quote interconnection queues of 36-48 months, so developers specify UPS units with diesel rotary backup to bridge multi-hour grid outages. Modular frames that scale in 500 kVA steps let builders phase capital alongside server rack deployments, trimming idle capacity losses. Sovereign-AI rules in the European Union and India add another wave of 5-8 MW installations, broadening the hyperscale footprint beyond legacy North American hubs.
AI and ML Workload Power-Density Surge >=20 kW per Rack
Training clusters exceeded 100 kW per rack in 2026, eclipsing the 15-20 kW norm seen just two years earlier. This step-change forces UPS makers to redesign power distribution units capable of carrying 400 A continuous currents without voltage sag. Centralized rooms struggle at these densities because long copper runs incur resistive losses, catalyzing a shift to row-level modules situated within 10 m of the load. Direct-to-chip liquid cooling eliminates parasitic fan power, enabling operators to downsize rated UPS capacity by up to 20%. Floor-space savings from lithium-ion batteries, which pack 250 Wh/l compared with 80 Wh/l for VRLA, free up extra rack positions and reduce per-rack UPS cost. The complexity uptick widens a skills gap, steering buyers toward turnkey contracts that bundle installation, commissioning, and remote monitoring.
Upfront CAPEX Premium ~35% of Double-Conversion Topology
Double-conversion systems cost roughly 35% more than line-interactive models because they employ dual inverter stages and larger heat sinks, stretching capital budgets for enterprises targeting Tier III compliance. Leasing programs now package UPS capacity as a service, converting capex into opex and easing adoption, but finance rates in emerging markets still exceed 10%, dampening uptake. Modular frames that scale in 100-500 kVA blocks let buyers defer cash, yet interoperability issues such as mismatched firmware or load-sharing logic can expose hidden reliability risks. Lower-priced Chinese imports offer an alternative, but concerns around intellectual property and after-sales support curb penetration outside Asia-Pacific. The price gap therefore limits the addressable segment of the data center UPS market among budget-sensitive owners.
Other drivers and restraints analyzed in the detailed report include:
- Edge Micro-Data-Center Proliferation in Retail and Telecom
- Lithium-Ion TCO Advantage Over VRLA in >=500 kVA UPS
- Supply-Chain Volatility for Power Electronic Components
For complete list of drivers and restraints, kindly check the Table Of Contents.
Segment Analysis
Modular and parallel-redundant frames are set to expand at an 8.13% CAGR, outrunning the broader data center UPS market. Double-conversion online units still dominate with a 44.65% share in 2025, anchored in Tier III and Tier IV halls that need seamless failover. Line-interactive products retain a niche in small-enterprise rooms because their 40% cost advantage compensates for harmonic distortion and shorter runtime, while standby units populate edge cabinets, chasing ultra-low capex. Rotary and flywheel designs serve facilities that demand sub-20s ride-through for diesel generator fire, trading battery maintenance for mechanical complexity.
Rising rack densities tilt the procurement calculus toward modularity because data hall load can jump from 500 kVA to 2 MVA inside a single lease cycle. Frames that click in 100-500 kVA increments avoid the efficiency penalty of operating at 30% load, lifting annualized power-usage effectiveness. Software-defined control layers orchestrate load-sharing, but they introduce firmware-management risk that operators must audit. As a result, modular penetration continues to climb in tandem with colocation leasing models that meter power on demand.
Systems above 200 kVA represented 52.23% of 2025 revenue and are forecast to post an 8.56% CAGR to 2031, ahead of overall market velocity. AI training clusters exceeding 100 kW per rack routinely require parallel UPS strings, validating the economics of large-frame systems.
The 21-200 kVA tier underpins enterprise and regional colocation halls, where power density remains below 15 kW per rack. Sub-20 kVA units inhabit edge nodes in retail and telecom and face price compression from server-rack-integrated cartridges that eliminate the need for external cabinets. Consolidation of enterprise sites into megawatt campuses further swells demand for large frames.
Centralized halls still held a 46.21% share in 2025, but distributed architectures are advancing at an 8.72% CAGR as operators hunt for energy savings and faster repairs. Positioning UPS modules within 10 m of the load cuts copper losses by up to 5%.
Tier IV facilities, however, continue to prefer 2N+1 centralized layouts that simplify certification audits. Phased buildouts reward distributed designs because initial fit-out can start with a single row, deferring 40-60% of UPS capital until tenant demand materializes. Retrofit sites often stick with centralized rooms, given sunk costs in switchgear and busway.
Complete Report Scope:
- By UPS Type
- Standby
- Line-Interactive
- Double-Conversion On-Line
- Modular / Parallel-Redundant
- Rotary and Flywheel
- By Power Capacity
- <=20 kVA
- 21-200 kVA
- >200 kVA
- By Architecture
- Centralized
- Distributed (Row-Level)
- Modular Scalable
- By Battery Type
- Lead-Acid (VRLA)
- Lithium-Ion
- Nickel-Cadmium and Others
- By Tier Type
- Tier 1 and 2
- Tier 3
- Tier 4
- By Data Center Size
- Small Data Center
- Medium Data Center
- Large Data Center
- Hyperscale Data Center
- By Data Center Type
- Colocation Data Center
- Hyperscalers Data Center/CSPs
- Enterprise and Edge Data Center
- By Geography
- North America
- United States
- Canada
- Mexico
- South America
- Brazil
- Chile
- Argentina
- Rest of South America
- Europe
- United Kingdom
- Germany
- France
- Italy
- Spain
- Rest of Europe
- Asia-Pacific
- China
- Japan
- India
- Singapore
- Australia
- Malaysia
- Rest of Asia-Pacific
- Middle East and Africa
- Middle East
- United Arab Emirates
- Saudi Arabia
- Turkey
- Rest of Middle East
- Africa
- South Africa
- Nigeria
- Rest of Africa
- Middle East
- North America
Geography Analysis
North America controlled 39.43% of 2025 revenue thanks to hyperscale density in Northern Virginia, Silicon Valley, and Dallas-Fort Worth. Growth moderates as land scarcity and 48-month utility queues push investors toward Phoenix, Atlanta, and Columbus. Canada uses hydroelectric surplus and cool weather to attract hyperscalers, yet cross-border data rules complicate U.S. workload placement. Mexico eyes grid upgrades in Monterrey and Queretaro to capture nearshoring demand. Lithium-ion penetration exceeded 40% of 2025 installs, underscoring TCO priorities. The region leads Tier IV adoption with more than 120 certified halls.
Asia-Pacific is set for a 9.02% CAGR as China's tier-2 cities entice builds with cheap renewable power while tier-1 metros face energy caps. India's colocation surge rides on digital payment growth and data-localization mandates, though 4-6-hour monthly grid outages force oversizing of UPS strings. Singapore partially lifted its 2019 build cap in 2024, but only for facilities that achieve power-usage effectiveness below 1.3. Japan and Australia maintain mature Tier III footprints but wrestle with land scarcity that favors modular UPS frames. Southeast Asia, particularly Malaysia and Indonesia, sees edge demand tied to mobile commerce, with deployments clustering in the 20-100 kVA band.
Europe accounted for roughly 25% of global spend in 2025, yet growth slows where city moratoriums cap water or power allocations. The Carbon Border Adjustment Mechanism effective 2026 penalizes carbon-heavy component supply chains, nudging procurement toward renewable-powered fabs in Scandinavia and Germany. Sovereign-AI mandates accelerate Tier IV builds, boosting secondary metros like Stockholm and Milan. The United Kingdom benefits from post-Brexit data rules, while Southern Europe leverages solar power and cheaper land to rival historic hubs. South America stays sub-scale, though Brazil's data-sovereignty law and Chile's green energy draw early movers. The Middle East accelerates with USD 10 billion earmarked for regional AI hubs, and Africa's pockets of growth center on South Africa and Nigeria where telecom-led edge builds take root.
- ABB Ltd
- Schneider Electric SE
- Eaton Corporation plc
- Vertiv Holdings Co.
- Huawei Technologies Co. Ltd.
- Power Innovations International LLC
- Mitsubishi Electric Corp.
- Riello Elettronica S.p.A
- SOCOMEC Group S.A.
- Piller Power Systems GmbH
- Toshiba Corp.
- Gamatronic (SolarEdge Technologies Inc.)
- Delta Electronics Inc.
- Kohler Co.
- Legrand SA
- Socomec UPS India Pvt Ltd.
- Caterpillar Inc.
- AEG Power Solutions BV
- Tripp Lite (Eaton)
- Kehua Tech Co. Ltd.
Additional Benefits:
- The market estimate (ME) sheet in Excel format
- 3 months of analyst support
TABLE OF CONTENTS
1 INTRODUCTION
- 1.1 Study Assumptions and Market Definition
- 1.2 Scope of the Study
2 RESEARCH METHODOLOGY
3 EXECUTIVE SUMMARY
4 MARKET LANDSCAPE
- 4.1 Market Overview
- 4.2 Market Drivers
- 4.2.1 Hyperscale Data-Center Build-Outs Accelerating >=10 MW Facilities
- 4.2.2 Edge Micro-Data-Center Proliferation in Retail and Telecom
- 4.2.3 Carbon-Neutral Procurement Mandates by Hyperscalers
- 4.2.4 Lithium-Ion TCO Advantage Over VRLA in >=500 kVA UPS
- 4.2.5 AI / ML Workload Power-Density (>=20 kW / Rack) Surge
- 4.2.6 Mandatory Tier III+ Uptime Compliance in Emerging Markets
- 4.3 Market Restraints
- 4.3.1 Upfront CAPEX Premium (≈35 %) of Double-Conversion Topology
- 4.3.2 Grid-Interactive Energy-Storage Regulations Still Nascent
- 4.3.3 Supply-Chain Volatility for Power Electronic Components
- 4.3.4 Data-Center Moratoriums on Water / Energy Use in EU Metros
- 4.4 Industry Value Chain Analysis
- 4.5 Regulatory Landscape
- 4.6 Technological Outlook
- 4.7 Porter's Five Forces Analysis
- 4.7.1 Bargaining Power of Suppliers
- 4.7.2 Bargaining Power of Buyers
- 4.7.3 Threat of New Entrants
- 4.7.4 Threat of Substitutes
- 4.7.5 Intensity of Competitive Rivalry
- 4.8 Impact of Macroeconomic Factors on the Market
5 MARKET SIZE AND GROWTH FORECASTS (VALUE)
- 5.1 By UPS Type
- 5.1.1 Standby
- 5.1.2 Line-Interactive
- 5.1.3 Double-Conversion On-Line
- 5.1.4 Modular / Parallel-Redundant
- 5.1.5 Rotary and Flywheel
- 5.2 By Power Capacity
- 5.2.1 <=20 kVA
- 5.2.2 21-200 kVA
- 5.2.3 >200 kVA
- 5.3 By Architecture
- 5.3.1 Centralized
- 5.3.2 Distributed (Row-Level)
- 5.3.3 Modular Scalable
- 5.4 By Battery Type
- 5.4.1 Lead-Acid (VRLA)
- 5.4.2 Lithium-Ion
- 5.4.3 Nickel-Cadmium and Others
- 5.5 By Tier Type
- 5.5.1 Tier 1 and 2
- 5.5.2 Tier 3
- 5.5.3 Tier 4
- 5.6 By Data Center Size
- 5.6.1 Small Data Center
- 5.6.2 Medium Data Center
- 5.6.3 Large Data Center
- 5.6.4 Hyperscale Data Center
- 5.7 By Data Center Type
- 5.7.1 Colocation Data Center
- 5.7.2 Hyperscalers Data Center/CSPs
- 5.7.3 Enterprise and Edge Data Center
- 5.8 By Geography
- 5.8.1 North America
- 5.8.1.1 United States
- 5.8.1.2 Canada
- 5.8.1.3 Mexico
- 5.8.2 South America
- 5.8.2.1 Brazil
- 5.8.2.2 Chile
- 5.8.2.3 Argentina
- 5.8.2.4 Rest of South America
- 5.8.3 Europe
- 5.8.3.1 United Kingdom
- 5.8.3.2 Germany
- 5.8.3.3 France
- 5.8.3.4 Italy
- 5.8.3.5 Spain
- 5.8.3.6 Rest of Europe
- 5.8.4 Asia-Pacific
- 5.8.4.1 China
- 5.8.4.2 Japan
- 5.8.4.3 India
- 5.8.4.4 Singapore
- 5.8.4.5 Australia
- 5.8.4.6 Malaysia
- 5.8.4.7 Rest of Asia-Pacific
- 5.8.5 Middle East and Africa
- 5.8.5.1 Middle East
- 5.8.5.1.1 United Arab Emirates
- 5.8.5.1.2 Saudi Arabia
- 5.8.5.1.3 Turkey
- 5.8.5.1.4 Rest of Middle East
- 5.8.5.2 Africa
- 5.8.5.2.1 South Africa
- 5.8.5.2.2 Nigeria
- 5.8.5.2.3 Rest of Africa
- 5.8.5.1 Middle East
- 5.8.1 North America
6 COMPETITIVE LANDSCAPE
- 6.1 Market Concentration
- 6.2 Strategic Moves
- 6.3 Market Share Analysis
- 6.4 Company Profiles (includes Global Level Overview, Market Level Overview, Core Segments, Financials as available, Strategic Information, Market Rank/Share, Products and Services, Recent Developments)
- 6.4.1 ABB Ltd
- 6.4.2 Schneider Electric SE
- 6.4.3 Eaton Corporation plc
- 6.4.4 Vertiv Holdings Co.
- 6.4.5 Huawei Technologies Co. Ltd.
- 6.4.6 Power Innovations International LLC
- 6.4.7 Mitsubishi Electric Corp.
- 6.4.8 Riello Elettronica S.p.A
- 6.4.9 SOCOMEC Group S.A.
- 6.4.10 Piller Power Systems GmbH
- 6.4.11 Toshiba Corp.
- 6.4.12 Gamatronic (SolarEdge Technologies Inc.)
- 6.4.13 Delta Electronics Inc.
- 6.4.14 Kohler Co.
- 6.4.15 Legrand SA
- 6.4.16 Socomec UPS India Pvt Ltd.
- 6.4.17 Caterpillar Inc.
- 6.4.18 AEG Power Solutions BV
- 6.4.19 Tripp Lite (Eaton)
- 6.4.20 Kehua Tech Co. Ltd.
7 MARKET OPPORTUNITIES AND FUTURE OUTLOOK
- 7.1 White-Space and Unmet-Need Assessment

 資料中心UPS市場規模及預測(2021-2034年),全球及區域佔有率、趨勢及成長機會分析報告:按資料中心規模、產品、最終用戶及地區細分
 資料中心UPS市場報告:按組件類型、電池技術、容量、等級分類、資料中心規模、最終用途領域和地區分類(2026-2034年)
 全球資料中心UPS市場規模、佔有率、趨勢和成長分析報告(2026-2034年)
 2026年全球資料中心不斷電系統(UPS)市場報告
 資料中心不斷電系統(UPS)市場:按類型、設計類型、容量、組件、部署模式、最終用戶和分銷管道分類-2026年至2032年全球預測
 資料中心UPS市場分析及預測(至2035年):依類型、產品、服務、技術、組件、應用、部署、最終使用者、功能及安裝類型分類2026年全球資料中心不斷電系統(UPS)市場報告
 備用式UPS系統市場-全球產業規模、佔有率、趨勢、機會及預測(依容量、應用、地區及競爭格局分類,2021-2031年)資料中心UPS市場 - 全球產業規模、佔有率、趨勢、機會、預測:按產量、拓樸結構、應用、地區和競爭格局分類,2021-2031年資料中心UPS市場規模、佔有率、成長、全球產業分析:依類型、應用、區域洞察與預測(2026-2034)