


 |
市場調查報告書
商品編碼
2121572
智慧工廠:市場佔有率分析、產業趨勢及統計、成長預測(2026-2031)Smart Factory - Market Share Analysis, Industry Trends & Statistics, Growth Forecasts (2026 - 2031) |
||||||

※ 本網頁內容可能與最新版本有所差異。詳細情況請與我們聯繫。
據 Mordor Intelligence 稱,2025 年智慧工廠市場價值為 3855.5 億美元,預計到 2031 年將達到 6758.2 億美元,而 2026 年為 4266.6 億美元,2026 年至 2031 年預測期內的複合成長率為 9.64%。
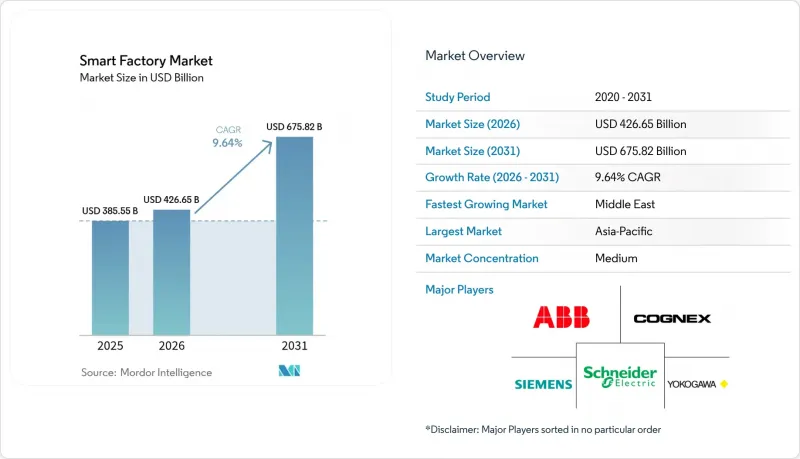
本報告按產品類型(機器視覺系統、工業機器人、控制設備、感測器、通訊技術及其他產品類型)、技術(PLM、HMI、ERP、MES、DCS、SCADA 及其他)、終端用戶產業(汽車、半導體、石油天然氣及其他)、部署方式(本地部署、雲端部署)和地區進行細分。市場預測以美元計價。
全球智慧工廠市場趨勢與洞察
擴大工業IoT平台的應用
工業IoT平台將來自PLC、監控系統和ERP層的資料整合到一個統一的儲存庫中。西門子計畫在2025年在其MindSphere雲端平台上連接超過120萬個資產,比2024年成長40%。運行在時間敏感型網路上的OPC統一架構邊緣閘道器現在支援亞毫秒延遲,使預測演算法能夠將意外停機時間減少25%至35%。基於訂閱的定價模式將資本支出轉化為營運成本,從而為中小製造商的採用打開了大門。因此,一個支援人工智慧(AI)、數位孿生和自主工作流程的部署基礎已經建立起來。
擴大政府對智慧製造的獎勵
從北京到利雅得,各國政府的金融計畫正在抵銷自動化帶來的風險。中國已撥款2,000億元人民幣(約280億美元)用於2024年至2026年間的智慧製造升級。沙烏地阿拉伯的「2030願景」計畫在2025年累計150億沙烏地裡亞爾(約40億美元)用於石化和採礦設施建設。印度的生產連結獎勵計畫計畫(PLI)為自動化設備累計6%至8%的補貼。美國和德國的加速折舊政策正在縮短中小企業的投資回收期,並提高即使在資金受限領域,自動化設備的採用率也得到了提升。
細分市場分析
2025年,工業機器人佔智慧工廠市場銷售額的28.41%,在產品類型中佔最大市場。同時,協作機器人正以10.27%的複合年成長率快速成長,預計到2031年,其在智慧工廠市場的佔有率將繼續擴大,這主要得益於汽車和製藥業對生產線靈活、無圍欄自動化的偏好。根據優傲機器人公司(Universal Robots)預測,2025年中小企業採用協作機器人的比例年增35%。
在這種互補的設備架構中,控制組件實現精確的運動控制,而多模態感測器則產生用於狀態監控的即時資料流。諸如 EtherCAT 之類的有線協議主導確定性運動控制,而 5G 則支援行動平台和改裝應用場景。硬體、軟體和整合服務正在融合,形成一個全端解決方案,從而提升設備的生命週期價值。
儘管製造執行系統 (MES) 在 2025 年的支出佔比仍高達 24.18%,但高級分析和人工智慧 (AI) 平台的複合年成長率 (CAGR) 為 10.31%,這表明智慧工廠市場規模正迅速轉移到客製化軟體。 SAP 的「數位化製造雲」預計到 2025 年將擁有超過 800 家客戶。
分散式控制系統和PLC在即時循環中仍然至關重要,而承載容器化應用的邊緣控制器則正在推動混合工作負載的發展。擴增實境(AR)介面縮短了平均修復時間(MTTR),數位孿生模擬器則縮短了試運行週期。開放API(應用程式介面)是一項關鍵的競爭優勢,它決定了新模組的部署速度。
區域分析
預計到2025年,亞太地區將佔全球智慧工廠銷售額的43.19%,成為該地區最大的智慧工廠市場。中國「中國製造2025」計畫的補貼、日本「社會5.0」計畫下協作機器人(cobot)的優惠待遇,以及韓國對顯示器和半導體產業的津貼,都在推動該地區智慧工廠支出的成長。印度的「生產連結獎勵計畫計畫(PLI)」進一步促進了電子和製藥業的發展。在澳洲和紐西蘭,工業IoT網路在偏遠地區採礦作業中的應用,凸顯了該地區智慧工廠市場的廣闊前景。
在北美,重點在於維修現有設施並投資新型電動車和電池。美國《晶片與科學法案》已撥款520億美元用於半導體自動化,而墨西哥正在崛起為汽車和航太供應商的近岸外包中心。加拿大正在為航太和採礦項目提供聯合融資,重點關注減排,這凸顯了其對永續性的承諾。
歐洲正大力投資工業4.0互通性。德國的「工業4.0平台」將於2025年發布開放標準,加速供應商之間的整合。英國和法國專注於製藥和航太領域,而義大利和西班牙則致力於振興食品加工廠。中東地區雖然規模較小,但卻是成長最快的地區,年複合成長率高達9.96%,這得益於沙烏地阿拉伯的「2030願景」和阿拉伯聯合大公國的自由區激勵政策。南美洲和非洲的發展相對滯後,但在汽車、紙漿和採礦領域也取得了顯著進展。
其他好處:
- Excel格式的市場預測(ME)表
- 3個月的分析師支持
目錄
第1章:引言
- 市場分析與定義的前提條件
- 分析範圍
第2章 分析方法
第3章執行摘要
第4章 市場狀況
- 市場概覽
- 市場促進因素
- 擴大工業IoT平台的應用
- 端到端能源最佳化的需求
- 政府加強對智慧製造的支持力度
- 邊緣AI晶片可實現即時品管。
- 開放原始碼數位孿生技術可降低整合成本。
- 抗量子加密技術正在增強OEM廠商的信心。
- 市場限制因素
- 棕地改造需要大量的初始資本投入。
- OT網路中的網路安全漏洞
- OT和IT領域具備互通性的人員短缺
- 機器人執行器所需的稀土元素供應不穩定。
- 圍繞工業數據主權的監管不確定性
- 產業價值鏈分析
- 宏觀經濟因素對市場的影響
- 監理情勢
- 技術展望
- 波特五力分析
第5章:預測市場規模與成長率
- 依產品類型
- 機器視覺系統
- 相機
- 處理器
- 軟體
- 機殼
- 影像擷取卡
- 整合服務
- 照明
- 工業機器人
- 關節機器人
- 笛卡兒坐標機器人
- 圓柱座標式機器人
- SCARA機器人
- 並聯機器人
- 協作式工業機器人
- 控制設備
- 繼電器開關
- 伺服馬達驅動
- 感應器
- 通訊科技
- 有線
- 無線的
- 其他產品類型
- 機器視覺系統
- 透過技術
- 產品生命週期管理 (PLM)
- 人機介面 (HMI)
- ERP(企業資源計畫)
- MES(製造執行系統)
- DCS(分散式控制系統)
- SCADA(監控與資料收集)
- PLC(可程式邏輯控制器)
- 進階分析和人工智慧平台
- 其他技術
- 按最終用戶行業分類
- 車
- 半導體
- 石油和天然氣
- 化工/石油化工
- 製藥
- 航太/國防
- 食品/飲料
- 礦業
- 其他終端用戶產業
- 透過部署方法
- 現場
- 基於雲端的
- 按地區
- 北美洲
- 美國
- 加拿大
- 墨西哥
- 南美洲
- 巴西
- 阿根廷
- 其他南美國家
- 歐洲
- 德國
- 英國
- 法國
- 義大利
- 其他歐洲國家
- 亞太地區
- 中國
- 日本
- 印度
- 韓國
- 澳洲和紐西蘭
- 其他亞太國家
- 中東
- 沙烏地阿拉伯
- 阿拉伯聯合大公國
- 土耳其
- 其他中東國家
- 非洲
- 南非
- 奈及利亞
- 肯亞
- 其他非洲國家
- 北美洲
第6章 競爭情勢
- 市場集中度
- 策略趨勢
- 市佔率分析
- 公司簡介
- Siemens AG
- ABB Ltd
- Schneider Electric SE
- Rockwell Automation Inc.
- Honeywell International Inc.
- Mitsubishi Electric Corporation
- Fanuc Corporation
- Emerson Electric Co.
- Yokogawa Electric Corporation
- KUKA AG
- Cognex Corporation
- Robert Bosch GmbH
- Teledyne FLIR LLC
- General Electric Company
- Cisco Systems Inc.
- SAP SE
- PTC Inc.
- Dassault Systemes SE
- Intel Corporation
- Hewlett Packard Enterprise Company
- Keyence Corporation
- Omron Corporation
- Universal Robots A/S
- Johnson Controls International plc
第7章 市場機會與未來展望
According to Mordor Intelligence, the smart factory market size was valued at USD 385.55 billion in 2025 and estimated to grow from USD 426.66 billion in 2026 to reach USD 675.82 billion by 2031, at a CAGR of 9.64% during the forecast period 2026-2031.
This report is Segmented by Product Type (Machine Vision Systems, Industrial Robotics, Control Devices, Sensors, Communication Technologies, and More Product Types), Technology (PLM, HMI, ERP, MES, DCS, SCADA, and More), End-User Industry (Automotive, Semiconductors, Oil and Gas, and More), Deployment Model (On-Premise, and Cloud-Based), and Geography. The Market Forecasts are Provided in Terms of Value (USD).
Global Smart Factory Market Trends and Insights
Growing Adoption of Industrial IoT Platforms
Industrial Internet of Things platforms are consolidating data from programmable logic controllers, supervisory systems, and enterprise resource planning layers into single repositories. Siemens connected more than 1.2 million assets on its MindSphere cloud in 2025, a 40% jump from 2024. Edge gateways running OPC Unified Architecture over time-sensitive networking now handle sub-millisecond latency, so predictive algorithms can trim unplanned downtime by 25-35%. Subscription pricing also converts capital outlay into operating expense, widening access among small manufacturers. The result is an installed base ready for artificial intelligence, digital twins, and autonomous workflows.
Rising Government Incentives for Smart Manufacturing
Fiscal programs from Beijing to Riyadh offset automation risk. China earmarked CNY 200 billion (USD 28 billion) for intelligent manufacturing upgrades during 2024-2026. Saudi Arabia's Vision 2030 set aside SAR 15 billion (USD 4 billion) in 2025 for petrochemical and mining facilities, and India's Production Linked Incentive scheme extends 6-8% rebates on automation equipment. Accelerated depreciation rules in the United States and Germany shorten payback periods for small and medium enterprises, lifting adoption rates in otherwise capital-constrained segments.
Other drivers and restraints analyzed in the detailed report include:
- Demand for End-to-End Energy Optimisation
- Edge AI Chips Enabling Real-Time Quality Control
For complete list of drivers and restraints, kindly check the Table Of Contents.
Segment Analysis
Industrial robotics captured 28.41% of 2025 revenue, giving it the largest smart factory market share among product categories. Cobots, however, are expanding at 10.27% CAGR and are projected to capture a growing slice of the smart factory market size through 2031 as automotive and pharmaceutical lines favour flexible, uncaged automation. Universal Robots reported 35% year-over-year cobot growth in small and medium enterprises during 2025.
Across complementary devices, control components deliver precise actuation, and multi-modal sensors create real-time data streams for conditional monitoring. Wired protocols such as EtherCAT dominate deterministic motion, while 5G supports mobile platforms and retrofit scenarios. Hardware, software, and integration services are converging into full-stack offerings that extend lifecycle value.
Manufacturing execution systems accounted for 24.18% of 2025 spending, but advanced analytics and artificial intelligence platforms are growing at a 10.31% CAGR, indicating a rapid reallocation of the smart factory market size toward prescriptive software. SAP's Digital Manufacturing Cloud added more than 800 customers in 2025.
Distributed control systems and programmable logic controllers remain indispensable for real-time loops, yet edge controllers that host containerized applications enable hybrid workloads. Augmented-reality interfaces reduce mean-time-to-repair, and digital twin simulators cut commissioning timelines. Open application programming interfaces dictate how quickly new modules can be deployed, shaping competitiveness.
Complete Report Scope:
- By Product Type
- Machine Vision Systems
- Cameras
- Processors
- Software
- Enclosures
- Frame Grabbers
- Integration Services
- Lighting
- Industrial Robotics
- Articulated Robots
- Cartesian Robots
- Cylindrical Robots
- SCARA Robots
- Parallel Robots
- Collaborative Industry Robots
- Control Devices
- Relays and Switches
- Servo Motors and Drives
- Sensors
- Communication Technologies
- Wired
- Wireless
- Other Product Types
- Machine Vision Systems
- By Technology
- Product Lifecycle Management (PLM)
- Human Machine Interface (HMI)
- Enterprise Resource Planning (ERP)
- Manufacturing Execution System (MES)
- Distributed Control System (DCS)
- Supervisory Control and Data Acquisition (SCADA)
- Programmable Logic Controller (PLC)
- Advanced Analytics and AI Platforms
- Other Technologies
- By End-User Industry
- Automotive
- Semiconductors
- Oil and Gas
- Chemical and Petrochemical
- Pharmaceutical
- Aerospace and Defense
- Food and Beverage
- Mining
- Other End-User Industries
- By Deployment Model
- On-Premise
- Cloud-based
- By Geography
- North America
- United States
- Canada
- Mexico
- South America
- Brazil
- Argentina
- Rest of South America
- Europe
- Germany
- United Kingdom
- France
- Italy
- Rest of Europe
- Asia-Pacific
- China
- Japan
- India
- South Korea
- Australia and New Zealand
- Rest of Asia-Pacific
- Middle East
- Saudi Arabia
- United Arab Emirates
- Turkey
- Rest of Middle East
- Africa
- South Africa
- Nigeria
- Kenya
- Rest of Africa
- North America
Geography Analysis
Asia-Pacific contributed 43.19% of 2025 revenue, making it the largest regional block within the smart factory market. China's Made in China 2025 subsidies, Japan's Society 5.0 cobot incentives, and South Korea's display and semiconductor grants collectively amplify spending. India's Production Linked Incentive schemes add momentum in electronics and pharmaceuticals. Australia and New Zealand apply Industrial Internet of Things networks to remote mining, highlighting the region's breadth.
North America combines brownfield retrofits with greenfield electric vehicle and battery investments. The United States CHIPS and Science Act directs USD 52 billion into semiconductor automation, and Mexico emerges as a nearshoring magnet for automotive and aerospace suppliers. Canada co-funds aerospace and mining projects that emphasize emissions reduction, underscoring a sustainability tilt.
Europe invests in Industry 4.0 interoperability. Germany's Plattform Industrie 4.0 published open standards in 2025, accelerating vendor integration. The United Kingdom and France target pharmaceutical and aerospace lines, while Italy and Spain revitalize food processing plants. The Middle East, though smaller, is the fastest-growing region at 9.96% CAGR, underpinned by Saudi Vision 2030 and United Arab Emirates free-zone incentives. South America and Africa trail but showcase focused deployments in automotive, pulp, and mining.
- Siemens AG
- ABB Ltd
- Schneider Electric SE
- Rockwell Automation Inc.
- Honeywell International Inc.
- Mitsubishi Electric Corporation
- Fanuc Corporation
- Emerson Electric Co.
- Yokogawa Electric Corporation
- KUKA AG
- Cognex Corporation
- Robert Bosch GmbH
- Teledyne FLIR LLC
- General Electric Company
- Cisco Systems Inc.
- SAP SE
- PTC Inc.
- Dassault Systemes SE
- Intel Corporation
- Hewlett Packard Enterprise Company
- Keyence Corporation
- Omron Corporation
- Universal Robots A/S
- Johnson Controls International plc
Additional Benefits:
- The market estimate (ME) sheet in Excel format
- 3 months of analyst support
TABLE OF CONTENTS
1 INTRODUCTION
- 1.1 Study Assumptions and Market Definition
- 1.2 Scope of the Study
2 RESEARCH METHODOLOGY
3 EXECUTIVE SUMMARY
4 MARKET LANDSCAPE
- 4.1 Market Overview
- 4.2 Market Drivers
- 4.2.1 Growing Adoption of Industrial IoT Platforms
- 4.2.2 Demand for End-to-End Energy Optimisation
- 4.2.3 Rising Government Incentives for Smart Manufacturing
- 4.2.4 Edge AI Chips Enabling Real-Time Quality Control
- 4.2.5 Open-Source Digital Twins Lowering Integration Cost
- 4.2.6 Quantum-Safe Encryption Boosting OEM Trust (Under-the-Radar)
- 4.3 Market Restraints
- 4.3.1 High Upfront CAPEX for Brownfield Transformation
- 4.3.2 Cybersecurity Vulnerabilities within OT Networks
- 4.3.3 Shortage of Interoperable OT-IT Talent
- 4.3.4 Volatile Rare-Earth Supply for Robotics Actuators
- 4.3.5 Regulatory Uncertainty Around Industrial Data Sovereignty (Under-the-Radar)
- 4.4 Industry Value-Chain Analysis
- 4.5 Impact of Macroeconomic Factors on the Market
- 4.6 Regulatory Landscape
- 4.7 Technological Outlook
- 4.8 Porter's Five Forces Analysis
- 4.8.1 Bargaining Power of Suppliers
- 4.8.2 Bargaining Power of Buyers
- 4.8.3 Threat of New Entrants
- 4.8.4 Threat of Substitute Products
- 4.8.5 Intensity of Competition
5 MARKET SIZE AND GROWTH FORECASTS (VALUE)
- 5.1 By Product Type
- 5.1.1 Machine Vision Systems
- 5.1.1.1 Cameras
- 5.1.1.2 Processors
- 5.1.1.3 Software
- 5.1.1.4 Enclosures
- 5.1.1.5 Frame Grabbers
- 5.1.1.6 Integration Services
- 5.1.1.7 Lighting
- 5.1.2 Industrial Robotics
- 5.1.2.1 Articulated Robots
- 5.1.2.2 Cartesian Robots
- 5.1.2.3 Cylindrical Robots
- 5.1.2.4 SCARA Robots
- 5.1.2.5 Parallel Robots
- 5.1.2.6 Collaborative Industry Robots
- 5.1.3 Control Devices
- 5.1.3.1 Relays and Switches
- 5.1.3.2 Servo Motors and Drives
- 5.1.4 Sensors
- 5.1.5 Communication Technologies
- 5.1.5.1 Wired
- 5.1.5.2 Wireless
- 5.1.6 Other Product Types
- 5.1.1 Machine Vision Systems
- 5.2 By Technology
- 5.2.1 Product Lifecycle Management (PLM)
- 5.2.2 Human Machine Interface (HMI)
- 5.2.3 Enterprise Resource Planning (ERP)
- 5.2.4 Manufacturing Execution System (MES)
- 5.2.5 Distributed Control System (DCS)
- 5.2.6 Supervisory Control and Data Acquisition (SCADA)
- 5.2.7 Programmable Logic Controller (PLC)
- 5.2.8 Advanced Analytics and AI Platforms
- 5.2.9 Other Technologies
- 5.3 By End-User Industry
- 5.3.1 Automotive
- 5.3.2 Semiconductors
- 5.3.3 Oil and Gas
- 5.3.4 Chemical and Petrochemical
- 5.3.5 Pharmaceutical
- 5.3.6 Aerospace and Defense
- 5.3.7 Food and Beverage
- 5.3.8 Mining
- 5.3.9 Other End-User Industries
- 5.4 By Deployment Model
- 5.4.1 On-Premise
- 5.4.2 Cloud-based
- 5.5 By Geography
- 5.5.1 North America
- 5.5.1.1 United States
- 5.5.1.2 Canada
- 5.5.1.3 Mexico
- 5.5.2 South America
- 5.5.2.1 Brazil
- 5.5.2.2 Argentina
- 5.5.2.3 Rest of South America
- 5.5.3 Europe
- 5.5.3.1 Germany
- 5.5.3.2 United Kingdom
- 5.5.3.3 France
- 5.5.3.4 Italy
- 5.5.3.5 Rest of Europe
- 5.5.4 Asia-Pacific
- 5.5.4.1 China
- 5.5.4.2 Japan
- 5.5.4.3 India
- 5.5.4.4 South Korea
- 5.5.4.5 Australia and New Zealand
- 5.5.4.6 Rest of Asia-Pacific
- 5.5.5 Middle East
- 5.5.5.1 Saudi Arabia
- 5.5.5.2 United Arab Emirates
- 5.5.5.3 Turkey
- 5.5.5.4 Rest of Middle East
- 5.5.6 Africa
- 5.5.6.1 South Africa
- 5.5.6.2 Nigeria
- 5.5.6.3 Kenya
- 5.5.6.4 Rest of Africa
- 5.5.1 North America
6 COMPETITIVE LANDSCAPE
- 6.1 Market Concentration
- 6.2 Strategic Moves
- 6.3 Market Share Analysis
- 6.4 Company Profiles (includes Global Level Overview, Market Level Overview, Core Segments, Financials as available, Strategic Information, Market Rank/Share, Products and Services, Recent Developments)
- 6.4.1 Siemens AG
- 6.4.2 ABB Ltd
- 6.4.3 Schneider Electric SE
- 6.4.4 Rockwell Automation Inc.
- 6.4.5 Honeywell International Inc.
- 6.4.6 Mitsubishi Electric Corporation
- 6.4.7 Fanuc Corporation
- 6.4.8 Emerson Electric Co.
- 6.4.9 Yokogawa Electric Corporation
- 6.4.10 KUKA AG
- 6.4.11 Cognex Corporation
- 6.4.12 Robert Bosch GmbH
- 6.4.13 Teledyne FLIR LLC
- 6.4.14 General Electric Company
- 6.4.15 Cisco Systems Inc.
- 6.4.16 SAP SE
- 6.4.17 PTC Inc.
- 6.4.18 Dassault Systemes SE
- 6.4.19 Intel Corporation
- 6.4.20 Hewlett Packard Enterprise Company
- 6.4.21 Keyence Corporation
- 6.4.22 Omron Corporation
- 6.4.23 Universal Robots A/S
- 6.4.24 Johnson Controls International plc
7 MARKET OPPORTUNITIES AND FUTURE OUTLOOK
- 7.1 White-Space and Unmet-Need Assessment

 2026-2030年全球智慧工廠市場
 智慧工廠市場報告:趨勢、預測和競爭分析(至2035年)
 智慧工廠市場預測至2034年:按組件、技術、應用、最終用戶和地區分類的全球分析智慧工廠連接市場預測至2034年—按組件、連接技術、部署模式、應用、最終用戶和地區分類的全球分析
 智慧工廠市場:按組件、技術、連接方式、企業規模、部署類型、應用領域和最終用途分類-2026-2032年全球市場預測
 智慧工廠市場規模、佔有率和成長分析:按組件、技術、應用、部署模式、最終用戶產業、企業規模和地區分類-2026-2033年產業預測
 2026年全球智慧工廠服務市場報告
 智慧工廠市場規模、佔有率、趨勢和預測:按現場設備、技術、最終用戶產業和地區分類,2026-2034 年
 智慧工廠市場:按組件、按解決方案、按製造業、按地區分類2026年全球智慧工廠市場報告