


 |
市場調查報告書
商品編碼
2121464
化學感測器:市場佔有率分析、產業趨勢與統計、成長預測(2026-2031)Chemical Sensors - Market Share Analysis, Industry Trends & Statistics, Growth Forecasts (2026 - 2031) |
||||||

※ 本網頁內容可能與最新版本有所差異。詳細情況請與我們聯繫。
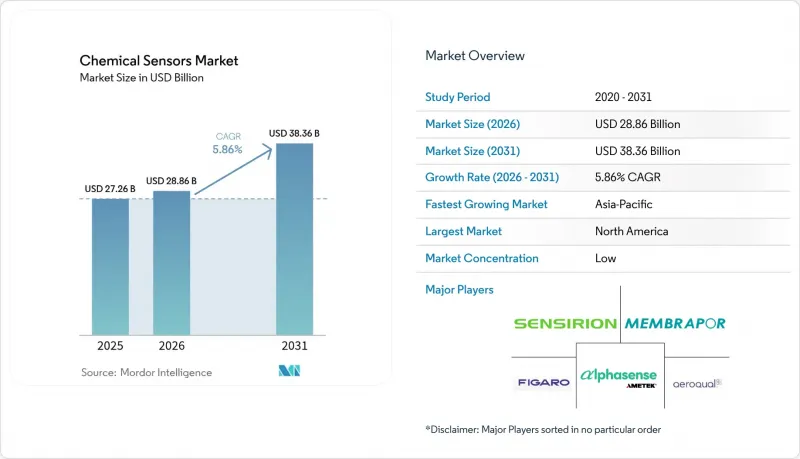
預計到 2026 年,化學感測器市場價值將達到 288.6 億美元,高於 2025 年的 272.6 億美元,預計到 2031 年將達到 383.6 億美元。
預計 2026 年至 2031 年的複合年成長率為 5.86%。
本報告按產品類型(電化學感測器、光學感測器等)、技術(CMOS整合感測器、MEMS感測器等)、應用(環境監測、醫療診斷、汽車廢氣和車廂空氣分析等)、分析相態(氣相、液相、固相)和地區進行細分。市場預測以美元(USD)為單位。
全球化學感測器市場趨勢及洞察
嚴格的環境法規推動了對工業氣體檢測的需求。
2024年美國國家空氣品質標準(NAAQS)修訂版降低了PM2.5的年均允許濃度限值,並強制要求各設施安裝多氣體監測儀,以提供二氧化硫和二氧化氮的即時電化學測量數據。同年,歐盟也修訂了其工業排放指令,要求加工能力超過100噸的化工廠幾乎持續發布揮發性有機化合物(VOC)的測量數據。到2025年中期,中國已將其空氣品質監測網擴展至1800個監測點,每個監測點均運作了臭氧、一氧化碳和氮氧化物測量裝置,由此創造了一個價值4億美元的採購市場。印度中央污染控制委員會強制要求火力發電廠安裝排放源監測系統,導致2025年初感測器出貨量年增31%。煉油廠透過以紅外線探頭取代觸媒珠元件,進一步鞏固了這些監管優勢,此舉已將誤報率降低了40%,並將校準間隔延長了一倍。
微型電化學感測器在醫療診斷領域的應用日益廣泛。
2024年,美國食品藥物管理局(FDA)批准了七款尺寸小於15毫米的新型即時檢測電化學平台,為醫院和家庭護理開闢了新的應用情境。雅培的FreeStyle Libre在2024年累計了53億美元的銷售額,年增21%,這推動了安培葡萄糖氧化酵素酶檢測技術的普及,而保險報銷是主要促進因素。 2025年3月,Sensirion公司發表了一款尺寸為10毫米見方的二氧化碳檢測池,可安裝在人工呼吸器迴路中,其價格僅為紅外線檢測池的三分之一。 2024年5月,歐洲體外診斷醫療設備法規(IVDR)收緊了檢測極限,加速了奈米結構電極的研發,這些電極可將乳酸的檢測極限降低至1微莫耳以下。 2024 年,耐力運動員專用的網版印刷汗液乳酸貼片問世,已能即時測量 2-25 mM 範圍內的乳酸濃度。
在對成本敏感的產業中,校準和維護成本是推廣應用的障礙。
每90至180天進行一次現場校準,每台設備的成本為150至300美元,五年營運期間很快就會超過初始硬體投資。 2024年一項針對340家食品加工企業的調查估計,每個站點的年度維護成本為18,000美元,是初始投資的2.8倍,這阻礙了設備的廣泛應用。淨利率低於5%的倉庫業者更傾向於使用手持式抽查設備,而不是連續監控系統,因為服務合約會對他們的預算造成壓力。雖然美國消防協會(NFPA)在2025年將住宅一氧化碳偵測器的檢查週期放寬至七年,但工業設備仍維持每季一次的檢查頻率,加劇了這種成本差異。
細分市場分析
預計到2025年,電化學感測器將佔銷售額的32.31%,繼續在煉油廠和污水處理廠的硫化氫、一氧化碳和二氧化氮警報系統中佔據主導地位。隨著非色散紅外線(NDIR)感測器(其維護週期可達24個月或更長)的普及,預計到2031年,光學感測器的年複合成長率將達到6.98%。
觸媒珠感測器曾是可燃性氣體偵測的主力軍,但由於本質安全法規建議使用非點火式光學感測器,其市佔率已降至17.60%以下。半導體金屬氧化物裝置目前佔21.70%的需求,在低成本室內空氣檢測應用中佔據主導地位,因為低於5美元的價格區間至關重要。天然氣管道檢測中紅外線光譜技術的升級,使得甲烷檢測靈敏度達到十億分之一,這是光學感測器快速普及的主要原因。美國甲烷減排獎勵推動了此類模組每年2.8億美元的需求成長。電化學單氣體偵測器在個人防護設備領域仍佔據主導地位。這是因為電解的消耗帶來了重複銷售和可預測的更換週期,從而維持了化學感測器市場在耗材收入方面的強勁勢頭。
將感測元件和混合訊號專用積體電路(ASIC)整合到5毫米矽晶片中的微機電系統(MEMS)衍生產品,預計到2025年將佔銷售額的27.02%。晶圓層次電子構裝顯著降低了組裝成本,使零售空氣品質監測器的價格降至50美元以下。卷對卷(R2R)凹版印刷技術將一次性生物感測條的單位成本降低至0.10美元,使得印刷型和軟性型生物感測條的複合年成長率達到6.86%,為體育和分散式醫療保健領域開闢了新的可能性。
目前市佔率18.70%的CMOS積體電路單元具有片上校準功能,可將組件成本降低30%。紅外線模組約佔20.80%的需求,廣泛應用於暖通空調、培養箱和溫室等光學壽命超過10年的應用領域。表面聲波(SAW)產品線約佔12.80%的市場佔有率,目前仍局限於化學武器預警等特定國防應用領域,但由於衝擊和振動測試標準化的進步,其在交通安全領域的吸引力正在不斷增強。 ISO 27891標準現要求MEMS氣體感測器晶片即使在承受1500g衝擊的情況下也不會發生漂移,大多數主要供應商均已達到這一要求,這進一步增強了汽車和工業領域買家的信心。
區域分析
到2025年,北美將佔全球銷售額的46.55%,這一領先優勢得益於美國職業安全與健康管理局(OSHA)針對密閉空間制定的嚴格法規,以及醫療保險(Medicare)的擴容,這將使320萬血糖值監測受益者增加。 2024年PM2.5標準將引發3.4億美元的感測器升級熱潮,其中加拿大累計1.8億加元(約1.33億美元)用於將其臭氧和顆粒物監測網路擴展到偏遠社區。
歐洲佔總銷售額的27.98%。該地區正逐步過渡到歐盟7排放氣體標準,該標準要求在-40至85 度C的溫度範圍內精度達到±10%,這為電化學和固體燃料電池堆帶來了穩定的訂單。德國撥款5億歐元(約5.65億美元)用於建造氫氣站,這些氫氣站需要配備冗餘檢測器,且每次測量時間均小於1秒。同時,英國將甲醛的允許濃度降低至0.3ppm,促使實驗室升級了儀器。
預計到2031年,亞太地區將以6.88%的複合年成長率超越其他所有地區。中國1800節點的空氣品質監測網路和工廠揮發性有機化合物(VOC)排放法規、印度引入的排放源監測以及日本的氫燃料發展藍圖,預計將催生一個價值數十億美元的競標市場。韓國的半導體VOC法規預計將每年新增8,500萬美元的需求。儘管中東、非洲和南美洲的市場規模相對較小,但這些地區正在推進以紅外線甲烷探測器為中心的國家級天然氣管道安全法規,這將為當地系統整合商帶來長期的商機。
其他好處:
- Excel格式的市場預測(ME)表
- 3個月的分析師支持
目錄
第1章:引言
- 研究假設和市場定義
- 調查範圍
第2章:調查方法
第3章執行摘要
第4章 市場狀況
- 市場概覽
- 宏觀經濟因素的影響
- 產業價值鏈分析
- 監理情勢
- 技術展望
- 市場促進因素
- 嚴格的環境法規正在推動對工業氣體檢測設備的需求。
- 微型電化學感測器在醫療診斷領域的應用日益廣泛。
- 工業自動化和製程安全系統的擴展
- 用於一次性物聯網設備的軟性可印刷化學感測器的出現。
- 將化學感測器整合到氫能基礎設施安全系統中
- 商業地產室內空氣品質法規迅速擴展
- 市場限制因素
- 在對成本敏感的產業中,校準和維護成本是推廣應用的主要障礙。
- 感測器漂移和壽命限制正在影響長期可靠性。
- 特殊電化學催化劑供應鏈中的瓶頸
- 對資料管治的擔憂正在減緩雲端連接感測器的普及。
- 波特五力分析
第5章 市場規模與成長預測
- 依產品類型
- 電化學感測器
- 光學感測器
- Pellistor/觸媒珠式感測器
- 半導體感測器
- 其他產品類型
- 透過技術
- CMOS整合感測器
- 基於MEMS的感測器
- NDIR 和紅外線感測器
- SAW和聲波感測器
- 印刷/軟性感測器
- 透過使用
- 工業安全與製程控制
- 環境監測
- 醫學診斷
- 汽車廢氣和車廂空氣
- 石油和天然氣探勘與提煉
- 國防安全保障與國防
- 其他用途
- 待分析物質的相分類
- 氣相
- 液相
- 固相
- 按地區
- 北美洲
- 美國
- 加拿大
- 墨西哥
- 歐洲
- 德國
- 英國
- 法國
- 義大利
- 其他歐洲國家
- 亞太地區
- 中國
- 日本
- 印度
- 韓國
- 澳洲
- 其他亞太國家
- 中東和非洲
- 中東
- 沙烏地阿拉伯
- 阿拉伯聯合大公國
- 其他中東國家
- 非洲
- 南非
- 埃及
- 其他非洲國家
- 中東
- 南美洲
- 巴西
- 阿根廷
- 其他南美國家
- 北美洲
第6章 競爭情勢
- 市場集中度
- 策略趨勢
- 市佔率分析
- 公司簡介
- Alphasense Limited
- Figaro Engineering Inc.
- Membrapor AG
- Sensirion AG
- Aeroqual Limited
- SGX Sensortech Limited
- Nemoto & Co., Ltd.
- SPEC Sensors, LLC
- Sensitron Srl
- NTM Sensors
- Dynament Limited
- City Technology Limited
- Gas Sensing Solutions Ltd.
- Zhengzhou Winsen Electronics Technology Co., Ltd.
- Sensorix GmbH
- DD-Scientific Ltd.
- SST Sensing Ltd.
- Crowcon Detection Instruments Limited
- PureAire Monitoring Systems, Inc.
- Aeroqual Limited(repeat for completeness)
第7章 市場機會與未來展望
According to Mordor Intelligence, the chemical sensors market size in 2026 is estimated at USD 28.86 billion, growing from 2025 value of USD 27.26 billion with 2031 projections showing USD 38.36 billion, growing at 5.86% CAGR over 2026-2031.
This report is Segmented by Product Type (Electrochemical Sensors, Optical Sensors, and More), Technology (CMOS-Integrated Sensors, MEMS-Based Sensors, and More), Application (Environmental Monitoring, Medical Diagnostics, Automotive Emissions and Cabin Air, and More), Analyte Phase (Gas Phase, Liquid Phase, and Solid Phase), and Geography. The Market Forecasts are Provided in Terms of Value (USD).
Global Chemical Sensors Market Trends and Insights
Stringent Environmental Regulations Driving Demand For Industrial Gas Detection
Revisions to the U.S. National Ambient Air Quality Standards in 2024 lowered the annual PM2.5 limit, obliging facilities to install multi-gas monitors that stream electrochemical sulfur-dioxide and nitrogen-dioxide data in real time. The European Union amended its Industrial Emissions Directive the same year, forcing chemical plants over 100 tonnes throughput to publish near-continuous volatile-organic-compound readouts. China expanded its ambient network to 1,800 stations by mid-2025 and each site runs ozone, carbon-monoxide, and nitrogen-oxides cells that collectively created a USD 400 million procurement pool. India's Central Pollution Control Board mandated Source Emission Monitoring Systems for thermal plants, which spurred a 31% YoY spike in sensor shipments during early 2025. Refineries swapping catalytic-bead elements for infrared heads have cut false alarms by 40% and doubled calibration intervals, reinforcing this regulatory tailwind.
Growing Adoption Of Miniaturized Electrochemical Sensors In Medical Diagnostics
The U.S. FDA cleared seven new point-of-care electrochemical platforms in 2024 that shrink form factors under 15 mm, opening hospital and at-home use cases. Abbott's FreeStyle Libre posted USD 5.3 billion revenue in 2024, up 21% YoY, underscoring reimbursement-led diffusion of amperometric glucose oxidase stacks. Sensirion introduced a 10 mm-square carbon-dioxide cell in March 2025 that fits ventilator circuits at one-third the cost of infrared alternatives. Europe's In Vitro Diagnostic Regulation tightened detection-limit rules in May 2024, prompting nanostructured electrodes that drop lactate thresholds below 1 µM. Screen-printed sweat-lactate patches launched for endurance athletes in 2024 and already measure 2-25 mM ranges on the fly.
Calibration And Maintenance Costs Limit Adoption In Cost-Sensitive Industries
Field calibration every 90-180 days costs USD 150-300 per instrument and quickly eclipses hardware outlays over a five-year run. A 2024 survey of 340 food processors pegged annual upkeep at USD 18,000 per site, 2.8 times capex, discouraging broader coverage. Warehousing operators running net margins below 5% favor handheld spot checks over continuous monitors because service contracts strain budgets. NFPA eased residential carbon-monoxide detector intervals to seven-year cycles in 2025, but industrial units remain on quarterly schedules, cementing this cost divide.
Other drivers and restraints analyzed in the detailed report include:
- Expansion Of Industrial Automation And Process Safety Systems
- Emergence Of Flexible Printed Chemical Sensors For Disposable IoT Devices
- Sensor Drift And Limited Lifespan Affect Long-Term Reliability
For complete list of drivers and restraints, kindly check the Table Of Contents.
Segment Analysis
Electrochemical cells captured 32.31% of 2025 revenue and remain the preferred route for hydrogen-sulfide, carbon-monoxide, and nitrogen-dioxide alarms in refineries and wastewater plants. Optical devices are expanding at a 6.98% CAGR through 2031 as operators migrate toward non-dispersive infrared heads that extend maintenance intervals beyond 24 months.
Catalytic-bead sensors, once a staple for combustible gas, are slipping below 17.60% share because intrinsic-safety rules encourage ignition-free optics. Semiconductor metal-oxide devices, now 21.70% of demand, dominate budget indoor-air applications where sub-USD 5 price points matter. Infrared spectroscopy upgrades in natural-gas pipeline inspection push parts-per-billion methane detection and are a key reason optical traction is accelerating. U.S. methane-reduction incentives add a USD 280 million annual pull for these modules. Electrochemical single-gas badges still rule personal protective gear because electrolyte depletion drives repeat sales and predictable replacement cycles, keeping the chemical sensors market robust in consumables revenue.
MEMS variants delivered 27.02% of 2025 revenue by slipping sensing elements and mixed-signal ASICs onto 5 mm silicon dies. Wafer-level packaging slashes assembly overhead and has pulled retail air-quality monitors under USD 50. Printed and flexible formats are logging a 6.86% CAGR as roll-to-roll gravure drops unit cost to USD 0.10 for single-use biosensing strips, opening new frontiers in athletics and decentralized medicine.
CMOS-integrated units, currently 18.70% share, add on-chip calibration that pares bill-of-materials by 30%. Infrared blocks represent about 20.80% of demand, serving HVAC, incubators, and greenhouses where optical lifetime exceeds a decade. Surface-acoustic-wave lines, roughly 12.80% share, stay in niche defense roles for chemical warfare agent alerts, but standardization work on shock and vibration tests is making them more attractive in transport safety. ISO 27891 now requires MEMS gas chips to survive 1,500 g shock with no drift, a hurdle most mainline suppliers have cleared, shoring up confidence in automotive and industrial buyers.
Complete Report Scope:
- By Product Type
- Electrochemical Sensors
- Optical Sensors
- Pellistor/Catalytic Bead Sensors
- Semiconductor Sensors
- Other Product Type
- By Technology
- CMOS-Integrated Sensors
- MEMS-Based Sensors
- NDIR and Infrared Sensors
- SAW and Acoustic Sensors
- Printed/Flexible Sensors
- By Application
- Industrial Safety and Process Control
- Environmental Monitoring
- Medical Diagnostics
- Automotive Emissions and Cabin Air
- Oil and Gas Exploration and Refining
- Homeland Security and Defense
- Other Application
- By Analyte Phase
- Gas Phase
- Liquid Phase
- Solid Phase
- By Geography
- North America
- United States
- Canada
- Mexico
- Europe
- Germany
- United Kingdom
- France
- Italy
- Rest of Europe
- Asia-Pacific
- China
- Japan
- India
- South Korea
- Australia
- Rest of Asia-Pacific
- Middle East and Africa
- Middle East
- Saudi Arabia
- United Arab Emirates
- Rest of Middle East
- Africa
- South Africa
- Egypt
- Rest of Africa
- Middle East
- South America
- Brazil
- Argentina
- Rest of South America
- North America
Geography Analysis
North America generated 46.55% of 2025 revenue, a lead built on strict OSHA confined-space laws and Medicare expansion that added 3.2 million glucose-monitoring beneficiaries. The 2024 PM2.5 standard drove a USD 340 million sensor retrofit wave, and Canada earmarked CAD 180 million (USD 133 million) to extend ozone and particulate networks into remote communities.
Europe contributed 27.98% of sales; its shift to Euro 7 exhaust norms mandates +-10% accuracy across -40-85 °C, generating steady orders for electrochemical and solid-state stacks. Germany carved EUR 500 million (USD 565 million) for hydrogen stations that each need redundant sub-second detectors, while the United Kingdom cut the formaldehyde limit to 0.3 ppm, spurring upgrades across laboratories.
Asia-Pacific is projected to outpace all regions at a 6.88% CAGR through 2031. China's 1,800-node air network and factory VOC rules, India's Source Emission Monitoring rollout, and Japan's hydrogen-fuel road map combine to unlock multi-billion-dollar tenders. South Korea's semiconductor VOC law adds another USD 85 million annual pull. Middle East and Africa and South America remain smaller slices but are moving toward national gas-pipeline safety laws that hinge on infrared methane trackers, creating long-tail opportunities for local integrators.
- Alphasense Limited
- Figaro Engineering Inc.
- Membrapor AG
- Sensirion AG
- Aeroqual Limited
- SGX Sensortech Limited
- Nemoto & Co., Ltd.
- SPEC Sensors, LLC
- Sensitron S.r.l.
- NTM Sensors
- Dynament Limited
- City Technology Limited
- Gas Sensing Solutions Ltd.
- Zhengzhou Winsen Electronics Technology Co., Ltd.
- Sensorix GmbH
- DD-Scientific Ltd.
- SST Sensing Ltd.
- Crowcon Detection Instruments Limited
- PureAire Monitoring Systems, Inc.
- Aeroqual Limited (repeat for completeness)
Additional Benefits:
- The market estimate (ME) sheet in Excel format
- 3 months of analyst support
TABLE OF CONTENTS
1 INTRODUCTION
- 1.1 Study Assumptions and Market Definition
- 1.2 Scope of the Study
2 RESEARCH METHODOLOGY
3 EXECUTIVE SUMMARY
4 MARKET LANDSCAPE
- 4.1 Market Overview
- 4.2 Impact of Macroeconomic Factors
- 4.3 Industry Value Chain Analysis
- 4.4 Regulatory Landscape
- 4.5 Technological Outlook
- 4.6 Market Drivers
- 4.6.1 Stringent Environmental Regulations Driving Demand For Industrial Gas Detection
- 4.6.2 Growing Adoption Of Miniaturized Electrochemical Sensors In Medical Diagnostics
- 4.6.3 Expansion Of Industrial Automation And Process Safety Systems
- 4.6.4 Emergence Of Flexible Printed Chemical Sensors for Disposable IoT Devices
- 4.6.5 Integration Of Chemical Sensors into Hydrogen Infrastructure Safety Systems
- 4.6.6 Rapid Proliferation Of Indoor Air Quality Mandates In Commercial Real Estate
- 4.7 Market Restraints
- 4.7.1 Calibration And Maintenance Costs Limit Adoption In Cost-Sensitive Industries
- 4.7.2 Sensor Drift And Limited Lifespan Affect Long-Term Reliability
- 4.7.3 Supply Chain Bottlenecks For Specialty Electrochemical Catalysts
- 4.7.4 Data Governance Concerns Slowing Deployment Of Cloud-Connected Sensors
- 4.8 Porter's Five Forces Analysis
- 4.8.1 Threat of New Entrants
- 4.8.2 Bargaining Power of Buyers
- 4.8.3 Bargaining Power of Suppliers
- 4.8.4 Threat of Substitutes
- 4.8.5 Competitive Rivalry
5 MARKET SIZE AND GROWTH FORECASTS (VALUE)
- 5.1 By Product Type
- 5.1.1 Electrochemical Sensors
- 5.1.2 Optical Sensors
- 5.1.3 Pellistor/Catalytic Bead Sensors
- 5.1.4 Semiconductor Sensors
- 5.1.5 Other Product Type
- 5.2 By Technology
- 5.2.1 CMOS-Integrated Sensors
- 5.2.2 MEMS-Based Sensors
- 5.2.3 NDIR and Infrared Sensors
- 5.2.4 SAW and Acoustic Sensors
- 5.2.5 Printed/Flexible Sensors
- 5.3 By Application
- 5.3.1 Industrial Safety and Process Control
- 5.3.2 Environmental Monitoring
- 5.3.3 Medical Diagnostics
- 5.3.4 Automotive Emissions and Cabin Air
- 5.3.5 Oil and Gas Exploration and Refining
- 5.3.6 Homeland Security and Defense
- 5.3.7 Other Application
- 5.4 By Analyte Phase
- 5.4.1 Gas Phase
- 5.4.2 Liquid Phase
- 5.4.3 Solid Phase
- 5.5 By Geography
- 5.5.1 North America
- 5.5.1.1 United States
- 5.5.1.2 Canada
- 5.5.1.3 Mexico
- 5.5.2 Europe
- 5.5.2.1 Germany
- 5.5.2.2 United Kingdom
- 5.5.2.3 France
- 5.5.2.4 Italy
- 5.5.2.5 Rest of Europe
- 5.5.3 Asia-Pacific
- 5.5.3.1 China
- 5.5.3.2 Japan
- 5.5.3.3 India
- 5.5.3.4 South Korea
- 5.5.3.5 Australia
- 5.5.3.6 Rest of Asia-Pacific
- 5.5.4 Middle East and Africa
- 5.5.4.1 Middle East
- 5.5.4.1.1 Saudi Arabia
- 5.5.4.1.2 United Arab Emirates
- 5.5.4.1.3 Rest of Middle East
- 5.5.4.2 Africa
- 5.5.4.2.1 South Africa
- 5.5.4.2.2 Egypt
- 5.5.4.2.3 Rest of Africa
- 5.5.4.1 Middle East
- 5.5.5 South America
- 5.5.5.1 Brazil
- 5.5.5.2 Argentina
- 5.5.5.3 Rest of South America
- 5.5.1 North America
6 COMPETITIVE LANDSCAPE
- 6.1 Market Concentration
- 6.2 Strategic Moves
- 6.3 Market Share Analysis
- 6.4 Company Profiles (includes Global Level Overview, Market Level Overview, Core Segments, Financials as Available, Strategic Information, Market Rank/Share for Key Companies, Products and Services, and Recent Developments)
- 6.4.1 Alphasense Limited
- 6.4.2 Figaro Engineering Inc.
- 6.4.3 Membrapor AG
- 6.4.4 Sensirion AG
- 6.4.5 Aeroqual Limited
- 6.4.6 SGX Sensortech Limited
- 6.4.7 Nemoto & Co., Ltd.
- 6.4.8 SPEC Sensors, LLC
- 6.4.9 Sensitron S.r.l.
- 6.4.10 NTM Sensors
- 6.4.11 Dynament Limited
- 6.4.12 City Technology Limited
- 6.4.13 Gas Sensing Solutions Ltd.
- 6.4.14 Zhengzhou Winsen Electronics Technology Co., Ltd.
- 6.4.15 Sensorix GmbH
- 6.4.16 DD-Scientific Ltd.
- 6.4.17 SST Sensing Ltd.
- 6.4.18 Crowcon Detection Instruments Limited
- 6.4.19 PureAire Monitoring Systems, Inc.
- 6.4.20 Aeroqual Limited (repeat for completeness)
7 MARKET OPPORTUNITIES AND FUTURE OUTLOOK
- 7.1 White-Space and Unmet-Need Assessment

 滴定感測器市場:全球市場預測,2026-2032年
 全球氯感測器市場規模、佔有率、趨勢和成長分析報告(2026-2034年)
 化學感測器市場:按產品類型、檢體類型、應用和地區分類,2026-2034年氯感測器市場:按技術類型、連接類型、部署模式、最終用戶產業、銷售管道和應用分類的全球市場預測 – 2026-2032 年化學感測器市場:2026-2032年全球市場預測(按感測器類型、材料類型、應用和最終用戶分類)
 化學感測器材料市場預測至2034年—按材料類型、感測器類型、應用和地區分類的全球分析
 蒸餾分析儀市場分析及預測(至2035年):依類型、產品類型、服務、技術、組件、應用、製程、最終用戶、功能、安裝類型分類
 2026年全球微電子餘氯感測器市場報告全球化學感測器市場報告(2026 年)
 化學感測器市場 - 全球產業規模、佔有率、趨勢、機會及預測(按產品、最終用戶、顆粒類型、地區和競爭格局分類,2021-2031年)