


 |
市場調查報告書
商品編碼
2121402
藍牙音箱:市場佔有率分析、產業趨勢與統計、成長預測(2026-2031)Bluetooth Speaker - Market Share Analysis, Industry Trends & Statistics, Growth Forecasts (2026 - 2031) |
||||||

※ 本網頁內容可能與最新版本有所差異。詳細情況請與我們聯繫。
據 Mordor Intelligence 稱,2025 年藍牙音箱市場價值為 183.2 億美元,預計到 2031 年將達到 537.9 億美元,而 2026 年為 219.3 億美元,預測期(2026-2031 年)複合年成長率為 19.65%。
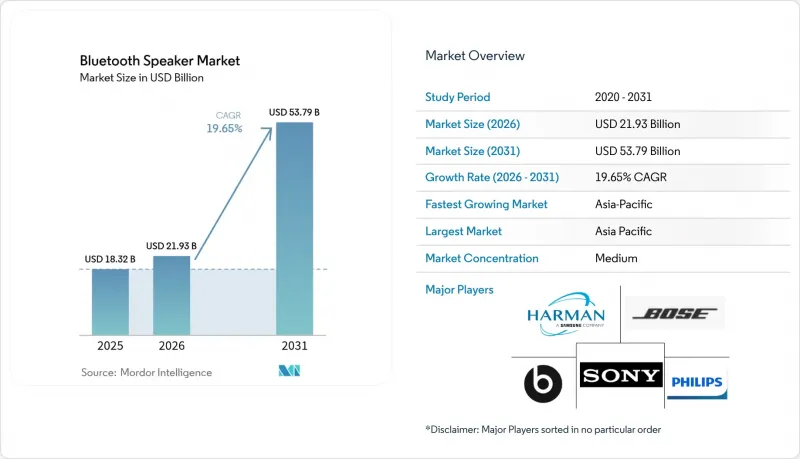
本報告按便攜性(可攜式、固定/壁掛式)、應用領域(住宅、商業)、連接技術(僅藍牙、其他)、分銷管道(僅限線上零售商、其他)、價格範圍(50美元以下的經濟型、其他)和地區(北美、南美、歐洲、其他)進行細分。市場預測以美元計價。
全球藍牙音箱市場趨勢及洞察
智慧家庭生態系統的快速普及
Matter 標準帶來的無縫互通性正將藍牙音箱從單純的娛樂設備轉變為多功能智慧家庭中心。亞馬遜 2025 年推出的 Echo Show 系列便是這一轉變的典範,它將 Fire TV 服務、自動視訊幀分割以及對 Matter、Zigbee 和 Thread 的全面支援整合於一體中。跨品牌相容性降低了用戶轉換成本,隨著家庭用戶透過語音控制音箱集中管理照明、暖通空調和安防系統,對高級產品更換的需求也隨之成長。 LegatoXP 等中國 ODM 平台縮短了產品開發週期,使二線品牌能夠以更少的開發預算進入智慧家庭市場。這些因素共同推動了智慧音箱在家庭中的普及,加劇了品牌間的競爭,並最終促進了藍牙音箱市場總銷售量的成長。
音樂串流訂閱業務的擴張
2024年,音樂串流服務的付費用戶數量超過7.5億,推動了對能夠播放高解析度、空間音訊的硬體的需求。隨著LC3、LDAC和aptX Lossless等音訊編轉碼器的日益成熟,使用者越來越意識到舊款設備和新一代揚聲器之間音質的顯著差異,從而刺激了更換需求。訂閱平台也在推廣原生支援多人聆聽的多裝置套餐,這使得用戶更傾向於選擇多房間揚聲器配置而非單揚聲器設定。串流媒體持續的獲利模式推動了促銷捆綁銷售,以折扣揚聲器作為吸引用戶的手段,這將進一步促進預測期內硬體的銷售。
仿冒品和盜版商品氾濫成災
無證工廠仿冒熱門設計,大量低劣假貨充斥電商通路。這些假貨價格低於正品,不僅搶佔了合法品牌的市場佔有率,也損害了消費者的信任。仿冒品往往缺乏關鍵的安全電路,增加了電池起火的風險,並迫使品牌方投入更多資金用於品牌保護措施,例如防偽技術、基於區塊鏈的標籤管理以及法律訴訟。奢侈品牌紛紛採用安全全像圖和供應鏈追蹤技術,而小規模供應商卻缺乏資金進行大規模監控,面臨收入損失和聲譽受損的風險。
細分市場分析
預計到2025年,固定式和壁掛式藍牙音箱產品將佔據68.75%的市場佔有率,這表明消費者更傾向於能夠與電視和多房間平台無縫整合的主動系統。此細分市場提供了穩定的收入基礎,使製造商能夠確保與智慧家庭改造專案相關的可預測的升級週期。同時,受都市區戶外活動和遠距辦公帶來的行動增強的推動,可攜式音箱預計將以21.95%的複合年成長率成長。
固定式音箱優先考慮音質、低音表現和語音助理功能,這促成了更高的平均售價 (ASP) 以及與串流媒體服務的捆綁銷售。而可攜式則著重於堅固耐用的結構、輕巧的設計和超長的電池續航力,吸引了新興市場的首次購買者。因此,這兩個細分市場並非相互競爭,而是並行發展,造就了整個藍牙音箱市場的多元化收入結構。
預計到2025年,住宅市場將佔藍牙音箱市場規模的60.55%,年複合成長率最高,達21.85%,這印證了疫情封鎖期間形成的以家庭為中心的娛樂習慣。智慧家庭的持續升級使得藍牙音箱的更換週期縮短至四年以內,遠低於傳統高傳真音響設備的歷史平均更換週期。
商業領域(餐廳、飯店、小規模辦公室等)對高階固定安裝系統的需求依然強勁,但面臨採購流程冗長、預算緊張等挑戰。隨著語音助理技術的日趨成熟,住宅音響正日益成為照明和暖通空調控制中心,實用性和娛樂性的融合鞏固了其在藍牙音箱市場長期需求預測中的主導地位。
區域分析
預計到2025年,亞太地區將佔據藍牙音箱市場31.45%的佔有率,並在2031年之前保持21.15%的複合年成長率。這主要得益於不斷擴大的生產規模、年輕一代的消費需求以及智慧型手機的快速普及。中國OEM廠商正利用其位置印刷基板和電池供應鏈的優勢,縮短前置作業時間,最大限度地擴大市場。預計到2030年,國內專業影音設備的需求將超過5.8兆元。政府對物聯網生態系統的支持進一步加速了智慧音箱的普及,鞏固了亞太地區在銷售和創新方面的主導地位。
儘管北美地區的銷量落後於全球,但其平均售價(ASP)卻最高。智慧家庭的早期普及以及消費者願意為語音助理功能付費,都促成了該地區高於全球平均水平的毛利率。從國家公園露營到都市區屋頂聚會,戶外休閒的興起刺激了對能夠與多種設備配對的高性能智慧音箱的需求。強大的品牌忠誠度使得像 Sonos 這樣的行業領導者即使在日益激烈的競爭中也能保持其在高階貨架上的地位。
在歐洲,藍牙音箱市場正經歷約15%的穩定成長,這得益於嚴格的品質和網路安全標準,這些標準有利於知名品牌。修訂後的無線電設備指令將於2024年8月生效,該指令強制要求安全啟動和網路安全保護措施,這實際上淘汰了那些缺乏合規預算的低價進口產品。由於消費者願意為符合標準的產品支付更高的價格,國內外製造商都在積極尋求儘早獲得認證,並將CE標誌作為行銷差異化優勢。這持續為全球藍牙音箱市場的收入做出重大貢獻。
其他好處:
- Excel格式的市場預測(ME)表
- 3個月的分析師支持
目錄
第1章:引言
- 研究假設和市場定義
- 調查範圍
第2章:調查方法
第3章執行摘要
第4章 市場狀況
- 市場概覽
- 市場促進因素
- 智慧家庭生態系統的快速普及
- 音樂串流服務用戶成長
- 鋰離子電池的平均售價正在下降。
- 戶外休閒和房車生活的蓬勃發展
- 藍牙低功耗音訊和 Auracast 的開發
- 沉浸式課堂音訊的需求日益成長。
- 市場限制因素
- 仿冒品氾濫成災
- 價格競爭導致利潤率下降
- 與電池起火相關的安全召回
- 歐盟收緊對功率超過30瓦揚聲器的電磁干擾限制
- 價值鏈分析
- 監理情勢
- 技術展望
- 波特五力分析
第5章 市場規模與成長預測
- 透過便攜性
- 可攜式的
- 固定式/壁掛式
- 透過使用
- 住宅
- 商業的
- 透過連接技術
- 限藍牙
- 藍牙+Wi-Fi(多房間)
- 附語音助理的智慧音箱
- 透過分銷管道
- 僅限線上銷售的零售商
- 全通路消費性電子產品量販店
- 按價格範圍
- 經濟型(50 美元以下)
- 中階(50-199 美元)
- 高級版(超過 200 美元)
- 按地區
- 北美洲
- 美國
- 加拿大
- 墨西哥
- 南美洲
- 巴西
- 阿根廷
- 其他南美國家
- 歐洲
- 德國
- 英國
- 法國
- 義大利
- 其他歐洲國家
- 亞太地區
- 中國
- 日本
- 韓國
- 印度
- 其他亞太國家
- 中東
- 沙烏地阿拉伯
- 阿拉伯聯合大公國
- 其他中東國家
- 非洲
- 南非
- 其他非洲國家
- 北美洲
第6章 競爭情勢
- 市場集中度
- 策略趨勢
- 市佔率分析
- 公司簡介
- Sony Group Corporation
- Samsung Electronics Co., Ltd.(Harman International Industries, Inc.)
- Panasonic Holdings Corporation
- Bose Corporation
- Beats Electronics LLC(Apple Inc.)
- Koninklijke Philips NV
- LG Electronics Inc.
- Logitech International SA
- Sonos, Inc.
- Bang & Olufsen A/S
- Yamaha Corporation
- Altec Lansing LLC
- JVCKENWOOD Corporation
- Anker Innovations Technology Co., Ltd.
- Ultimate Ears(Logitech)
- Tribit Audio(Thesy Technology Co., Ltd.)
- Onkyo Home Entertainment Corporation
- Zebronics India Pvt. Ltd.
- AOMAIS Audio(Shenzhen Jin Wen Hua)
- SoundBot Inc.
第7章 市場機會與未來展望
According to Mordor Intelligence, the bluetooth speaker market size was valued at USD 18.32 billion in 2025 and estimated to grow from USD 21.93 billion in 2026 to reach USD 53.79 billion by 2031, at a CAGR of 19.65% during the forecast period (2026-2031).
This report is Segmented by Portability (Portable, Fixed/Wall-Mounted), Application (Residential, Commercial), Connectivity Technology (Bluetooth-Only, and More), Distribution Channel (Online-Only Retailers, and More), Price Range (Economy Less Than USD 50, and More), and Geography (North America, South America, Europe, and More). The Market Forecasts are Provided in Terms of Value (USD).
Global Bluetooth Speaker Market Trends and Insights
Rapid Adoption of Smart-Home Ecosystems
Seamless interoperability delivered by the Matter standard elevates Bluetooth speakers from stand-alone entertainment devices to multifunction smart-home hubs. Amazon's 2025 Echo Show range illustrates the shift by embedding Fire TV services, auto-framing video communications, and full Matter, Zigbee, and Thread support in a single unit. Inter-brand compatibility lowers switching costs and drives premium replacement demand as households unify lighting, HVAC, and security control via voice-enabled speakers. Chinese ODM platforms such as LegatoXP shorten product development cycles, letting second-tier brands enter the smart-home space with smaller engineering budgets. Collectively, these forces accelerate household penetration, intensify brand competition, and enlarge the total volume opportunity for the Bluetooth speaker market.
Expansion of Music-Streaming Subscriptions
Music-streaming services surpassed 750 million paid subscribers in 2024, boosting demand for hardware capable of high-resolution and spatial-audio playback. As codecs such as LC3, LDAC, and aptX Lossless mature, users recognize audible quality deltas between legacy devices and next-generation speakers, prompting replacement purchases. Subscription platforms also encourage multi-device plans that natively support group listening, thereby favoring multi-room speakers over single-speaker setups. Streaming's recurring revenue model fosters promotional bundling, where discounted speakers act as customer-acquisition vehicles, further stimulating hardware volumes throughout the forecast window.
Rampant Counterfeiting and Piracy
Unauthorized factories replicate popular designs, flooding e-commerce channels with low-quality imitations that undercut legitimate brands on price and erode consumer trust. Counterfeits often omit essential safety circuits, raising the risk of battery fires and accelerating brand-protection expenditures for authentication technologies, blockchain labeling, and legal enforcement. While premium players deploy security holograms and supply-chain tracing, smaller vendors lack capital for large-scale monitoring, exposing them to revenue leaks and reputational damage.
Other drivers and restraints analyzed in the detailed report include:
- Bluetooth LE Audio and Auracast Roll-out
- Outdoor Recreation and Van-Life Boom
- Safety Recalls Tied to Battery Fires
For complete list of drivers and restraints, kindly check the Table Of Contents.
Segment Analysis
Fixed and wall-mounted units accounted for 68.75% of the Bluetooth speaker market share in 2025, illustrating consumers' preference for power-fed systems that integrate seamlessly with televisions and multi-room platforms. This segment's steady revenue base gives manufacturers predictable upgrade cycles tied to smart-home renovation projects. Portable speakers, however, post a 21.95% CAGR, gaining from urban outdoor activities and remote-work mobility.
Fixed solutions emphasize audio fidelity, bass response, and voice-assistant control, traits that favor higher ASPs and bundling with streaming services. Portable designs optimize for rugged builds, lighter weight, and prolonged battery life, attracting first-time buyers in emerging markets. The two sub-segments, therefore, expand in parallel rather than cannibalize, yielding a diversified revenue structure for the overall Bluetooth speaker market.
Residential settings delivered 60.55% of the Bluetooth speaker market size in 2025 and also hold the fastest 21.85% CAGR, underscoring the permanence of home-centric entertainment habits formed during pandemic lockdowns. Continuous smart-home upgrades keep the replacement cycle under four years, far shorter than the historical averages for legacy hi-fi components.
Commercial demand, restaurants, hotels, and small offices, remains important for premium installed systems but faces elongated procurement processes and tighter capital budgets. As voice assistants mature, residential speakers increasingly serve as hubs for lighting and HVAC control, blending functional utility with leisure use and cementing their primacy in long-term demand projections for the Bluetooth speaker market.
Complete Report Scope:
- By Portability
- Portable
- Fixed / Wall-Mounted
- By Application
- Residential
- Commercial
- By Connectivity Technology
- Bluetooth-only
- Bluetooth + Wi-Fi (Multi-room)
- Smart Speakers w/ Voice Assistant
- By Distribution Channel
- Online-Only Retailers
- Omnichannel Consumer-Electronics Stores
- By Price Range
- Economy (Less than USD 50)
- Mid-range (USD 50-199)
- Premium (More than USD 200)
- By Geography
- North America
- United States
- Canada
- Mexico
- South America
- Brazil
- Argentina
- Rest of South America
- Europe
- Germany
- United Kingdom
- France
- Italy
- Rest of Europe
- Asia-Pacific
- China
- Japan
- South Korea
- India
- Rest of Asia-Pacific
- Middle East
- Saudi Arabia
- United Arab Emirates
- Rest of Middle East
- Africa
- South Africa
- Rest of Africa
- North America
Geography Analysis
Asia-Pacific commanded 31.45% of the Bluetooth speaker market share in 2025, generating a 21.15% CAGR to 2031 on the back of manufacturing scale, youth-oriented consumption, and rapid smartphone proliferation. Chinese OEMs leverage proximity to printed-circuit and battery supply chains to compress lead times and capitalize on domestic demand, which is forecast to surpass CNY 5.8 trillion for professional AV equipment by 2030. Government incentives for IoT ecosystems further accelerate the adoption of smart speakers, solidifying regional leadership in both volume and innovation.
North America trails in unit volumes yet achieves the highest ASPs. Early smart-home adoption and consumer willingness to pay for voice-assistant integration keep the region's gross margins above global averages. Outdoor recreation trends-from national park camping to city rooftop gatherings- stimulate demand for ruggedized models with multi-device pairing. Brand loyalty is strong, allowing category leaders such as Sonos to maintain premium shelf space even amid price-based competition.
Europe posts steady mid-teen growth, backed by stringent quality and cybersecurity standards that favor established brands. The updated Radio Equipment Directive effective August 2024 mandates secure boot and network safeguards, effectively filtering out low-end imports lacking compliance budgets. Consumers reward compliance with premium pricing, prompting local and international manufacturers to certify early and use CE markings as marketing differentiators, sustaining a value-heavy contribution to global Bluetooth speaker market revenues.
- Sony Group Corporation
- Samsung Electronics Co., Ltd. (Harman International Industries, Inc.)
- Panasonic Holdings Corporation
- Bose Corporation
- Beats Electronics LLC (Apple Inc.)
- Koninklijke Philips N.V.
- LG Electronics Inc.
- Logitech International S.A.
- Sonos, Inc.
- Bang & Olufsen A/S
- Yamaha Corporation
- Altec Lansing LLC
- JVCKENWOOD Corporation
- Anker Innovations Technology Co., Ltd.
- Ultimate Ears (Logitech)
- Tribit Audio (Thesy Technology Co., Ltd.)
- Onkyo Home Entertainment Corporation
- Zebronics India Pvt. Ltd.
- AOMAIS Audio (Shenzhen Jin Wen Hua)
- SoundBot Inc.
Additional Benefits:
- The market estimate (ME) sheet in Excel format
- 3 months of analyst support
TABLE OF CONTENTS
1 INTRODUCTION
- 1.1 Study Assumptions and Market Definition
- 1.2 Scope of the Study
2 RESEARCH METHODOLOGY
3 EXECUTIVE SUMMARY
4 MARKET LANDSCAPE
- 4.1 Market Overview
- 4.2 Market Drivers
- 4.2.1 Rapid adoption of smart-home ecosystems
- 4.2.2 Expansion of music-streaming subscriptions
- 4.2.3 Falling ASPs of lithium-ion batteries
- 4.2.4 Outdoor recreation and van-life boom
- 4.2.5 Bluetooth LE Audio and Auracast roll-out
- 4.2.6 Growing demand for immersive classroom audio
- 4.3 Market Restraints
- 4.3.1 Rampant counterfeiting and piracy
- 4.3.2 Margin erosion from price wars
- 4.3.3 Safety recalls tied to battery fires
- 4.3.4 Stricter EU EMI limits for more than 30 W speakers
- 4.4 Value Chain Analysis
- 4.5 Regulatory Landscape
- 4.6 Technological Outlook
- 4.7 Porter's Five Forces Analysis
- 4.7.1 Bargaining Power of Suppliers
- 4.7.2 Bargaining Power of Buyers
- 4.7.3 Threat of New Entrants
- 4.7.4 Threat of Substitutes
- 4.7.5 Degree of Competition
5 MARKET SIZE AND GROWTH FORECASTS (VALUE)
- 5.1 By Portability
- 5.1.1 Portable
- 5.1.2 Fixed / Wall-Mounted
- 5.2 By Application
- 5.2.1 Residential
- 5.2.2 Commercial
- 5.3 By Connectivity Technology
- 5.3.1 Bluetooth-only
- 5.3.2 Bluetooth + Wi-Fi (Multi-room)
- 5.3.3 Smart Speakers w/ Voice Assistant
- 5.4 By Distribution Channel
- 5.4.1 Online-Only Retailers
- 5.4.2 Omnichannel Consumer-Electronics Stores
- 5.5 By Price Range
- 5.5.1 Economy (Less than USD 50)
- 5.5.2 Mid-range (USD 50-199)
- 5.5.3 Premium (More than USD 200)
- 5.6 By Geography
- 5.6.1 North America
- 5.6.1.1 United States
- 5.6.1.2 Canada
- 5.6.1.3 Mexico
- 5.6.2 South America
- 5.6.2.1 Brazil
- 5.6.2.2 Argentina
- 5.6.2.3 Rest of South America
- 5.6.3 Europe
- 5.6.3.1 Germany
- 5.6.3.2 United Kingdom
- 5.6.3.3 France
- 5.6.3.4 Italy
- 5.6.3.5 Rest of Europe
- 5.6.4 Asia-Pacific
- 5.6.4.1 China
- 5.6.4.2 Japan
- 5.6.4.3 South Korea
- 5.6.4.4 India
- 5.6.4.5 Rest of Asia-Pacific
- 5.6.5 Middle East
- 5.6.5.1 Saudi Arabia
- 5.6.5.2 United Arab Emirates
- 5.6.5.3 Rest of Middle East
- 5.6.6 Africa
- 5.6.6.1 South Africa
- 5.6.6.2 Rest of Africa
- 5.6.1 North America
6 COMPETITIVE LANDSCAPE
- 6.1 Market Concentration
- 6.2 Strategic Moves
- 6.3 Market Share Analysis
- 6.4 Company Profiles (includes Global level Overview, Market level overview, Core Segments, Financials as available, Strategic Information, Market Rank/Share for key companies, Products and Services, and Recent Developments)
- 6.4.1 Sony Group Corporation
- 6.4.2 Samsung Electronics Co., Ltd. (Harman International Industries, Inc.)
- 6.4.3 Panasonic Holdings Corporation
- 6.4.4 Bose Corporation
- 6.4.5 Beats Electronics LLC (Apple Inc.)
- 6.4.6 Koninklijke Philips N.V.
- 6.4.7 LG Electronics Inc.
- 6.4.8 Logitech International S.A.
- 6.4.9 Sonos, Inc.
- 6.4.10 Bang & Olufsen A/S
- 6.4.11 Yamaha Corporation
- 6.4.12 Altec Lansing LLC
- 6.4.13 JVCKENWOOD Corporation
- 6.4.14 Anker Innovations Technology Co., Ltd.
- 6.4.15 Ultimate Ears (Logitech)
- 6.4.16 Tribit Audio (Thesy Technology Co., Ltd.)
- 6.4.17 Onkyo Home Entertainment Corporation
- 6.4.18 Zebronics India Pvt. Ltd.
- 6.4.19 AOMAIS Audio (Shenzhen Jin Wen Hua)
- 6.4.20 SoundBot Inc.
7 MARKET OPPORTUNITIES AND FUTURE OUTLOOK
- 7.1 White-space and Unmet-need Assessment

 2026-2030年全球藍牙音箱市場
 藍牙音箱市場:按便攜性、應用、銷售管道和地區分類
 可攜式藍牙音箱市場:依防水等級、價格範圍、設計類型和銷售管道分類-2026-2032年全球市場預測藍牙音箱市場:依產品類型、應用和銷售管道-2026-2032年全球市場預測
 藍牙音箱市場報告:按便攜性、類型、價格、銷售管道和地區分類(2026-2034 年)戶外迷你音箱市場:按連接類型、電池容量、價格範圍、防水等級、揚聲器輸出功率、分銷管道和應用領域分類-全球預測,2026-2032年
 藍牙音箱市場 - 全球產業規模、佔有率、趨勢、機會及預測(按類型、技術、銷售管道、地區和競爭格局分類,2021-2031年)防水藍牙音箱市場 - 全球產業規模、佔有率、趨勢、機會、預測:按充電技術、應用、地區和競爭格局分類,2021-2031年可攜式戶外揚聲器市場:按連接技術、價格範圍、產品類型、電源、揚聲器配置、分銷管道和最終用戶分類-2026-2032年全球預測