


 |
市場調查報告書
商品編碼
2121222
歐洲包裝檢定:市場佔有率分析、產業趨勢與統計、成長預測(2026-2031)Europe Package Testing - Market Share Analysis, Industry Trends & Statistics, Growth Forecasts (2026 - 2031) |
||||||

※ 本網頁內容可能與最新版本有所差異。詳細情況請與我們聯繫。
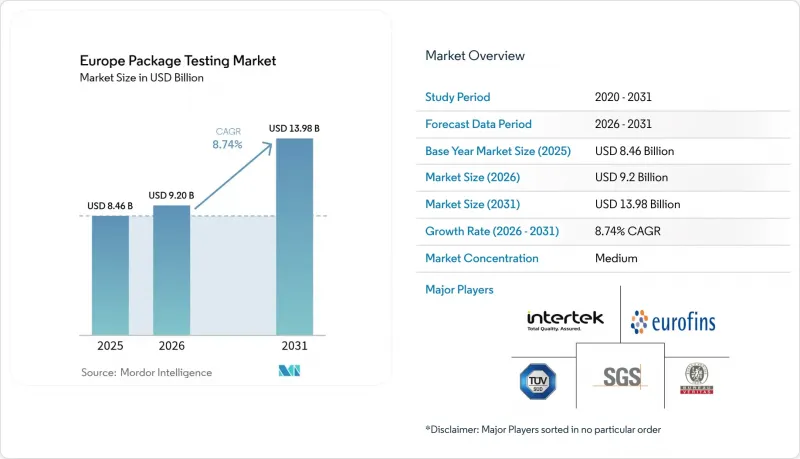
根據 Mordor Intelligence 預測,歐洲包裝偵測市場規模將從 2025 年的 84.6 億美元成長到 2026 年的 92 億美元,然後在 2031 年達到 139.8 億美元,2026 年至 2031 年的複合年成長率為 8.74%。
本報告按主要材料(玻璃、紙張及其他)、檢測類型(物理性能測試、化學測試、環境測試)、檢測技術(物理測試、光譜/光度測試及其他)、終端用戶行業(食品飲料、醫療/製藥及其他)和國家/地區進行細分。市場預測以美元計價。
歐洲包裝檢測市場的趨勢與洞察
符合歐盟關於包裝安全性和性能的嚴格規定。
《包裝及包裝廢棄物法規》(PPWR)於2025年1月生效,規定所有重量超過10克的包裝材料在進入單一市場前,必須通過可回收性、可堆肥性和化學遷移性測試。各實驗室已分別投資超過200萬歐元(約218萬美元)用於購置PFAS檢測系統,該系統能夠量化25 ppm的限值,僅此項測試的樣本量就年增了40%。數位產品護照的數據將生命週期指標與每批貨物關聯起來,從而將檢驗包裝測試市場的環境驗證和實體檢驗緊密結合。由於檢測前置作業時間從兩週延長至六週,市場對能夠動態分配測量儀器以消除瓶頸的人工智慧調度工具的需求日益成長。隨著PPWR的適用範圍擴大到化妝品、藥品和工業包裝,預計在中期內,監管合規的壓力將維持較高的測試量需求。
由於電子商務的發展,對可出貨包裝的檢驗需求日益成長。
亞馬遜的ISTA 6-Amazon模擬測試(2024年更新版)要求在單一流程中完成高速振動測試、氣候循環測試和最後一公里跌落分析。由於易碎的生物製藥產品需要在嚴格的溫度範圍內完好無損地送達消費者手中,歐洲實驗室正投資高達150萬歐元(約164萬美元)購買專門的配送路線測試設備。機器學習模型正在擷取宅配業者的感測器資料並預測失效模式,從而將重新設計週期縮短20%。隨著藥品上門服務的激增,預計未來兩年電子商務將成為歐洲包裝測試市場最大的需求驅動力。
先進測試設備和認證相關的高昂資本成本
容器和密封完整性測試設備單價可能超過120萬歐元(131萬美元),而一套完整的氣候檢查室則需額外花費50萬歐元(54.5萬美元)。維持ISO 17025標準每年可能需要花費高達15萬歐元(16.35萬美元),這筆費用令小規模的新參與企業望而卻步。測試規程的快速發展,尤其是與PFAS相關的規程,需要每三到五年進行一次再投資,進一步推高了歐洲包裝測試市場的成本曲線。東歐的測試實驗室面臨著12至18個月的交付延遲,這進一步加劇了產能短缺,並促使區域品牌轉向更大的西歐供應商。
細分市場分析
到2025年,塑膠包裝在歐洲包裝檢測市場仍將佔據46.38%的佔有率。多層阻隔薄膜能夠有效保護高價值的食品和藥品,從而鞏固了這一地位。隨著PFAS相關法規的不斷完善,每種新的樹脂變體都需要進行大量的過渡和洗脫分析。目前,一個典型的驗證週期需要在層析法、光譜和成像分析系統方面投入80萬至200萬歐元(約87.2萬至218萬美元)。同時,由於濕強度增強添加劑的應用,紙質包裝的性能在保持可回收性的同時,預計到2031年將實現10.15%的複合年成長率。
紙製品的興起也反映出品牌希望根據PPWR目標減少碳足跡。因此,實驗室正在將紙芯吸水率、拉伸強度和纖維回收率的模擬整合到一個綜合測試方案中,將所需時間縮短一半。雖然玻璃和金屬包裝的規模較小,但塗層附著力和腐蝕性測試的需求仍然存在,尤其是在高階化妝品和即飲飲料領域。實驗室正透過結合傳統測試方案和新型纖維檢驗方法,拓展服務範圍,進而增強歐洲包裝測試市場。
實體性能測試,特別是跌落測試、振動測試和壓縮測試,預計到2025年仍將佔收入的48.75%。據ISTA.ORG稱,這些測試是所有電商履約模式的基礎,並且仍然是歐洲包裝測試市場的重要組成部分。然而,從碳足跡到生物分解率等環境測試預計將以9.31%的複合年成長率快速成長。測試實驗室正在投資購買堆肥測試設備,這些設備的成本在40萬歐元到150萬歐元(43.6萬美元到164萬美元)之間,可以在一次測試中監測二氧化碳排放、崩壞和生態毒性。
化學檢測處於中間位置,專注於低濃度遷移和添加劑定量分析。隨著PPWR數位護照的普及,實驗室正將物理、化學和環境這三個面向整合到統一的檢測方案中。能夠在一份報告中提供完整的合規性信息,正成為歐洲包裝檢測市場的決定性差異化因素。
其他福利
- Excel格式的市場預測(ME)表
- 3個月的分析師支持
目錄
第1章:引言
- 研究假設和市場定義
- 調查範圍
第2章:調查方法
第3章執行摘要
第4章 市場狀況
- 市場概覽
- 市場促進因素
- 符合歐盟關於包裝安全性和性能的嚴格規定。
- 由於電子商務的發展,對可出貨包裝的檢驗需求日益成長。
- 透過向永續材料的過渡,創造對新測試規程的需求。
- 延長食品和藥品保存期限的需求日益成長
- 快速部署人工智慧驅動的自動化檢測台
- 透過與轉換器品牌的內部實驗室合作,加速創新週期。
- 市場限制因素
- 先進測試設備和認證相關的高昂資本成本
- 海外低成本實驗室提供的服務價格低於歐洲同類實驗室。
- ISTA認證技術人員短缺,導致認證過程出現瓶頸。
- 由於歐盟指令執行方式的差異,不確定性。
- 產業價值鏈分析
- 監理情勢
- 技術展望
- 宏觀經濟因素對市場的影響
- 投資分析
- 波特五力分析
第5章 市場規模與成長預測
- 主要材料
- 玻璃
- 紙
- 塑膠
- 金屬
- 按測試類型
- 物理性能測試
- 化學測試
- 環境測試
- 透過測試技術
- 實體檢查
- 光譜和光度檢測
- 基於層析法的檢測
- 其他先進技術
- 按最終用戶行業分類
- 飲食
- 醫療和藥品
- 工業和製造業
- 個人護理和家居用品
- 其他終端用戶產業
- 國家
- 英國
- 德國
- 義大利
- 法國
- 西班牙
- 其他歐洲國家
第6章 競爭情勢
- 市場集中度
- 策略趨勢
- 市佔率分析
- 公司簡介
- SGS SA
- Bureau Veritas SA
- Intertek Group plc
- Eurofins Scientific SE
- TUV SUD AG
- ALS Limited
- Merieux NutriSciences Corporation
- Smithers Group Inc.
- UL Solutions Inc.
- Campden BRI Group
- Microbac Laboratories, Inc.
- Institut fur Produktqualitat GmbH
- National Technical Systems, Inc.
- TUV Rheinland AG
- Fera Science Limited
- Nelson Labs Europe BVBA
- NSF International
- RISE Research Institutes of Sweden AB
- Nefab AB
第7章 市場機會與未來展望
According to Mordor Intelligence, the Europe package testing market size is expected to grow from USD 8.46 billion in 2025 to USD 9.2 billion in 2026 and is forecast to reach USD 13.98 billion by 2031 at 8.74% CAGR over 2026-2031.
This report is Segmented by Primary Material (Glass, Paper, and More), Type of Testing (Physical Performance Testing, Chemical Testing, and Environmental Testing), Testing Technology (Physical Tests, Spectroscopy and Photometric-Based, and More), End-User Vertical (Food and Beverage, Healthcare and Pharmaceuticals, and More), and Country. The Market Forecasts are Provided in Terms of Value (USD).
Europe Package Testing Market Trends and Insights
Stringent EU Regulatory Compliance on Packaging Safety and Performance
The PPWR, in force since January 2025, obliges every package above 10 grams to pass recyclability, compostability, and chemical-migration tests before entering the single market. Laboratories have poured more than EUR 2 million (USD 2.18 million) per site into PFAS detection systems able to quantify 25 ppm limits, and sample volumes for that assay alone have climbed 40% year on year. Digital product passport data now links life-cycle metrics to each shipment, intertwining environmental and physical validations inside the Europe package testing market. Extended lead times from two to six weeks are driving demand for AI scheduling tools that allocate instrumentation dynamically, shrinking bottlenecks. Given PPWR's scope across cosmetics, pharmaceuticals, and industrial packages, compliance pressure is likely to keep test-volume demand elevated through the medium term.
Growing E-commerce Intensifying Demand for Transit-Ready Packaging Validation
Amazon's 2024 update to ISTA 6-Amazon simulations requires high-speed vibration, climate cycling, and last-mile drop analytics in one sequence. European labs have spent up to EUR 1.5 million (USD 1.64 million) on route-specific chambers because fragile direct-to-consumer biologics must arrive intact within narrow temperature bands. Machine-learning models ingest courier sensor data to predict failure modes, cutting redesign cycles by 20 %. The surge of pharmacy-to-door deliveries positions e-commerce as a top volume driver for the Europe package testing market over the next two years.
High Capital Costs for Advanced Test Equipment and Accreditation
Container-closure integrity rigs can exceed EUR 1.2 million (USD 1.31 million) each, while full climate chambers add another EUR 500,000 (USD 545,000). ISO 17025 maintenance costs run up to EUR 150,000 (USD 163,500) annually, a burden that keeps small entrants on the sidelines. Rapid protocol evolution, especially around PFAS, forces reinvestment every three to five years, inflating the cost curve inside the Europe package testing market. Eastern European labs face 12- to 18-month delivery delays, compounding capacity gaps and pushing regional brands toward larger Western providers.
Other drivers and restraints analyzed in the detailed report include:
- Transition to Sustainable Materials Creating New Test Protocol Demand
- Rapid Deployment of AI-Enabled Automated Test Benches
- Shortage of ISTA-Certified Technicians Causing Certification Bottlenecks
For complete list of drivers and restraints, kindly check the Table Of Contents.
Segment Analysis
Plastic packaging retained 46.38% share of the Europe package testing market in 2025, a position secured by multilayer barrier films that protect high-value foods and medicines. Ongoing PFAS limits mean every new resin variant triggers extensive migration and leachate analytics. A typical validation cycle now consumes EUR 800,000-2 million (USD 872,000-2.18 million) in capital toward chromatography, spectroscopy, and image-analysis suites. Paper formats, however, are registering a 10.15% CAGR through 2031, thanks to wet-strength additives that raise performance closer to that of polymer rivals while keeping recyclable content intact.
Paper's ascent also reflects brand ambitions to cut carbon footprints in line with PPWR targets. Testing labs therefore bundle Cobb absorption, tensile integrity, and fiber-recovery simulations into one composite protocol that halves turnaround time. Glass and metal, though smaller, continue to demand coating-adhesion and corrosion assays, especially for premium cosmetics and RTD beverages. By balancing legacy protocols with emerging fiber validations, laboratories are broadening service menus and reinforcing the Europe package testing market.
Physical performance examinations, drop, vibration, and compression still command 48.75% of 2025 revenue. These tests underpin every e-commerce fulfillment model and remain integral to the Europe package testing market size ISTA.ORG. Yet environmental assays, from carbon footprint to biodegradation kinetics, will expand fastest at 9.31% CAGR. Laboratories are buying EUR 400,000-1.5 million (USD 436,000-1.64 million) composting rigs capable of monitoring CO2 evolution, disintegration, and ecotoxicity in a single pass.
Chemical testing occupies the middle ground, specializing in low-level migration and additive quantification. As PPWR's digital passport rollout scales, labs are merging all three disciplines, physical, chemical, and environmental, into integrated protocols. The ability to deliver a complete compliance pack in one report is emerging as a decisive differentiator across the Europe package testing market.
Complete Report Scope:
- By Primary Material
- Glass
- Paper
- Plastic
- Metal
- By Type of Testing
- Physical Performance Testing
- Chemical Testing
- Environmental Testing
- By Testing Technology
- Physical Tests
- Spectroscopy and Photometric-based
- Chromatography-based
- Other Advanced Methods
- By End-user Vertical
- Food and Beverage
- Healthcare and Pharmaceuticals
- Industrial and Manufacturing
- Personal and Household Products
- Other End-user Verticals
- By Country
- United Kingdom
- Germany
- Italy
- France
- Spain
- Rest of Europe
List of Companies Covered in this Report:
- SGS SA
- Bureau Veritas SA
- Intertek Group plc
- Eurofins Scientific SE
- TUV SUD AG
- ALS Limited
- Merieux NutriSciences Corporation
- Smithers Group Inc.
- UL Solutions Inc.
- Campden BRI Group
- Microbac Laboratories, Inc.
- Institut fur Produktqualitat GmbH
- National Technical Systems, Inc.
- TUV Rheinland AG
- Fera Science Limited
- Nelson Labs Europe BVBA
- NSF International
- RISE Research Institutes of Sweden AB
- Nefab AB
Additional Benefits:
- The market estimate (ME) sheet in Excel format
- 3 months of analyst support
TABLE OF CONTENTS
1 INTRODUCTION
- 1.1 Study Assumptions and Market Definition
- 1.2 Scope of the Study
2 RESEARCH METHODOLOGY
3 EXECUTIVE SUMMARY
4 MARKET LANDSCAPE
- 4.1 Market Overview
- 4.2 Market Drivers
- 4.2.1 Stringent EU regulatory compliance on packaging safety and performance
- 4.2.2 Growing e-commerce intensifying demand for transit-ready packaging validation
- 4.2.3 Transition to sustainable materials creating new test protocol demand
- 4.2.4 Rising need to extend shelf-life for food and pharma
- 4.2.5 Rapid deployment of AI-enabled automated test benches
- 4.2.6 Converter-brand in-house lab partnerships accelerating innovation cycles
- 4.3 Market Restraints
- 4.3.1 High capital costs for advanced test equipment and accreditation
- 4.3.2 Offshore low-cost labs undercutting European service pricing
- 4.3.3 Shortage of ISTA-certified technicians causing certification bottlenecks
- 4.3.4 Uneven enforcement of EU directives creating compliance uncertainty
- 4.4 Industry Value Chain Analysis
- 4.5 Regulatory Landscape
- 4.6 Technological Outlook
- 4.7 The Impact of Macroeconomic Factors on the Market
- 4.8 Investment Analysis
- 4.9 Porter's Five Forces Analysis
- 4.9.1 Bargaining Power of Suppliers
- 4.9.2 Bargaining Power of Buyers
- 4.9.3 Threat of New Entrants
- 4.9.4 Threat of Substitutes
- 4.9.5 Intensity of Competitive Rivalry
5 MARKET SIZE AND GROWTH FORECASTS (VALUE)
- 5.1 By Primary Material
- 5.1.1 Glass
- 5.1.2 Paper
- 5.1.3 Plastic
- 5.1.4 Metal
- 5.2 By Type of Testing
- 5.2.1 Physical Performance Testing
- 5.2.2 Chemical Testing
- 5.2.3 Environmental Testing
- 5.3 By Testing Technology
- 5.3.1 Physical Tests
- 5.3.2 Spectroscopy and Photometric-based
- 5.3.3 Chromatography-based
- 5.3.4 Other Advanced Methods
- 5.4 By End-user Vertical
- 5.4.1 Food and Beverage
- 5.4.2 Healthcare and Pharmaceuticals
- 5.4.3 Industrial and Manufacturing
- 5.4.4 Personal and Household Products
- 5.4.5 Other End-user Verticals
- 5.5 By Country
- 5.5.1 United Kingdom
- 5.5.2 Germany
- 5.5.3 Italy
- 5.5.4 France
- 5.5.5 Spain
- 5.5.6 Rest of Europe
6 COMPETITIVE LANDSCAPE
- 6.1 Market Concentration
- 6.2 Strategic Moves
- 6.3 Market Share Analysis
- 6.4 Company Profiles (includes Global level Overview, Market level overview, Core Segments, Financials as available, Strategic Information, Market Rank/Share for key companies, Products and Services, and Recent Developments)
- 6.4.1 SGS SA
- 6.4.2 Bureau Veritas SA
- 6.4.3 Intertek Group plc
- 6.4.4 Eurofins Scientific SE
- 6.4.5 TUV SUD AG
- 6.4.6 ALS Limited
- 6.4.7 Merieux NutriSciences Corporation
- 6.4.8 Smithers Group Inc.
- 6.4.9 UL Solutions Inc.
- 6.4.10 Campden BRI Group
- 6.4.11 Microbac Laboratories, Inc.
- 6.4.12 Institut fur Produktqualitat GmbH
- 6.4.13 National Technical Systems, Inc.
- 6.4.14 TUV Rheinland AG
- 6.4.15 Fera Science Limited
- 6.4.16 Nelson Labs Europe BVBA
- 6.4.17 NSF International
- 6.4.18 RISE Research Institutes of Sweden AB
- 6.4.19 Nefab AB
7 MARKET OPPORTUNITIES AND FUTURE OUTLOOK
- 7.1 White-space and Unmet-Need Assessment


