


 |
市場調查報告書
商品編碼
2120741
智慧交通:市場佔有率分析、產業趨勢與統計、成長預測(2026-2031)Smart Transportation - Market Share Analysis, Industry Trends & Statistics, Growth Forecasts (2026 - 2031) |
||||||

※ 本網頁內容可能與最新版本有所差異。詳細情況請與我們聯繫。
根據 Mordor Intelligence 預測,智慧交通市場規模將從 2025 年的 1,256.5 億美元成長到 2026 年的 1,434.7 億美元,到 2031 年將達到 2,783.6 億美元,2026 年至 2031 年的複合年成長率為 14.18%。
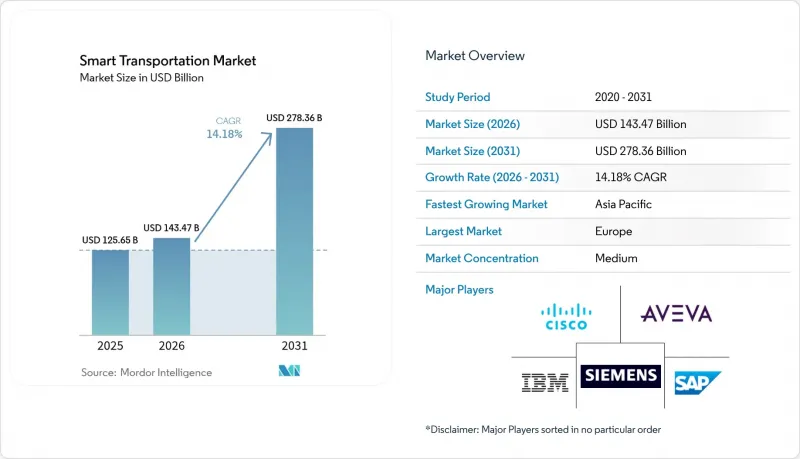
本報告按應用領域(交通管理、道路安全等)、產品類型(高級乘客資訊系統 (ATIS) 等)、服務(部署和整合等)、交通途徑(公路、鐵路等)、連接技術(DSRC/C-V2X、5G 和 LTE-M 等)以及地區進行細分。市場預測以美元計價。
全球智慧交通市場趨勢及洞察
城市人口的快速成長給現有的道路網路帶來了壓力。
人口湧入城市造成了前所未有的交通密度,預計到2030年,全球60%的人口居住在都市區。在許多經濟體中,交通堵塞已造成2%至4%的GDP損失,運輸公司正從成本高昂的道路拓寬轉向人工智慧驅動的交通最佳化。北京的智慧交通號誌網路預計到2024年將平均延誤時間減少23%,孟買和雅加達也正在進行類似的實施。數位孿生技術使負責人能夠對車道配置進行虛擬壓力測試。自適應號誌控制結合車輛偵測數據,已使亞洲特大城市的走廊通行時間縮短了25%。因此,隨著城市優先考慮技術解決方案而非實體擴張,智慧交通市場正直接受益於城市密度的增加。
政府對智慧城市的資助和智慧交通系統(ITS)的強制實施
立法支持使得數十億美元的智慧交通項目得以進行。美國《基礎設施投資與就業法案》撥款912億美元用於公共交通現代化,而ATTAIN計畫每年則為先進技術試點計畫提供6,000萬美元的資金。歐盟的類似措施強制要求實現互通資料共用和碳中和交通走廊,為智慧交通市場的供應商提供了需求確定性的基礎。資金條款通常要求將地方區域納入其中,從而將目標需求範圍擴大到主要城市之外,並刺激低成本感測器組件和雲端協作的創新。
在全市範圍內引入自動櫃員機需要大量的初始資本投資。
每個路口實施先進的交通管理基礎設施需要花費 6,000 至 7,000 美元,在大城市,資本支出很容易超過 7,000 萬美元。預算週期和採購法規正在減緩實施速度,尤其是在稅基薄弱的地區。儘管官民合作關係和基於使用量的定價模式正在興起,以推遲資本支出,但資金仍然是智慧交通市場面臨的最緊迫的阻力。
細分市場分析
預計到2025年,交通管理將在智慧交通市場佔據32.05%的市場佔有率,其成長速度將超過整體市場成長率,因為各城市都希望透過人工智慧驅動的調整實現兩位數的交通堵塞緩解。佛羅裡達州的一項試點計畫透過即時自適應號誌控制,實現了35%的出行時間縮短,這為採購交叉路口分析、事故偵測和交通流最佳化系統奠定了基礎。市政採購負責人優先考慮能夠連接到現有控制設備而無需進行大規模系統升級的模組化雲端控制面板,這種設計原則也擴大了供應商的選擇範圍。
停車管理技術正以12.95%的複合年成長率快速發展,將路邊停車位轉化為數位化資產,並顯著減少了循環交通流量(循環交通流量可佔城市交通總量的30%)。隨著乘客從車輛所有權轉向按使用量付費的模式,公共交通正在蓬勃發展。在貨運領域,協同主動式車距維持定速系統已展現出5-6%的燃油節省率和平均速度提升,為智慧交通系統在物流領域的部署創造了商業價值,並進一步推動了智慧交通市場的發展。
到2025年,先進的交通管理系統將佔據智慧交通市場31.45%的佔有率,成為多模態網路的數位化操作系統。各機構正在以雲端原生編排系統取代孤立的本地伺服器,以支援預測分析、施工區域自動化和溫室氣體排放儀錶板等功能。加州採購將20個舊有系統整合到一個商用現成(COTS)平台上的編配,正是這種整合趨勢的典型例證。
協作式車輛系統以16.75%的複合年成長率成長,正在整合5G和邊緣人工智慧技術,以實現車隊編組、高級危險預警和緊急車輛優先路線規劃。 5G汽車協會(5GAA)在巴黎進行的2025年非地面電波網路演示,展示了結合衛星和行動電話網路的混合V2X技術的有效性,並擴大了農村高速公路的覆蓋範圍(5gaa.org)。隨著堵塞收費重塑收入來源並推動交通途徑的轉變,先進的收費系統正在蓬勃發展,區塊鏈技術也擴大應用於即時收費。
區域分析
在嚴格的排放氣體目標和一致的資金籌措模式的支持下,歐洲在2025年佔據了智慧交通市場收入的39.10%。 「永續與智慧交通策略」呼籲到2030年部署3,000萬輛零排放車輛,並將高速鐵路運力增加一倍。對公共資料空間和開放原始碼模擬平台的投資正在加速供應商創新,同時也有助於城市全部區域提供了一個可複製的模式。
北美位居第二。聯邦政府的「智慧交通發展補助金」(SMART Grants,每年1億美元)和「大型補助金走廊」(Mega Grant Corridor)等計畫為試點計畫的擴展和區域推廣提供了資金支持。矽谷的雲端運算和半導體產業叢集支撐著豐富的供應商生態系統,推動了智慧交通市場所需的雷射雷達模組、地圖API和中介軟體的快速商業化。美國聯邦通訊委員會(FCC)批准使用商用行動頻段進行補充衛星通訊,正在將V2X覆蓋範圍擴展到人口稀少的地區,並增強緊急服務的韌性。
亞太地區以13.28%的複合年成長率 (CAGR) 保持最高的成長率。在中國,各省正積極推動路側車聯網 (C-V2X) 的部署,以符合國家指南;在印度,物聯網感測器正被整合到專用高速公路和港口項目中,以確保出行時間。在東協特大城市,與國民身分證系統相連的非接觸式票務系統正在推廣,加速了出行即服務 (MaaS) 的普及。同時,中東國家正將「2030願景」資金投入到自動駕駛地鐵線路的建設中,目標是到2030年實現全部區域智慧交通系統 (ITS) 支出達到70億美元。這些努力共同鞏固了亞太地區作為智慧交通市場主要需求來源的地位。
其他好處:
- Excel格式的市場預測(ME)表
- 3個月的分析師支持
目錄
第1章:引言
- 研究假設和市場定義
- 調查範圍
第2章:調查方法
第3章執行摘要
第4章 市場狀況
- 市場概覽
- 市場促進因素
- 都市區的快速成長給現有的道路網路帶來了壓力。
- 政府為智慧城市提供資金,並強制實施智慧交通系統。
- 降低部署人工智慧邊緣感測器的成本。
- MaaS訂閱平台的成長
- 將收費公路過渡到基於區塊鏈的小額支付平台
- 在人口稠密、建築物眾多的都市區,正在採用航空級GNSS冗餘技術。
- 市場限制因素
- 在全市範圍內部署智慧型運輸管理系統需要大量的初始資本投資。
- V2X 缺乏廠商間資料標準
- 公共機構的網路安全合規責任
- 主要大都會地區 5.9 GHz 頻段專用頻寬短缺。
- 價值供應鏈分析
- 監理情勢
- 技術展望
- 波特五力分析
- 宏觀經濟趨勢的影響
- 產業價值鏈分析
第5章 市場規模與成長預測
- 透過使用
- 交通管理
- 交通安全保障
- 停車管理
- 大眾運輸智慧交通系統
- 車用通訊系統
- 貨運/物流資訊科技服務
- 依產品類型
- 高階旅客資訊系統(ATIS)
- 智慧型運輸管理系統(ATMS)
- 先進交通收費系統(ATPS)
- 先進公共運輸系統(APTS)
- 合作式智慧交通系統(車載智慧交通系統)
- 按服務
- 實施與整合
- 雲端和託管服務
- 專業諮詢
- 透過運輸方式
- 路
- 鐵路
- 航空
- 海上運輸
- 透過連接技術
- DSRC/C-V2X
- 5G 和 LTE-M
- 衛星(GNSS, L波段)
- 按地區
- 北美洲
- 美國
- 加拿大
- 墨西哥
- 南美洲
- 巴西
- 阿根廷
- 歐洲
- 德國
- 英國
- 法國
- 俄羅斯
- 其他歐洲國家
- 亞太地區
- 中國
- 日本
- 印度
- 其他亞太國家
- 中東和非洲
- 沙烏地阿拉伯
- 阿拉伯聯合大公國
- 南非
- 其他中東和非洲國家
- 北美洲
第6章 競爭情勢
- 市場集中度
- 策略性措施與併購
- 市佔率分析
- 公司簡介
- Siemens Corporation
- Cisco Systems Inc.
- IBM Corporation
- SAP SE
- AVEVA Group PLC
- Thales Group
- Huawei Technologies Co. Ltd.
- Alstom SA
- Kapsch TrafficCom AG
- Hitachi Ltd.
- Oracle Corporation
- Advantech Co. Ltd.
- Orange SA
- TransCore LP
- Cubic Transportation Systems
- TomTom NV
- Panasonic Holdings Corp.
- Ericsson AB
- Qualcomm Inc.
- Continental AG
- Iteris Inc.
- PTV Group
第7章 市場機會與未來展望
According to Mordor Intelligence, the smart transportation market size is expected to grow from USD 125.65 billion in 2025 to USD 143.47 billion in 2026 and is forecast to reach USD 278.36 billion by 2031 at 14.18% CAGR over 2026-2031.
This report is Segmented by Application (Traffic Management, Road Safety and Security, and More), Product Type (Advanced Traveler Information Systems (ATIS), and More), Service (Deployment and Integration, and More), Transportation Mode (Roadways, Railways, and More), Connectivity Technology (DSRC/C-V2X, 5G and LTE-M, and More), and by Geography. The Market Forecasts are Provided in Terms of Value (USD).
Global Smart Transportation Market Trends and Insights
Rapid Urban-Population Growth Stressing Legacy Road Networks
The migration of people toward cities is creating unprecedented traffic density, with urban areas forecast to host 60% of the global population by 2030. Congestion already erodes 2-4% of GDP in many economies, spurring transport agencies to deploy AI-driven traffic optimisation instead of costly road widening. Beijing's smart signal network cut average delays by 23% in 2024, and similar deployments are underway in Mumbai and Jakarta. Digital twins allow planners to stress-test lane configurations virtually, while adaptive signal control paired with vehicle probe data has trimmed corridor travel times by 25% inside Asian megacities. The smart transportation market, therefore, benefits directly from urban density as cities prioritise technological fixes over concrete expansions.
Government Smart-City Funding & ITS Mandates
Legislative support is translating into multibillion-dollar pipelines for intelligent mobility. The U.S. Infrastructure Investment and Jobs Act allocates USD 91.2 billion for modernising public transit, and the ATTAIN program reserves USD 60 million annually for advanced technology pilots. Parallel initiatives in the European Union mandate interoperable data sharing and carbon-neutral corridors, anchoring demand certainty for vendors in the smart transportation market. Funding provisions often require rural inclusion, widening addressable demand beyond tier-one cities, and stimulating innovation in low-cost sensor packages and cloud orchestration.
High Upfront Capex for City-Wide ATMS Roll-Outs
Deploying an advanced traffic management backbone can cost USD 6,000-7,000 per intersection, and large cities easily exceed USD 70 million capital outlay. Budget cycles and procurement rules slow adoption, particularly where tax bases are small. Public-private partnerships and usage-based pricing models are emerging to defer capex, yet financial friction remains the most immediate headwind facing the smart transportation market.
Other drivers and restraints analyzed in the detailed report include:
- Drop-in Cost of AI-Enabled Edge Sensors
- Growth of MaaS Subscription Platforms
- Lack of Cross-Vendor Data Standards for V2X
For complete list of drivers and restraints, kindly check the Table Of Contents.
Segment Analysis
Traffic Management contributed 32.05% market share to the smart transportation market in 2025 and is projected to outpace overall growth as cities target double-digit congestion cuts with AI coordination. Real-time adaptive signal control shows 35% travel-time savings in pilot corridors across Florida, underpinning procurement for intersection analytics, incident detection, and corridor optimisation. Municipal buyers value modular cloud dashboards that plug into legacy controllers without forklift upgrades, a design principle widening vendor addressability.
Parking Management technologies are advancing at a 12.95% CAGR, converting curbside inventory into digital assets and slashing cruising traffic that can reach 30% of downtown volumes. Public Transport is growing as passengers shift from ownership toward usage-based subscriptions. In freight, cooperative adaptive cruise control demonstrates 5-6% fuel savings and higher average speeds, generating business cases for logistics ITS deployments and further boosting the smart transportation market.
Advanced Transportation Management Systems represented 31.45% of smart transportation market share in 2025, acting as the digital operating system for multi-modal networks. Agencies are replacing siloed, on-premise servers with cloud-native orchestration that supports predictive analytics, work-zone automation, and greenhouse-gas dashboards. California's procurement to unify 20 legacy systems under a single COTS platform exemplifies the consolidation trend.
Cooperative Vehicle Systems, posting a 16.75% CAGR, marries 5G and edge AI to enable platooning, advanced hazard alerts, and prioritised emergency routing. The 5G Automotive Association's 2025 non-terrestrial network trial in Paris validated hybrid satellite-cellular V2X, widening coverage for rural highways 5gaa.org. Advanced Transportation Pricing Systems are gaining momentum as congestion pricing reshapes revenue streams and nudges modal shift, often using blockchain for real-time micro-tolling.
Complete Report Scope:
- By Application
- Traffic Management
- Road Safety and Security
- Parking Management
- Public Transport ITS
- Automotive Telematics
- Freight and Logistics ITS
- By Product Type
- Advanced Traveler Information Systems (ATIS)
- Advanced Transportation Management Systems (ATMS)
- Advanced Transportation Pricing Systems (ATPS)
- Advanced Public Transportation Systems (APTS)
- Cooperative Vehicle Systems (C-ITS)
- By Service
- Deployment and Integration
- Cloud and Managed Services
- Professional and Consulting
- By Transportation Mode
- Roadways
- Railways
- Airways
- Maritime
- By Connectivity Technology
- DSRC / C-V2X
- 5G and LTE-M
- Satellite (GNSS, L-band)
- By Geography
- North America
- United States
- Canada
- Mexico
- South America
- Brazil
- Argentina
- Europe
- Germany
- United Kingdom
- France
- Russia
- Rest of Europe
- APAC
- China
- Japan
- India
- Rest of APAC
- Middle East and Africa
- Saudi Arabia
- United Arab Emirates
- South Africa
- Rest of Middle East and Africa
- North America
Geography Analysis
Europe captured 39.10% of 2025 revenue in the smart transportation market, underpinned by stringent emissions targets and cohesive funding models. The Sustainable and Smart Mobility Strategy calls for 30 million zero-emission vehicles and a doubling of high-speed rail traffic by 2030. Investment in public data spaces and open-source simulation platforms accelerates vendor innovation while helping cities benchmark performance region-wide. Northern Europe's mature telecom infrastructure and early adoption of congestion pricing provide templates replicable across the continent.
North America ranks second. Federal programmes, including SMART Grants (USD 100 million annually) and mega-grant corridors, finance pilot scaling and rural outreach. Silicon Valley's cloud and semiconductor clusters feed a rich supplier ecosystem, allowing rapid commercialization of LIDAR modules, mapping APIs, and middleware critical to the smart transportation market. The FCC's approval for supplemental satellite coverage using commercial mobile spectrum extends V2X reach into sparsely populated regions, reinforcing the resilience of emergency services.
Asia-Pacific posts the highest growth at 13.28% CAGR. Chinese provinces are activating roadside C-V2X to meet national mandates, while India's dedicated highway and port programmes integrate IoT sensors for journey-time guarantees. ASEAN megacities deploy contactless ticketing tied to national identity schemes, shortening adoption cycles for Mobility-as-a-Service. In parallel, Middle Eastern states channel Vision 2030 funds into autonomous metro lines, targeting USD 7 billion regional ITS spend by 2030. Collectively, these initiatives cement APAC as a principal volume engine for the smart transportation market.
- Siemens Corporation
- Cisco Systems Inc.
- IBM Corporation
- SAP SE
- AVEVA Group PLC
- Thales Group
- Huawei Technologies Co. Ltd.
- Alstom SA
- Kapsch TrafficCom AG
- Hitachi Ltd.
- Oracle Corporation
- Advantech Co. Ltd.
- Orange SA
- TransCore LP
- Cubic Transportation Systems
- TomTom NV
- Panasonic Holdings Corp.
- Ericsson AB
- Qualcomm Inc.
- Continental AG
- Iteris Inc.
- PTV Group
Additional Benefits:
- The market estimate (ME) sheet in Excel format
- 3 months of analyst support
TABLE OF CONTENTS
1 INTRODUCTION
- 1.1 Study Assumptions and Market Definition
- 1.2 Scope of the Study
2 RESEARCH METHODOLOGY
3 EXECUTIVE SUMMARY
4 MARKET LANDSCAPE
- 4.1 Market Overview
- 4.2 Market Drivers
- 4.2.1 Rapid urban?population growth stressing legacy road networks
- 4.2.2 Government smart-city funding and ITS mandates
- 4.2.3 Drop-in cost of AI-enabled edge sensors
- 4.2.4 Growth of MaaS subscription platforms
- 4.2.5 Transition of toll roads to blockchain-based micro-payment rails
- 4.2.6 Aviation-grade GNSS redundancy adopted for dense urban canyons
- 4.3 Market Restraints
- 4.3.1 High upfront capex for city-wide ATMS roll-outs
- 4.3.2 Lack of cross-vendor data standards for V2X
- 4.3.3 Cyber-security-compliance liabilities for public agencies
- 4.3.4 Scarcity of dedicated 5.9 GHz spectrum in megacities
- 4.4 Value / Supply-Chain Analysis
- 4.5 Regulatory Landscape
- 4.6 Technological Outlook
- 4.7 Porter's Five Forces Analysis
- 4.7.1 Bargaining Power of Suppliers
- 4.7.2 Bargaining Power of Buyers
- 4.7.3 Threat of New Entrants
- 4.7.4 Intensity of Competitive Rivalry
- 4.7.5 Threat of Substitute Products
- 4.8 Impact of Macroeconomic Trends
- 4.9 Industry Value-Chain Analysis
5 MARKET SIZE AND GROWTH FORECASTS (VALUE)
- 5.1 By Application
- 5.1.1 Traffic Management
- 5.1.2 Road Safety and Security
- 5.1.3 Parking Management
- 5.1.4 Public Transport ITS
- 5.1.5 Automotive Telematics
- 5.1.6 Freight and Logistics ITS
- 5.2 By Product Type
- 5.2.1 Advanced Traveler Information Systems (ATIS)
- 5.2.2 Advanced Transportation Management Systems (ATMS)
- 5.2.3 Advanced Transportation Pricing Systems (ATPS)
- 5.2.4 Advanced Public Transportation Systems (APTS)
- 5.2.5 Cooperative Vehicle Systems (C-ITS)
- 5.3 By Service
- 5.3.1 Deployment and Integration
- 5.3.2 Cloud and Managed Services
- 5.3.3 Professional and Consulting
- 5.4 By Transportation Mode
- 5.4.1 Roadways
- 5.4.2 Railways
- 5.4.3 Airways
- 5.4.4 Maritime
- 5.5 By Connectivity Technology
- 5.5.1 DSRC / C-V2X
- 5.5.2 5G and LTE-M
- 5.5.3 Satellite (GNSS, L-band)
- 5.6 By Geography
- 5.6.1 North America
- 5.6.1.1 United States
- 5.6.1.2 Canada
- 5.6.1.3 Mexico
- 5.6.2 South America
- 5.6.2.1 Brazil
- 5.6.2.2 Argentina
- 5.6.3 Europe
- 5.6.3.1 Germany
- 5.6.3.2 United Kingdom
- 5.6.3.3 France
- 5.6.3.4 Russia
- 5.6.3.5 Rest of Europe
- 5.6.4 APAC
- 5.6.4.1 China
- 5.6.4.2 Japan
- 5.6.4.3 India
- 5.6.4.4 Rest of APAC
- 5.6.5 Middle East and Africa
- 5.6.5.1 Saudi Arabia
- 5.6.5.2 United Arab Emirates
- 5.6.5.3 South Africa
- 5.6.5.4 Rest of Middle East and Africa
- 5.6.1 North America
6 COMPETITIVE LANDSCAPE
- 6.1 Market Concentration
- 6.2 Strategic Initiatives and Mergers and Acquisitions
- 6.3 Market Share Analysis
- 6.4 Company Profiles (includes global overview, market overview, core segments, financials, strategy, market rank/share, products and services, recent developments)
- 6.4.1 Siemens Corporation
- 6.4.2 Cisco Systems Inc.
- 6.4.3 IBM Corporation
- 6.4.4 SAP SE
- 6.4.5 AVEVA Group PLC
- 6.4.6 Thales Group
- 6.4.7 Huawei Technologies Co. Ltd.
- 6.4.8 Alstom SA
- 6.4.9 Kapsch TrafficCom AG
- 6.4.10 Hitachi Ltd.
- 6.4.11 Oracle Corporation
- 6.4.12 Advantech Co. Ltd.
- 6.4.13 Orange SA
- 6.4.14 TransCore LP
- 6.4.15 Cubic Transportation Systems
- 6.4.16 TomTom NV
- 6.4.17 Panasonic Holdings Corp.
- 6.4.18 Ericsson AB
- 6.4.19 Qualcomm Inc.
- 6.4.20 Continental AG
- 6.4.21 Iteris Inc.
- 6.4.22 PTV Group
7 MARKET OPPORTUNITIES AND FUTURE OUTLOOK
- 7.1 White-space and Unmet-Need Assessment

 智慧交通市場:按組件、交通途徑方式、自動駕駛等級、應用和最終用戶分類-2026-2032年全球市場預測
 智慧交通市場分析及預測(至2035年):類型、產品類型、服務、技術、組件、應用、部署狀態、最終用戶、解決方案
 全球智慧交通市場(至 2032 年):按運輸方式(公路、鐵路、航空和海運)和最終用戶(政府和私營部門)分類
 智慧交通市場規模、佔有率、趨勢和預測:按解決方案、服務、交通方式、應用和地區分類,2026-2034年
 2026年全球5G汽車與智慧交通市場報告2026年全球智慧交通市場報告
 全球智慧交通市場規模、佔有率、趨勢和成長分析報告(2026-2034)
 智慧交通市場-全球產業規模、佔有率、趨勢、機會及預測(依應用、產品類型、地區及競爭格局分類,2021-2031年)
 2026-2030年全球智慧交通市場日本智慧交通市場規模、佔有率、趨勢及預測(按解決方案和服務、交通方式、應用和地區分類),2026-2034年