


 |
市場調查報告書
商品編碼
2120728
二次電池:市場佔有率分析、產業趨勢與統計、成長預測(2026-2031)Secondary Battery - Market Share Analysis, Industry Trends & Statistics, Growth Forecasts (2026 - 2031) |
||||||

※ 本網頁內容可能與最新版本有所差異。詳細情況請與我們聯繫。
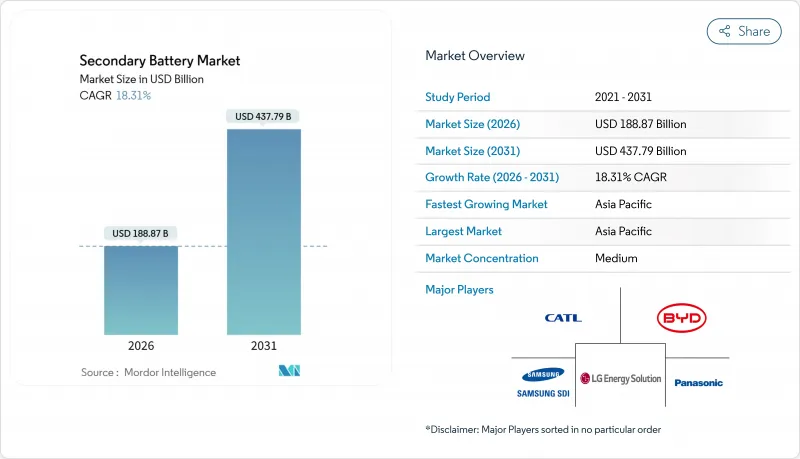
根據 Mordor Intelligence 估計,2026 年二次電池市值為 1888.7 億美元,預計在預測期(2026-2031 年)內將以 18.31% 的複合年成長率成長,到 2031 年達到 4377.9 億美元。
本報告按技術(鉛酸電池、鋰離子電池、鎳鎘電池、鎳氫電池、液流電池、全固態電池)、形狀(圓柱形、棱柱形、軟包型)、應用(電動車、固定式儲能等)、最終用戶(汽車、公共產業/電力、電子/IT等)和地區(北美、歐洲、亞太地區、南美等地區分類。
全球二次電池市場趨勢及洞察
電動車的日益普及將推動對鋰離子電池的需求。
預計到2024年,電動車銷量將達到1,390萬輛,佔全球乘用車銷量的16%。產業分析師預測,到2026年,這一比例將超過25%。汽車製造商已簽署啟動協議,以確保2027年約三分之二的電池產能,顯示電池供應將十分緊張。在中國,預計2024年,國內電動車滲透率將超過38%,成本因素正加速大眾市場車輛朝向磷酸鐵鋰電池(LFP)化學成分的轉變。採用800V架構的平台,例如現代的E-GMP平台,需要更高的能量密度,這迫使供應商轉向富矽負極和高鎳正極。這些化學成分的變化迫使電池製造商在生產週期中途調整生產線,儘管產量增加,但利潤率受到擠壓。
與可再生能源結合的儲能專案的成長
2024年,全球電力公司電池儲能容量達到45吉瓦,預計2026年將達到120吉瓦。加州強制要求到2026年建成11.5吉瓦的儲能系統,德克薩斯州,專案報酬率接近20%。雖然歐洲再生能源計畫(REPowerEU)的資金增加了競標數量,但由於授權程序延誤,超過40%的2024年競標被推遲到後續年份。因此,擁有現成建設用地的開發商在爭取這些積壓項目方面佔優勢。
基本礦產供應受限
預計到2024年,電池用鋰的需求量將達到62萬噸(鋰當量),2030年可能翻倍。然而,新礦的核准已被推遲近兩年。鈷的供應仍集中在剛果民主共和國,而當地的小規模開採會帶來環境、社會和治理(ESG)風險,迫使汽車製造商對其低階供應商進行審計。受印尼供應擔憂和碳排放強度審查的影響,硫酸鎳價格在2024年初飆升至每噸2.2萬美元,這使得長期合約定價變得更加複雜。由於使用水溶液冶金法回收鋰時仍有約10%的鋰會損失,因此到2030年,回收利用可能只能滿足正極金屬需求的10%至12%。
細分市場分析
2025年,鋰離子電池佔了74.8%的二次電池市場。然而,隨著豐田、三星SDI和QuantumScape等公司擴大其試點生產線,預計到2031年,全固態電池的複合年成長率將達到24.9%。在全固體結構中,透過陶瓷隔膜取代液態電解質,可以實現鋰金屬負極,從而使能量密度翻倍至400-500 Wh/kg。豐田已報告其硫化物電池在1,200次循環後容量維持率達80%,並計畫在2027年實現年產1萬顆電池。 QuantumScape的氧化物隔膜在800次循環測試中容量衰減率低於10%,確保了其為大眾汽車2028款車型提供的隔膜供應。
商業性可行性取決於生產良率和原料供應,尤其是硫化物粉末的供應。現有供應商透過授權固態電池的智慧財產權來規避風險,同時繼續擴大傳統生產線。鉛酸電池由於初始成本低,仍用於堆高機和通訊設施,但其市場佔有率逐年下降。液流電池在系統互連用儲能領域以19%的複合年成長率成長,可提供數小時的續航時間,但由於其高昂的資本投資成本,目前在二次電池市場中所佔佔有率仍不足1%。
預計到2025年,以特斯拉「4680」和廣泛應用的「2170」電芯為代表的圓柱形電池將以53.5%的市佔率引領二次電池市場。然而,隨著汽車製造商對更薄的電池組的需求不斷成長以最大限度地利用車內空間,軟包電池預計到2031年將以22.2%的複合年成長率成長。通用汽車(GM)在其「Ultium」平台中使用了LG軟包電芯,透過垂直堆疊的方式,每個電池組可提供200kWh的電量。現代汽車的「E-GMP」平台也採用了軟包設計,即使在350kW的快速充電過程中,也能實現更均勻的散熱。
製造趨勢因地區而異。中國製造商傾向於棱柱形電池,以充分利用自動化優勢;歐洲新創公司正在試點為高階電動車生產大容量軟包電池;而美國公司則在圓柱形和軟包電池的生產之間尋求平衡,以滿足《通貨膨脹控制法案》(IRA)的國內採購要求。因此,電池形狀的競爭反映的是各公司的策略定位,而非統一的設計。
區域分析
預計到2025年,亞太地區將以49.7%的市佔率主導二次電池市場,年複合成長率達20.1%。中國1200GWh的電池產能,憑藉其完全的垂直整合,可提供高達20%的成本優勢。韓國供應商專注於高鎳化學成分,以在高階電動車領域獲得溢價。受中國競爭對手的價格壓力,日本Panasonic的市佔率已下滑至18%,但該公司與特斯拉保持著牢固的合作關係。
在北美,《通膨抑制法案》正推動供應鏈迅速回流美國本土。稅額扣抵了730億美元的投資,預計到2030年,計畫產能將達到550吉瓦時。通用汽車、福特和Stellantis等公司都將電池工廠和整車組裝設在同一地點,以最大限度地降低物流成本。加拿大正努力將自身打造為原料中心,墨西哥則在爭取對成本敏感的組裝契約,但人手不足和授權流程的延誤仍然是限制因素。
受2035年內燃機汽車銷售禁令和嚴格的碳排放法規的推動,歐洲在2025年佔全球鋰需求的近四分之一。 Northvolt位於瑞典的工廠生產的電池二氧化碳排放量低於每千瓦時60公斤,滿足了高階汽車製造商的需求。在德國,從BASF正極材料到大眾汽車的PowerCo電池生產線,一個完整的生態系統正在運作。在低廉的人事費用和歐盟結構基金的支持下,南歐和東歐正在吸引新的超級工廠。南美洲鋰三角地區預計將提供穩定的長期資源供應,但水資源短缺和政治風險正在減緩其擴張速度。中東和非洲仍在發展中,其市場佔有率仍處於個位數。
其他好處:
- Excel格式的市場預測(ME)表
- 3個月的分析師支持
目錄
第1章:引言
- 研究假設和市場定義
- 調查範圍
第2章:調查方法
第3章執行摘要
第4章 市場狀況
- 市場概覽
- 市場促進因素
- 電動車的日益普及正在推動對鋰離子電池的需求。
- 擴大可再生能源與儲能結合的項目
- 鋰離子電池的成本曲線正在下降(每千瓦時低於 85 美元)。
- 廢電池再利用生態系統
- 政策主導的超級工廠位置
- 由於其成本和安全優勢,磷酸鐵鋰電池正迅速普及。
- 市場限制因素
- 基本礦產供應受限
- 安全/熱失控事故
- 產品生命週期末期合規成本增加
- 將資金轉移到替代儲能技術
- 供應鏈分析
- 監理情勢
- 技術展望
- 波特五力模型
- 電池和原物料價格走勢
- 國際貿易統計
第5章 市場規模與成長預測
- 透過技術
- 鉛酸
- 鋰離子
- 鎳氫電池
- 鎳和鎘
- 液流電池
- 固態(商業化前)
- 按外形規格
- 圓柱形
- 棱鏡
- 小袋
- 透過使用
- 電動車
- 固定式儲能
- 工業電力
- 家用電子產品
- 電動工具和其他
- 按最終用戶行業分類
- 車
- 公共產業與電力
- 電子和資訊技術
- 物流和倉儲
- 航太/國防
- 醫療及其他
- 按地區
- 北美洲
- 美國
- 加拿大
- 墨西哥
- 歐洲
- 英國
- 德國
- 法國
- 西班牙
- 北歐國家
- 俄羅斯
- 其他歐洲國家
- 亞太地區
- 中國
- 印度
- 日本
- 韓國
- 東南亞國協
- 澳洲和紐西蘭
- 其他亞太國家
- 南美洲
- 巴西
- 阿根廷
- 哥倫比亞
- 其他南美國家
- 中東和非洲
- 沙烏地阿拉伯
- 阿拉伯聯合大公國
- 南非
- 埃及
- 其他中東和非洲國家
- 北美洲
第6章 競爭情勢
- 市場集中度
- 策略趨勢(併購、聯盟、購電協議)
- 市場佔有率分析(主要公司的市場排名和佔有率)
- 公司簡介
- CATL
- LG Energy Solution
- Panasonic Holdings
- BYD Co. Ltd
- Samsung SDI
- SK On
- Envision AESC
- Northvolt AB
- Tesla Inc.(Gigafactory)
- GS Yuasa
- Clarios
- EnerSys
- Saft Groupe
- Duracell
- Showa Denko Materials
- Toshiba SCiB
- SVOLT Energy
- CALB
- Farasis Energy
- A123 Systems
- Tianjin Lishen
- VARTA AG
- Hitachi Astemo Battery
- EVE Energy
- Amara Raja
第7章 市場機會與未來展望
According to Mordor Intelligence, the secondary battery market size is estimated at USD 188.87 billion in 2026, and is expected to reach USD 437.79 billion by 2031, at a CAGR of 18.31% during the forecast period (2026-2031).
This report is Segmented by Technology (Lead-Acid, Lithium-Ion, Nickel-Cadmium, Nickel-Metal Hydride, Flow Batteries, and Solid-State), Form Factor (Cylindrical, Prismatic, and Pouch), Application (Electric Vehicles, Stationary Energy Storage, and More), End-User (Automotive, Utilities and Power, Electronics and IT, and More), and Geography (North America, Europe, Asia-Pacific, South America, and More).
Global Secondary Battery Market Trends and Insights
Surging EV Adoption Boosts Li-ion Demand
EV sales reached 13.9 million units in 2024, equal to 16% of global passenger car sales, and industry trackers expect the share to exceed 25% by 2026 . Automakers already have offtake contracts that lock in roughly two-thirds of 2027 cell capacity, tightening supply. China crossed 38% domestic EV penetration in 2024, reinforcing a cost-driven shift toward LFP chemistries for mass-market cars. Platforms adopting 800-volt architectures, such as Hyundai E-GMP, need higher energy density, which is pushing suppliers toward silicon-rich anodes and high-nickel cathodes. Those chemistry changes force cell makers to retool lines mid-cycle, squeezing margins even as volume rises.
Growth of Renewable-Integrated Storage Projects
Utility-scale battery storage installations climbed to 45 GW worldwide in 2024, with forecasts pointing to 120 GW by 2026. California mandates 11.5 GW of storage by 2026, while Texas has a 10 GW pipeline, making four-hour lithium-ion systems a cost-effective alternative to gas peakers. Ancillary service markets pay USD 15-25 per MW-hour for frequency regulation, supporting project returns near 20%. Europe's REPowerEU funding has accelerated tender volumes, though permitting delays shifted 40% of 2024 bids into later years. Developers with ready-to-build sites are therefore well positioned to capture the backlog.
Critical-Mineral Supply Constraints
Battery-grade lithium demand hit 620,000 tons LCE in 2024 and could double by 2030, yet new mine approvals lag by almost two years. Cobalt remains concentrated in the Democratic Republic of Congo, where artisanal output adds ESG risk that forces automakers to audit sub-tier suppliers. Nickel sulfate prices spiked to USD 22,000 per ton in early 2024 on Indonesian supply questions and carbon-intensity scrutiny, complicating long-term contract pricing. Recycling may cover just 10-12% of cathode metal demand by 2030 because hydrometallurgical recovery still loses around 10% of lithium.
Other drivers and restraints analyzed in the detailed report include:
- Declining Li-ion Cost Curve (Pack < USD 85/kWh)
- Rapid LFP Uptake for Cost and Safety Gains
- Safety and Thermal-Runaway Incidents
For complete list of drivers and restraints, kindly check the Table Of Contents.
Segment Analysis
Lithium-ion held 74.8% of the secondary battery market share in 2025. However, solid-state variants are forecast to post a 24.9% CAGR to 2031 as Toyota, Samsung SDI, and QuantumScape scale pilot lines. The solid-state architecture replaces liquid electrolytes with ceramic separators, enabling lithium-metal anodes that double energy density to 400-500 Wh/kg. Toyota reported 1,200 cycles at 80% retention for its sulfide-based cell and plans 10,000 units annually by 2027. QuantumScape's oxide separator passed 800 cycles with less than 10% fade, securing Volkswagen's supply for 2028 platforms.
Commercial viability hinges on manufacturing yield and raw-material availability, especially for sulfide powders. Incumbent suppliers hedge risk by licensing solid-state IP while continuing to expand conventional lines. Lead-acid batteries still serve forklifts and telecom sites because of low upfront cost, yet their share slips each year. Flow batteries grow at a 19% CAGR for multi-hour grid storage, though their contribution to the secondary battery market size remains under 1% due to high capital cost.
Cylindrical formats led the secondary battery market in 2025 with 53.5% share, underpinned by Tesla's 4680 and ubiquitous 2170 cells. Yet pouch cells are forecast to expand at 22.2% CAGR through 2031 as automakers seek thinner packs that maximize cabin space. General Motors uses LG-made pouch cells in its Ultium platform, stacking layers vertically to deliver 200 kWh per pack. Hyundai's E-GMP also favors pouch designs, which dissipate heat more evenly under 350 kW fast charging.
Manufacturing dynamics differ by region. Chinese producers lean toward prismatic cells for automation gains, European startups trial large-format pouches for premium EVs, and U.S. players balance cylindrical and pouch output to meet IRA domestic-content thresholds. The form-factor battle, therefore, reflects strategic positioning rather than one-size-fits-all design.
Complete Report Scope:
- By Technology
- Lead-acid
- Lithium-ion
- Nickel-metal Hydride
- Nickel-cadmium
- Flow Batteries
- Solid-state (pre-commercial)
- By Form Factor
- Cylindrical
- Prismatic
- Pouch
- By Application
- Electric Vehicles
- Stationary Energy Storage
- Industrial Motive Power
- Consumer Electronics
- Power Tools and Others
- By End-user Industry
- Automotive
- Utilities and Power
- Electronics and IT
- Logistics and Warehousing
- Aerospace and Defense
- Healthcare and Others
- By Geography
- North America
- United States
- Canada
- Mexico
- Europe
- United Kingdom
- Germany
- France
- Spain
- NORDIC Countries
- Russia
- Rest of Europe
- Asia-Pacific
- China
- India
- Japan
- South Korea
- ASEAN Countries
- Australia and New Zealand
- Rest of Asia-Pacific
- South America
- Brazil
- Argentina
- Colombia
- Rest of South America
- Middle East and Africa
- Saudi Arabia
- United Arab Emirates
- South Africa
- Egypt
- Rest of Middle East and Africa
- North America
Geography Analysis
Asia-Pacific dominated the secondary battery market with a 49.7% share in 2025 and is forecast to expand at a 20.1% CAGR. China's 1,200 GWh of cell capacity delivers up to 20% cost advantages through full vertical integration. South Korean suppliers focus on high-nickel chemistries that command price premiums in premium EV segments. Japan's Panasonic has seen its share slide to 18% as Chinese rivals undercut on price, yet it retains a strong foothold with Tesla.
North America is undergoing rapid supply-chain reshoring under the Inflation Reduction Act. Manufacturing tax credits of USD 35 per kWh have triggered USD 73 billion in announced investments, lifting planned capacity to 550 GWh by 2030. General Motors, Ford, and Stellantis all co-locate cell plants with vehicle assembly lines to minimize logistics costs. Canada is positioning itself as a raw-material hub, and Mexico is securing cost-sensitive assembly contracts, though labor shortages and permitting delays remain constraints.
Europe held just under one-quarter of global demand in 2025, driven by its 2035 internal-combustion ban and strict carbon-footprint rules. Northvolt's Swedish facility satisfies premium OEM needs with cells below 60 kg CO2 per kWh. Germany operates a complete ecosystem, from BASF cathode materials to Volkswagen's PowerCo cell lines. Southern and Eastern Europe attract new gigafactories because of lower labor costs and EU structural funds. South America's lithium triangle offers long-term resource security, but water scarcity and political risk slow expansion. The Middle East and Africa remain nascent, accounting for only a low single-digit share.
- CATL
- LG Energy Solution
- Panasonic Holdings
- BYD Co. Ltd
- Samsung SDI
- SK On
- Envision AESC
- Northvolt AB
- Tesla Inc. (Gigafactory)
- GS Yuasa
- Clarios
- EnerSys
- Saft Groupe
- Duracell
- Showa Denko Materials
- Toshiba SCiB
- SVOLT Energy
- CALB
- Farasis Energy
- A123 Systems
- Tianjin Lishen
- VARTA AG
- Hitachi Astemo Battery
- EVE Energy
- Amara Raja
Additional Benefits:
- The market estimate (ME) sheet in Excel format
- 3 months of analyst support
TABLE OF CONTENTS
1 Introduction
- 1.1 Study Assumptions & Market Definition
- 1.2 Scope of the Study
2 Research Methodology
3 Executive Summary
4 Market Landscape
- 4.1 Market Overview
- 4.2 Market Drivers
- 4.2.1 Surging EV adoption boosts Li-ion demand
- 4.2.2 Growth of renewable-integrated storage projects
- 4.2.3 Declining Li-ion cost curve (pack <$85/kWh)
- 4.2.4 Second-life battery repurposing ecosystems
- 4.2.5 Policy-driven localization of gigafactories
- 4.2.6 Rapid LFP uptake for cost & safety advantages
- 4.3 Market Restraints
- 4.3.1 Critical-mineral supply constraints
- 4.3.2 Safety / thermal-runaway incidents
- 4.3.3 End-of-life compliance cost escalation
- 4.3.4 Capital diversion to alternative storage tech
- 4.4 Supply-Chain Analysis
- 4.5 Regulatory Landscape
- 4.6 Technological Outlook
- 4.7 Porter's Five Forces
- 4.7.1 Bargaining Power of Suppliers
- 4.7.2 Bargaining Power of Consumers
- 4.7.3 Threat of New Entrants
- 4.7.4 Threat of Substitute Products & Services
- 4.7.5 Intensity of Competitive Rivalry
- 4.8 Battery & Raw-Material Price Trends
- 4.9 International Trade Statistics
5 Market Size & Growth Forecasts
- 5.1 By Technology
- 5.1.1 Lead-acid
- 5.1.2 Lithium-ion
- 5.1.3 Nickel-metal Hydride
- 5.1.4 Nickel-cadmium
- 5.1.5 Flow Batteries
- 5.1.6 Solid-state (pre-commercial)
- 5.2 By Form Factor
- 5.2.1 Cylindrical
- 5.2.2 Prismatic
- 5.2.3 Pouch
- 5.3 By Application
- 5.3.1 Electric Vehicles
- 5.3.2 Stationary Energy Storage
- 5.3.3 Industrial Motive Power
- 5.3.4 Consumer Electronics
- 5.3.5 Power Tools and Others
- 5.4 By End-user Industry
- 5.4.1 Automotive
- 5.4.2 Utilities and Power
- 5.4.3 Electronics and IT
- 5.4.4 Logistics and Warehousing
- 5.4.5 Aerospace and Defense
- 5.4.6 Healthcare and Others
- 5.5 By Geography
- 5.5.1 North America
- 5.5.1.1 United States
- 5.5.1.2 Canada
- 5.5.1.3 Mexico
- 5.5.2 Europe
- 5.5.2.1 United Kingdom
- 5.5.2.2 Germany
- 5.5.2.3 France
- 5.5.2.4 Spain
- 5.5.2.5 NORDIC Countries
- 5.5.2.6 Russia
- 5.5.2.7 Rest of Europe
- 5.5.3 Asia-Pacific
- 5.5.3.1 China
- 5.5.3.2 India
- 5.5.3.3 Japan
- 5.5.3.4 South Korea
- 5.5.3.5 ASEAN Countries
- 5.5.3.6 Australia and New Zealand
- 5.5.3.7 Rest of Asia-Pacific
- 5.5.4 South America
- 5.5.4.1 Brazil
- 5.5.4.2 Argentina
- 5.5.4.3 Colombia
- 5.5.4.4 Rest of South America
- 5.5.5 Middle East and Africa
- 5.5.5.1 Saudi Arabia
- 5.5.5.2 United Arab Emirates
- 5.5.5.3 South Africa
- 5.5.5.4 Egypt
- 5.5.5.5 Rest of Middle East and Africa
- 5.5.1 North America
6 Competitive Landscape
- 6.1 Market Concentration
- 6.2 Strategic Moves (M&A, Partnerships, PPAs)
- 6.3 Market Share Analysis (Market Rank/Share for key companies)
- 6.4 Company Profiles (includes Global level Overview, Market level overview, Core Segments, Financials as available, Strategic Information, Products & Services, and Recent Developments)
- 6.4.1 CATL
- 6.4.2 LG Energy Solution
- 6.4.3 Panasonic Holdings
- 6.4.4 BYD Co. Ltd
- 6.4.5 Samsung SDI
- 6.4.6 SK On
- 6.4.7 Envision AESC
- 6.4.8 Northvolt AB
- 6.4.9 Tesla Inc. (Gigafactory)
- 6.4.10 GS Yuasa
- 6.4.11 Clarios
- 6.4.12 EnerSys
- 6.4.13 Saft Groupe
- 6.4.14 Duracell
- 6.4.15 Showa Denko Materials
- 6.4.16 Toshiba SCiB
- 6.4.17 SVOLT Energy
- 6.4.18 CALB
- 6.4.19 Farasis Energy
- 6.4.20 A123 Systems
- 6.4.21 Tianjin Lishen
- 6.4.22 VARTA AG
- 6.4.23 Hitachi Astemo Battery
- 6.4.24 EVE Energy
- 6.4.25 Amara Raja
7 Market Opportunities & Future Outlook
- 7.1 White-space & Unmet-need Assessment

 全球二次電池材料市場(2026-2037 年)
 充電電池市場-全球產業規模、佔有率、趨勢、機會與預測:按技術、應用、地區和競爭格局分類,2021-2031年
 2026-2030年全球可充電電池市場
 二次電池市場規模、佔有率、趨勢和預測:按類型、應用、行業和地區分類,2026-2034年
 二次電池市場:按技術、應用和地區分類全球鈦酸鉛酸蓄電池市場規模、佔有率、趨勢和成長分析報告(2026-2034年)
 2026年全球二次電池市場報告攜帶式二次電池市場-全球產業規模、佔有率、趨勢、機會及預測(依技術、類型、地區及競爭格局分類,2021-2031年)汽車二次電池市場-全球產業規模、佔有率、趨勢、機會及預測(依技術、類型、地區及競爭格局分類,2021-2031年)
 低溫磷酸鐵鉛酸蓄電池市場依電芯類型、容量範圍、充電速率和應用分類-2026年至2032年全球預測