


 |
市場調查報告書
商品編碼
2120659
軟性顯示器:市場佔有率分析、產業趨勢與統計、成長預測(2026-2031)Flexible Display - Market Share Analysis, Industry Trends & Statistics, Growth Forecasts (2026 - 2031) |
||||||

※ 本網頁內容可能與最新版本有所差異。詳細情況請與我們聯繫。
據 Mordor Intelligence 稱,2025 年軟性顯示器市場價值為 205.2 億美元,預計將從 2026 年的 264.1 億美元成長到 2031 年的 933.2 億美元。
預測期(2026-2031 年)的複合年成長率預計為 28.73%。
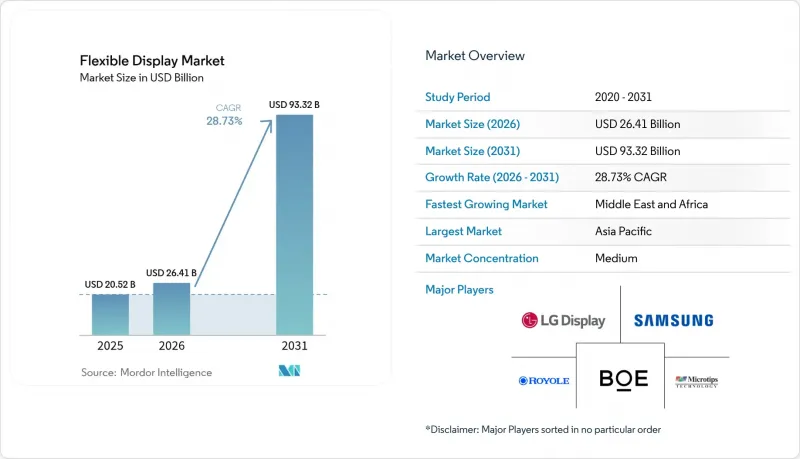
本報告按顯示類型(OLED、紙質顯示器等)、外形規格(折疊式、可捲曲、可彎曲、MicroLED等)、基板材料(玻璃、聚醯亞胺(PI)塑膠、PET/PEN塑膠、金屬箔等)、應用領域(智慧型手機和平板電腦、智慧穿戴設備、電視數位電子看板等)以及地區進行細分。市場預測以美元(USD)為單位。
全球軟性顯示器市場趨勢與洞察
在中國和韓國,捲軸式和折疊式智慧型手機的推出正逐漸興起。
2024年,軟性OLED智慧型手機面板出貨量成長26%,達到7.84億片。這清晰地表明,這種新型外形規格正在刺激市場對更換的需求。一款計劃於2025年下半年發布的新型三折屏設計,將採用360度旋轉和超薄玻璃,以降低折疊處的可見度,進一步強化品牌差異化。中國新興企業透過滿足鉸鏈耐久性目標並縮短設計到上市週期,迅速擴大規模,在價格和創新速度方面對老牌企業構成壓力。鉸鏈、耐熱聚醯亞胺和透明蓋膜等相關組件生態系統也直接受益。這股熱潮也蔓延至配件和維修市場,創造了新的業務收益來源。
歐洲高階電動車普遍採用曲面OLED駕駛座
豪華電動車 (EV) 正透過寬大的曲面儀錶板提升車內體驗,這些儀表板將多個顯示器整合在連續的玻璃面板下,例如 EQS SUV 的「Hyperscreen」。汽車製造商青睞軟性 OLED,因為它們具有超薄、亮度均勻和設計靈活性高等優點,從而大幅提升了單車面積。一級供應商正加強與面板製造商的合作,共同開發駕駛座平台,而軟體定義車輛 (SDV) 策略則要求顯示器支援持續的空中下載 (OTA) 更新。隨著自動駕駛技術的日益成熟,多模態互動和跨柱螢幕預計將進一步增加單車顯示面積(平方公尺)。
第八代及以後聚醯亞胺產量的下降推高了廢料成本。
隨著母玻璃尺寸的增加,軟性聚醯亞胺(PI)基板上的熱應力加劇,導致缺陷增多,成品率下降,單位成本上升。雖然氣凝膠增強PI纖維的研究展現出提高熱穩定性的潛力,但其工業應用仍處於早期階段,工廠在量產推出面臨高成本廢品的風險。目前,提高成品率的方案主要集中在即時線上測量和人工智慧驅動的預測性維護,以在量產開始前降低缺陷密度。
細分市場分析
預計到2025年,OLED將佔據軟性顯示器市場84.25%的佔有率。這主要歸功於OLED採用發光像素,無需背光,並可實現更薄、更易於彎曲的模組。中國製造工廠的成本降低以及沉澱設備產能的提升,正推動OLED繼續成為智慧型手機、智慧型手錶和曲面資訊娛樂叢集的首選面板。同時,microLED的出貨量正從試點階段擴展到早期量產階段,預計複合年成長率將達到35.4%,主要得益於量子點顏色轉換器、材料轉移精度和修復良率的提升。汽車抬頭顯示器和堅固耐用的穿戴式設備將率先受益,因為microLED的亮度可高達10,000尼特,並且即使在高熱負荷下也能保持較長的使用壽命,正如天馬的8英寸原型機所展示的那樣。電子紙已在低功耗標牌和物流標籤等細分市場站穩腳跟,而量子點液晶混合顯示器則繼續填補中階設備在價格和色域方面的空白。
有三個因素正在削弱OLED的統治地位。首先,無機微型LED材料的耐久性降低了人們對OLED燒屏風險的擔憂。其次,第8.6代OLED的成本優勢正在縮小剛性OLED和軟性OLED之間的平均售價差距,而低價位市場正轉向軟性外形規格。第三,片上量子點技術使得卷對卷塑膠基板的生產成為可能,為未來超大透明窗口領域的競爭埋下了伏筆。然而,考慮到生態系統的成熟、設備折舊免稅額以及充足的供應,OLED在中期內仍可能保持穩固的主導。
到2025年,折疊式設備將佔據軟性顯示器市場70.20%的佔有率,並將繼續成為銷售成長的主要驅動力,智慧型手機廠商競相開發雙折、三折和環繞式產品。與鉸鏈形狀和UTG層壓相關的專利壁壘鞏固了領先採用者的優勢,但並未阻止競爭對手透過授權或開發替代的運動學堆疊技術進入市場。預計捲軸式顯示器將以37.9%的複合年成長率成長,其緊湊的外殼設計提高了空間利用率,既滿足了消費者對大尺寸顯示區域的需求,又使其能夠輕鬆放入口袋。早期用於筆記型電腦和平板電腦的捲軸式顯示器已透過電動捲軸和限延展層壓技術,在超過3萬次的操作中展現出良好的重複性。
由於軟性可變形顯示器的機械負載相對簡單,它們仍然是曲面智慧型手機、健身手環和汽車雷達等產品的主要組成部分。一種新型的「無外形規格」顯示螢幕,透過可拉伸的基板網格和蜿蜒的電路圖案實現,目前正被積極研究用於皮膚接觸式健康貼片和軟性機器人。關於可拉伸顯示器的學術論文數量已從2014年的17篇激增至2023年的197篇,反映出研發投入的增加。儘管商業化進程相對滯後,但這項進展正在為本世紀後半葉普及環境顯示表面奠定基礎。
區域分析
到2025年,亞太地區將主導市場,佔據56.40%的銷售額,這主要得益於涵蓋韓國、中國和台灣的密集型製造生態系統,該生態系統涵蓋從聚醯亞胺樹脂合成到模組組裝的各個環節。光是中國一家企業到2028年,其軟性OLED產能就將以每年8%的速度成長,而韓國的成長速度僅為2%,這將使中國在全球面板生產中的佔有率從68%提升至74%。區域政策獎勵為當地主要企業提供了優惠的土地、稅收和電力條件,而國內智慧型手機OEM廠商也創造了強勁的需求。這種良性循環正在鞏固供應鏈的自給自足能力,並縮短新生產線實現量產的時間。
北美是技術領域的領導者,這得益於其在擴增實境/虛擬實境(AR/VR)、高效能運算和高階筆記型電腦領域的領先地位。美國品牌正在採購用於2026年MacBook的OLED面板,供應商也面臨著獲得氧化物TFT和疊層結構認證的壓力,這些認證可以延長產品在靜態使用者介面負載下的使用壽命。鉸鏈專利帶來的法律風險仍然令人擔憂,但企業通常會透過和解協議和交叉授權協議來確保產品按時上市。政府對微電子產業回歸美國的津貼可能會將部分生態系統帶回美國,尤其是在背板和無玻璃封裝模具方面。
歐洲正透過生態設計法規和即將推出的「數位產品護照」施加監管影響,推動業界全面披露可回收結構和材料資訊。德國、瑞典和英國汽車叢集板中曲面OLED叢集的快速普及,正激勵著當地的整合、黏合和測試合作夥伴。從歐洲到2030年實現24%循環材料使用的目標,正推動低溶劑含量聚醯亞胺(PI)、可生物分解黏合劑以及易於分離的機械緊固件的研發。
中東和非洲地區雖然規模相對較小,但成長速度最快,複合年成長率高達31.1%,主要得益於交通樞紐、體育場館和休閒設施中數位電子看板的廣泛應用。可貼合玻璃帷幕牆的軟性LED薄膜螢幕體現了建築業對創新造型的需求。由於政府主導的智慧城市計畫以及高環境光照條件,高亮度微型LED成為極具吸引力的選擇。南美洲也緊隨其後,這主要得益於智慧型手機普及率的提高以及越來越多的汽車組裝廠指定在出口車型中使用軟性叢集。
其他好處:
- Excel格式的市場預測(ME)表
- 3個月的分析師支持
目錄
第1章:引言
- 研究假設和市場定義
- 調查範圍
第2章:調查方法
第3章執行摘要
第4章 市場狀況
- 市場概覽
- 市場促進因素
- 中國和韓國捲軸式和折疊式智慧型手機的上市勢頭強勁
- 歐洲高階電動車曲面OLED駕駛座的普及情況
- 北美地區對用於AR/VR的輕量化微型OLED面板的需求激增
- 中國8.6代軟性OLED工廠成本降低
- 歐盟的循環經濟計劃旨在推廣無玻璃組件的廣泛使用。
- 日本和韓國軟性醫療穿戴設備的成長
- 市場限制因素
- 第八代及以後聚醯亞胺產量的下降推高了廢料成本。
- 封裝供應緊張
- 美國主導的折疊式鉸鏈專利訴訟
- 塑膠液晶顯示器在寒冷氣候下的可靠性面臨挑戰。
- 產業生態系分析
- 技術展望
- 波特五力分析
第5章 市場規模與成長預測
- 顯示類型
- OLED
- LCD
- 電子紙顯示器(EPD)
- Micro-LED
- 量子點和其他新興類型
- 按外形規格
- 折疊式
- 捲筒式
- 靈活型
- 可貼合(弧形/環繞式)
- 按基板
- 玻璃
- 塑膠 - 聚醯亞胺 (PI)
- 塑膠 - PET/PEN
- 金屬箔
- 其他材質(聚碳酸酯、超薄玻璃)
- 透過使用
- 智慧型手機和平板電腦
- 智慧型穿戴裝置(手錶、貼片)
- 電視數位電子看板
- 個人電腦和筆記型電腦
- 汽車駕駛座和資訊娛樂系統
- AR/VR頭戴式顯示器
- 工業和公共交通展覽
- 按地區
- 北美洲
- 美國
- 加拿大
- 墨西哥
- 歐洲
- 德國
- 英國
- 法國
- 義大利
- 西班牙
- 其他歐洲國家
- 亞太地區
- 中國
- 日本
- 韓國
- 印度
- 東南亞
- 其他亞太國家
- 南美洲
- 巴西
- 其他南美國家
- 中東和非洲
- 中東
- 阿拉伯聯合大公國
- 沙烏地阿拉伯
- 其他中東國家
- 非洲
- 南非
- 其他非洲國家
- 中東
- 北美洲
第6章 競爭情勢
- 市場集中度
- 策略趨勢
- 市佔率分析
- 公司簡介
- Samsung Display Co., Ltd.
- LG Display Co., Ltd.
- BOE Technology Group Co., Ltd.
- ROYOLE Corporation
- E Ink Holdings Inc.
- AU Optronics Corp.
- Sharp Corporation
- Innolux Corporation
- TCL CSOT
- Visionox Co., Ltd.
- Tianma Micro-electronics Co., Ltd.
- Truly International Holdings
- Japan Display Inc.
- Microtips Technology
- FlexEnable Technology Ltd.
- Plastic Logic Germany
- Chunghwa Picture Tubes Ltd.
- Shenzhen China Star Optoelectronics Technology
- Huawei Technologies Co., Ltd.(Panel R&D)
- Guangzhou OED Technologies Co., Ltd.
- Universal Display Corporation
第7章 市場機會與未來展望
According to Mordor Intelligence, the flexible display market size was valued at USD 20.52 billion in 2025 and estimated to grow from USD 26.41 billion in 2026 to reach USD 93.32 billion by 2031, at a CAGR of 28.73% during the forecast period (2026-2031).
This report is Segmented by Display Type (OLED, -Paper Display, and More), Form Factor (Foldable, Rollable, Bendable, Micro-LED, and More), Substrate Material (Glass, Plastic - Polyimide (PI), Plastic - PET/PEN, Metal Foil, and More), Application (Smartphones and Tablets, Smart Wearables, Televisions and Digital Signage, and More), and Geography. The Market Forecasts are Provided in Terms of Value (USD).
Global Flexible Display Market Trends and Insights
Rollable and foldable smartphone launch momentum in China and Korea
Shipments of flexible OLED smartphone panels climbed 26% in 2024 to 784 million units, underscoring how fresh form factors stimulate replacement demand.New tri-fold designs slated for late 2025 bring 360-degree rotation and ultra-thin glass that lowers crease visibility, intensifying brand differentiation. Chinese entrants scale quickly by matching hinge durability targets and shortening design-to-launch cycles, pressuring incumbents on price and innovation tempo. Component ecosystems around hinges, temperature-resistant polyimide and transparent cover films benefit directly. The upturn also spills into accessory and repair markets, creating incremental service revenue streams.
Premium-EV curved OLED cockpit adoption across Europe
Luxury electric vehicles elevate interior experience through expansive curved dashboards such as the EQS SUV Hyper-screen, which merges multiple displays under a continuous glass cover.Automotive OEMs prefer flexible OLED for its thin profile, uniform luminance and design latitude, leading to a surge in display-area per vehicle. Tier-1 suppliers deepen partnerships with panel makers to co-develop cockpit platforms, while software-defined vehicle strategies demand displays that support continuous over-the-air upgrades. As autonomous functionality matures, multi-modal interaction and stretchable pillar-to-pillar screens are set to multiply display square-meter consumption per car.
Gen-8+ polyimide yield losses elevating scrap costs
Scaling to larger mother-glass intensifies thermal stress on flexible PI substrates, driving defect-induced yield drops that inflate per-unit cost. Research on aerogel-reinforced PI fibers shows promise in lifting thermal stability yet industrial adoption remains nascent, leaving fabs exposed to expensive scrap during ramp-up.Yield recovery programmes now focus on real-time in-line metrology and AI-based predictive maintenance to shave defect density before mass output begins.
Other drivers and restraints analyzed in the detailed report include:
- Lightweight AR/VR micro-OLED demand in North America
- Cost reduction from Gen-8.6 flexible OLED fabs in China
- Encapsulation material supply crunch
For complete list of drivers and restraints, kindly check the Table Of Contents.
Segment Analysis
OLED held an 84.25% share of the flexible display market in 2025, leveraging emissive pixels that enable thinner, curve-friendly modules without backlights. Cost erosion from Chinese fabs and evaporator throughput gains have kept OLED the panel of choice for smartphones, watches and curved infotainment clusters. At the same time, micro-LED shipments are scaling from pilot to early mass production, posting a 35.4% forecast CAGR as quantum-dot colour converters, mass-transfer accuracy and repair yields improve. Automotive head-up displays and rugged wearables benefit first because micro-LED pushes brightness to 10,000 nits and delivers long lifetimes even under high thermal load, as evidenced by Tianma's 8-inch prototype. E-paper holds a niche in low-power signage and logistics tags, while quantum-dot LCD hybrids continue bridging price and colour-gamut gaps for mid-range devices.
OLED dominance faces three pressure points. First, inorganic micro-LED material longevity dilutes OLED's burn-in risk narrative. Second, Gen-8.6 cost advantages narrow the ASP gap between rigid and flexible OLED, nudging budget segments toward flexible form factors. Third, quantum-dot on-chip approaches are now compatible with roll-to-roll plastic substrates, seeding future competition in ultra-large transparent windows. Even so, ecosystem maturity, equipment depreciation and abundant supply keep OLED firmly in charge through the mid-term.
Foldable devices captured 70.20% of the flexible display market in 2025 and remain the volume engine as smartphone vendors race to iterate bi-fold, tri-fold and wrap-around formats. Patent barricades on hinge geometry and UTG lamination reinforce the lead of first movers yet do not preclude rivals that licence or innovate alternative kinematic stacks. Rollable screens, forecast to expand at a 37.9% CAGR, unlock spatial efficiency by retracting into compact housings, aligning with consumer demand for pocket-friendly yet expansive displays. Early notebook and tablet rollables demonstrate that motorised spools and stretch-limiting lamination can achieve repeatability over 30,000 actuations.
Bendable and conformable displays remain staples in curved edge phones, fitness bands and automotive radars thanks to their simpler mechanical loads. A nascent "form-factor free" class, enabled by stretchable substrate meshes and serpentine circuit patterns, is under active exploration for skin-adhesive health patches and soft robots. Academic output on stretchable displays jumped from 17 papers in 2014 to 197 in 2023, mirroring heightened R&D investment. While commercialisation lags, the progress sets the stage for ubiquitous ambient display surfaces later in the decade.
Complete Report Scope:
- By Display Type
- OLED
- LCD
- E-Paper Display (EPD)
- Micro-LED
- Quantum-Dot and Other Emerging Types
- By Form Factor
- Foldable
- Rollable
- Bendable
- Conformable (Curved/Wrap-around)
- By Substrate Material
- Glass
- Plastic - Polyimide (PI)
- Plastic - PET/PEN
- Metal Foil
- Others (Polycarbonate, Ultra-thin Glass)
- By Application
- Smartphones and Tablets
- Smart Wearables (Watches, Patches)
- Televisions and Digital Signage
- Personal Computers and Laptops
- Automotive Cockpit and Infotainment
- AR/VR Head-Mounted Displays
- Industrial and Public Transport Displays
- By Geography
- North America
- United States
- Canada
- Mexico
- Europe
- Germany
- United Kingdom
- France
- Italy
- Spain
- Rest of Europe
- Asia-Pacific
- China
- Japan
- South Korea
- India
- South East Asia
- Rest of Asia-Pacific
- South America
- Brazil
- Rest of South America
- Middle East and Africa
- Middle East
- United Arab Emirates
- Saudi Arabia
- Rest of Middle East
- Africa
- South Africa
- Rest of Africa
- Middle East
- North America
Geography Analysis
Asia Pacific dominated with 56.40% revenue in 2025, propelled by dense manufacturing ecosystems in Korea, China and Taiwan that span PI resin synthesis to module assembly. China alone is adding 8% annual flexible OLED capacity through 2028 against Korea's 2% run-rate, lifting its share of global panel output from 68% to 74%. Regional policy incentives grant favourable land, tax and power terms to local champions, while domestic smartphone OEMs provide ready demand. This virtuous cycle cements supply-chain self-sufficiency and accelerates time-to-yield for new lines.
North America commands technology pull on account of its leadership in AR/VR, high-performance computing and premium notebook segments. US brands source OLED MacBook-class panels for 2026, compelling suppliers to qualify oxide TFT and tandem stack architectures that lengthen lifetime under static UI loads. Legal exposure arising from hinge patents remains a watch-item; however, players often settle or cross-licence to safeguard launch windows. Government grants for microelectronic reshoring may redirect portions of the ecosystem stateside, particularly in backplane and glass-free encapsulation tooling.
Europe exerts regulatory influence through the Ecodesign Regulation and the upcoming Digital Product Passport, pushing the industry toward recyclable structures and full material disclosure. Automotive clusters in Germany, Sweden and the United Kingdom adopt curved OLED clusters at a brisk pace, stimulating local integration, bonding and test partners. The continent's circular material use target of 24% by 2030 drives R&D into solvent-reduced PI, biodegradable adhesives and mechanical fasteners that enable easy separation.
The Middle East and Africa, while comparatively small, records the fastest growth at a 31.1% CAGR off expanding digital signage in transport hubs, sports arenas and leisure venues. Flexible LED film screens that conform to glass facades exemplify the architectural appetite for novel form factors. Government-backed smart-city projects and high ambient-light conditions make high-brightness micro-LED an attractive option. South America follows with rising smartphone penetration and automotive assembly plants beginning to specify flexible clusters for export models.
- Samsung Display Co., Ltd.
- LG Display Co., Ltd.
- BOE Technology Group Co., Ltd.
- ROYOLE Corporation
- E Ink Holdings Inc.
- AU Optronics Corp.
- Sharp Corporation
- Innolux Corporation
- TCL CSOT
- Visionox Co., Ltd.
- Tianma Micro-electronics Co., Ltd.
- Truly International Holdings
- Japan Display Inc.
- Microtips Technology
- FlexEnable Technology Ltd.
- Plastic Logic Germany
- Chunghwa Picture Tubes Ltd.
- Shenzhen China Star Optoelectronics Technology
- Huawei Technologies Co., Ltd. (Panel R&D)
- Guangzhou OED Technologies Co., Ltd.
- Universal Display Corporation
Additional Benefits:
- The market estimate (ME) sheet in Excel format
- 3 months of analyst support
TABLE OF CONTENTS
1 INTRODUCTION
- 1.1 Study Assumptions and Market Definition
- 1.2 Scope of the Study
2 RESEARCH METHODOLOGY
3 EXECUTIVE SUMMARY
4 MARKET LANDSCAPE
- 4.1 Market Overview
- 4.2 Market Drivers
- 4.2.1 Rollable and Foldable Smartphone Launch Momentum in China and Korea
- 4.2.2 Premium-EV Curved OLED Cockpit Adoption Across Europe
- 4.2.3 Demand Spike for Lightweight AR/VR Micro-OLED Panels in North America
- 4.2.4 Cost Reduction from Gen-8.6 Flexible OLED Fabs in China
- 4.2.5 EU Circular-Economy Push for Glass-Free Modules
- 4.2.6 Growth in Flexible Medical Wearables in Japan and South Korea
- 4.3 Market Restraints
- 4.3.1 Gen-8+ Polyimide Yield Losses Elevating Scrap Costs
- 4.3.2 Encapsulation Material Supply Crunch
- 4.3.3 US-Centric Patent Litigation on Foldable Hinges
- 4.3.4 Cold-Climate Reliability Issues of Plastic-LCD Signage
- 4.4 Industry Ecosystem Analysis
- 4.5 Technological Outlook
- 4.6 Porter's Five Forces Analysis
- 4.6.1 Bargaining Power of Suppliers
- 4.6.2 Bargaining Power of Buyers
- 4.6.3 Threat of New Entrants
- 4.6.4 Threat of Substitutes
- 4.6.5 Intensity of Competitive Rivalry
5 MARKET SIZE AND GROWTH FORECASTS (VALUES)
- 5.1 By Display Type
- 5.1.1 OLED
- 5.1.2 LCD
- 5.1.3 E-Paper Display (EPD)
- 5.1.4 Micro-LED
- 5.1.5 Quantum-Dot and Other Emerging Types
- 5.2 By Form Factor
- 5.2.1 Foldable
- 5.2.2 Rollable
- 5.2.3 Bendable
- 5.2.4 Conformable (Curved/Wrap-around)
- 5.3 By Substrate Material
- 5.3.1 Glass
- 5.3.2 Plastic - Polyimide (PI)
- 5.3.3 Plastic - PET/PEN
- 5.3.4 Metal Foil
- 5.3.5 Others (Polycarbonate, Ultra-thin Glass)
- 5.4 By Application
- 5.4.1 Smartphones and Tablets
- 5.4.2 Smart Wearables (Watches, Patches)
- 5.4.3 Televisions and Digital Signage
- 5.4.4 Personal Computers and Laptops
- 5.4.5 Automotive Cockpit and Infotainment
- 5.4.6 AR/VR Head-Mounted Displays
- 5.4.7 Industrial and Public Transport Displays
- 5.5 By Geography
- 5.5.1 North America
- 5.5.1.1 United States
- 5.5.1.2 Canada
- 5.5.1.3 Mexico
- 5.5.2 Europe
- 5.5.2.1 Germany
- 5.5.2.2 United Kingdom
- 5.5.2.3 France
- 5.5.2.4 Italy
- 5.5.2.5 Spain
- 5.5.2.6 Rest of Europe
- 5.5.3 Asia-Pacific
- 5.5.3.1 China
- 5.5.3.2 Japan
- 5.5.3.3 South Korea
- 5.5.3.4 India
- 5.5.3.5 South East Asia
- 5.5.3.6 Rest of Asia-Pacific
- 5.5.4 South America
- 5.5.4.1 Brazil
- 5.5.4.2 Rest of South America
- 5.5.5 Middle East and Africa
- 5.5.5.1 Middle East
- 5.5.5.1.1 United Arab Emirates
- 5.5.5.1.2 Saudi Arabia
- 5.5.5.1.3 Rest of Middle East
- 5.5.5.2 Africa
- 5.5.5.2.1 South Africa
- 5.5.5.2.2 Rest of Africa
- 5.5.5.1 Middle East
- 5.5.1 North America
6 COMPETITIVE LANDSCAPE
- 6.1 Market Concentration
- 6.2 Strategic Moves
- 6.3 Market Share Analysis
- 6.4 Company Profiles (includes Global level Overview, Market level overview, Core Segments, Financials as available, Strategic Information, Market Rank/Share for key companies, Products and Services, and Recent Developments)
- 6.4.1 Samsung Display Co., Ltd.
- 6.4.2 LG Display Co., Ltd.
- 6.4.3 BOE Technology Group Co., Ltd.
- 6.4.4 ROYOLE Corporation
- 6.4.5 E Ink Holdings Inc.
- 6.4.6 AU Optronics Corp.
- 6.4.7 Sharp Corporation
- 6.4.8 Innolux Corporation
- 6.4.9 TCL CSOT
- 6.4.10 Visionox Co., Ltd.
- 6.4.11 Tianma Micro-electronics Co., Ltd.
- 6.4.12 Truly International Holdings
- 6.4.13 Japan Display Inc.
- 6.4.14 Microtips Technology
- 6.4.15 FlexEnable Technology Ltd.
- 6.4.16 Plastic Logic Germany
- 6.4.17 Chunghwa Picture Tubes Ltd.
- 6.4.18 Shenzhen China Star Optoelectronics Technology
- 6.4.19 Huawei Technologies Co., Ltd. (Panel R&D)
- 6.4.20 Guangzhou OED Technologies Co., Ltd.
- 6.4.21 Universal Display Corporation
7 MARKET OPPORTUNITIES AND FUTURE OUTLOOK
- 7.1 White-space and Unmet-Need Assessment

 軟性顯示器市場:預測至 2034 年 - 按顯示器類型、基板材料、外形規格、面板尺寸、應用和地區分類的全球分析
 曲面顯示設備市場規模、佔有率和成長分析:按產品類型、螢幕大小、技術、應用和地區分類-2026-2033年產業預測
 軟性顯示器市場:按顯示器類型、基板材料、應用和地區分類
 軟性顯示器市場報告:按顯示器類型、基板材料、應用和地區分類(2026-2034 年)
 軟性顯示器市場:按顯示類型、軟性類型、材料和應用分類-2026-2032年全球市場預測
 軟性顯示器市場分析及預測(至2035年):依類型、產品類型、技術、組件、應用、材料類型、裝置、製程及最終用戶分類全球軟性顯示器基板市場:預測(至2034年)-按材料類型、應用、技術、最終用戶和地區分類的分析
 2026年全球軟性顯示器市場報告電子級超薄軟性玻璃市場(依產品類型、玻璃厚度、最終用途和產業分類)-2026-2032年全球預測
 軟性顯示器市場規模、佔有率及成長分析(依基板材料、應用、面板尺寸及地區分類)-2026-2033年產業預測