


 |
市場調查報告書
商品編碼
2120642
基於雲端的災害復原服務(DRaaS):市場佔有率分析、產業趨勢與統計數據以及成長預測 (2026-2031)Disaster Recovery As A Service (DRaaS) - Market Share Analysis, Industry Trends & Statistics, Growth Forecasts (2026 - 2031) |
||||||

※ 本網頁內容可能與最新版本有所差異。詳細情況請與我們聯繫。
2025 年,基於雲端的災害復原服務(DRaaS) 市場價值為 137 億美元,預計從 2026 年的 153.1 億美元成長到 2031 年的 266.5 億美元,預測期(2026-2031 年)的複合年成長率為 11.72%。
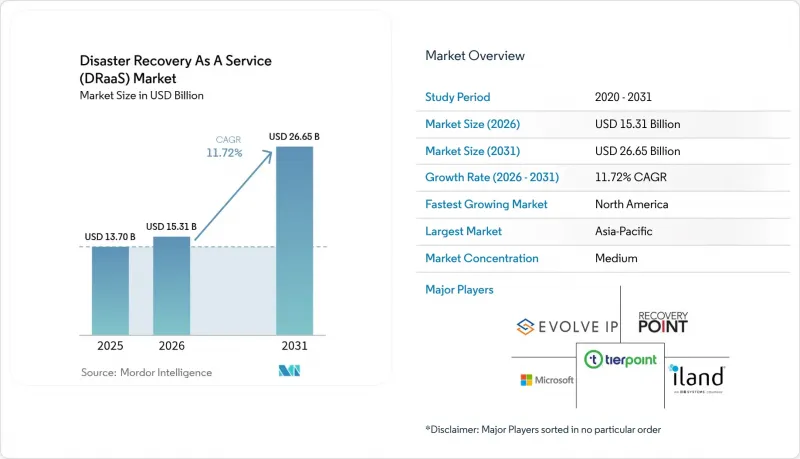
本報告按服務類型(完全託管、輔助及其他)、部署模式(公共雲端、私有雲端及其他)、服務組件(備份和恢復、即時複製及其他)、組織規模(大型企業和中小企業)、最終用戶行業(銀行、金融服務和保險 (BFSI)、IT 和電信及其他)以及地區進行細分。市場預測以美元 (USD) 為單位。
全球雲端災害復原服務(DRaaS) 市場趨勢與洞察
勒索軟體和資料外洩事件激增。
攻擊者如今能在系統被攻破後的數小時內竊取數據,迫使企業採用不可篡改的簡介和隔離的恢復區,而這些只有現代災難恢復即服務 (DRaaS) 平台才能大規模提供。到 2024 年,87% 的 IT 團隊都經歷過 SaaS 資料遺失,但只有 14% 的團隊對快速復原能力充滿信心。醫療服務提供者正在採用雲端原生恢復方案,以確保符合 HIPAA 法規並確保患者照護的連續性。網路保險公司為檢驗的容錯移轉功能提供保費折扣,這為財務長們提供了採用 DRaaS 的明確財務依據。
與傳統需量反應基礎設施相比,總擁有成本降低
災難復原即服務 (DRaaS) 無需對備用站點和專業人員進行資本投資,取而代之的是付費使用制的訂閱模式。 Veeam 的一份報告顯示,88% 的企業計劃在兩年內遷移到 DRaaS,並將成本最佳化列為主要動機。訂閱定價模式避免了硬體過時,使 IT 團隊能夠專注於轉型項目,而非硬體維護。對於中小企業而言,這種經濟模式尤其具有吸引力,因為它無需大規模投資即可實現企業級恢復,從而擴大了災難恢復即服務 (DRaaS) 市場的整體潛在規模。
混合/多重雲端中部署和編配的複雜性
將傳統本地資產與多個公共雲端整合,會增加內部團隊的負擔,並迫使企業掌握各種不同的 API 和安全模型。美國國家安全局 (NSA) 建議採用持續測試和基礎設施即程式碼 (IaC) 實踐來維護混合恢復腳本的可靠性。雖然技能匱乏導致企業越來越依賴託管災難復原即服務 (DRaaS) 合作夥伴,但隨著買家評估提供者的高階自動化能力和監管理解,銷售週期也不斷延長。
細分市場分析
到 2025 年,完全託管服務將佔據災難復原即服務 (DRaaS) 市場 46.60% 的佔有率,這主要得益於企業對承包編配、監控和合規性報告的需求。客戶依賴服務提供者進行多重雲端工程和全天候復原執行,而這些任務如果由企業自行完成,則需要大幅增加內部人員。自助服務選項雖然仍然依賴支持,但由於中小企業更傾向於可配置的入口網站,兼顧自主性和成本,其複合年成長率 (CAGR) 達到了 12.08%。輔助模式則介於兩者之間,適用於具備一定雲端技能但仍需要基於運行手冊支援的中型企業。
託管服務的蓬勃發展凸顯了一個更廣泛的現實:韌性如今已擴展到基礎設施、應用程式以及合規性證明。像HYCU這樣的供應商(其預測2025年的淨推薦值NPS將達到91)表明,服務深度和客戶體驗比功能等效性更為重要。因此,災難復原即服務(DRaaS)市場將基於服務品質呈現更清晰的細分。高級支援層級將獲得更高的年度經常性收入(ARR)倍數,而商品化的自助服務層級則將瞄準價格敏感的細分市場。
憑藉超大規模經濟效益和按需擴展能力,公共雲端仍佔57.50%的收入佔有率,但隨著企業規避集中風險並滿足資料居住要求,混合/多重雲端配置的複合年成長率 (CAGR) 正以14.15%的速度成長。混合部署中基於雲端的災害復原服務(DRaaS) 的市場規模預計將快速擴張,因為企業可以將關鍵資料庫複製到其國內雲,同時容錯移轉不太重要的應用程式故障轉移到全球其他地區。私有雲端仍然用於需要嚴格資料分類和空氣間隙的工作負載。
Verizon認為混合環境的柔軟性對於現代業務永續營運計畫至關重要。 N2WS Research的一項研究也支持這一觀點,該研究指出,多重雲端複製可以減少廠商鎖定並提高故障轉移的精細度。然而,在不同的雲端環境中實現相同的復原時間目標(容錯移轉)仍然十分複雜,因此,能夠抽象化雲端原生特性的工具的需求日益成長。
區域分析
北美憑藉著超大規模雲端可用性、成熟的網路保險生態系統和規範的法律規範,預計到2025年將維持39.30%的市場佔有率。儘管勒索軟體的蔓延加劇了董事會層面的緊迫性,但《聯邦雲端運營最佳實踐指南》為公共機構提供了藍圖。特別是金融機構,透過將可驗證的災害復原(DR) 測試與保費折扣掛鉤,進一步推動了雲端技術的採用。該地區的災害復原即服務 (DRaaS) 市場目前在價格方面競爭激烈,但由於邊緣部署的增加和ESG報告的擴展,市場需求仍然強勁。
亞太地區正以14.25%的年複合成長率創歷史新高,世界各國政府正積極推動雲端運算發展以促進GDP成長。亞洲開發銀行(亞銀)預測,改善雲端運算政策可望在2024年至2028年間將該地區GDP提升至多0.7%。新加坡積極推行的「雲端優先」策略正在樹立政策標桿,而日本和澳洲則正在實施嚴格的資料主權檢查,為架構藍圖奠定基礎。隨著自然災害風險的日益逼近,部署高彈性的ICT骨幹網路已成為必然之舉,各機構正參考亞銀《2025年災害防備指南》,整合人工智慧感測器和基於雲端的復原能力。銀行正在採用災難復原即服務(DRaaS)以跟上金融科技的敏捷步伐,而製造商則依靠地理位置分散的容錯移轉來確保供應鏈的穩定性。
在歐洲,採用獎勵與合規障礙之間存在著平衡。 GDPR 和即將生效的歐盟雲端認證法案強制要求歐盟內部複製,這不僅帶來了設計上的限制,也刺激了對主權、僅限歐盟的恢復節點的需求。永續性法規正在推動人們對「綠色災難復原即服務 (DRaaS)」的興趣,利用可再生能源運作的資料中心來實現企業減排目標。公共部門的數位化服務目標正在加速與服務提供者的合作,而金融機構也在持續投資以滿足《數位營運彈性法案》(DORA) 的要求。儘管面臨成本壓力,但為公民提供持續服務的需求仍在推動市場擴張。
其他好處:
- Excel格式的市場預測(ME)表
- 3個月的分析師支持
目錄
第1章:引言
- 研究假設和市場定義
- 調查範圍
第2章:調查方法
第3章執行摘要
第4章 市場狀況
- 市場概覽
- 市場促進因素
- 勒索軟體和資料外洩事件增加
- 與傳統需量反應基礎設施相比,總擁有成本降低
- 「雲端優先」方法和 SaaS 的採用正在加速 DRaaS 的普及。
- 自動容錯移轉測試是網路保險的強制性合規要求。
- 邊緣運算的引入需要地理位置分散的微型恢復節點。
- 綠色災難復原即服務:實現淨零排放的壓力使採用可再生能源的復原中心具有優勢。
- 市場限制因素
- 混合/多重雲端中部署和編配的複雜性。
- 資料主權和跨境複製的監管壁壘
- 供應商鎖定和遷移成本的不確定性
- 多重雲端復原工程師和技能短缺
- 產業生態系分析
- 技術展望
- 波特五力分析
第5章 市場規模與成長預測
- 按服務類型
- 全託管
- 輔助型
- 自助服務
- 按部署模式
- 公共雲端
- 私有雲端
- 混合/多重雲端
- 服務組件分解
- 備份和復原
- 即時複製
- 編配與自動化
- 資料安全與合規性
- 按組織規模
- 大公司
- 小型企業
- 按最終用戶行業分類
- BFSI
- IT/通訊
- 政府/公共部門
- 醫療保健和生命科學
- 製造業
- 零售與電子商務
- 媒體與娛樂
- 其他
- 按地區
- 北美洲
- 美國
- 加拿大
- 墨西哥
- 南美洲
- 巴西
- 其他南美國家
- 歐洲
- 德國
- 英國
- 法國
- 俄羅斯
- 其他歐洲國家
- 亞太地區
- 中國
- 日本
- 韓國
- 印度
- 東南亞
- 其他亞太國家
- 中東和非洲
- 中東
- 非洲
- 北美洲
第6章 競爭情勢
- 市場集中度
- 策略趨勢
- 市佔率分析
- 公司簡介
- IBM Corporation
- Microsoft Corporation
- Amazon Web Services Inc.
- VMware Inc.
- Zerto Ltd.(HPE)
- Google Cloud Platform
- iLand Internet Solutions Inc.
- Recovery Point Systems LLC
- Evolve IP LLC
- TierPoint LLC
- Sungard Availability Services LP
- C&W Communications Limited
- Expedient LLC
- CloudHPT Inc.
- InterVision Systems Technologies LLC
- PhoenixNAP Global IT Services LLC
- Flexential LLC
- Acronis International GmbH
- Veeam Software Inc.
- Druva Inc.
- Rackspace Technology inc.
- Databarracks Ltd.
- NTT Ltd.
第7章 市場機會與未來展望
According to Mordor Intelligence, the disaster recovery as a Service market size was valued at USD 13.7 billion in 2025 and estimated to grow from USD 15.31 billion in 2026 to reach USD 26.65 billion by 2031, at a CAGR of 11.72% during the forecast period (2026-2031).
This report is Segmented by Service Type (Fully Managed, Assisted, and More), Deployment Model (Public Cloud, Private Cloud, and More), Service Component (Backup and Recovery, Real-Time Replication, and More), Organization Size (Large Enterprises, Small and Medium Enterprises), End-User Vertical (BFSI, IT and Telecom, and More), and Geography. The Market Forecasts are Provided in Terms of Value (USD).
Global Disaster Recovery As A Service (DRaaS) Market Trends and Insights
Escalating ransomware and data-breach incidents
Attackers now exfiltrate data within hours after compromise, forcing organizations to adopt immutable snapshots and isolated recovery zones that only modern DRaaS platforms supply at scale.In 2024, 87% of IT teams experienced SaaS data loss, yet only 14% felt confident about rapid recovery. Healthcare providers embrace cloud-native recovery to stay HIPAA-compliant and safeguard patient care continuity. Cyber-insurance carriers reward verified failover capabilities with premium discounts, giving CFOs a clear financial argument for DRaaS adoption.
Lower TCO versus traditional DR infrastructure
DRaaS removes capital spending on secondary sites and specialist staff, replacing them with pay-as-you-go subscriptions that align cost to use. Veeam reports that 88% of organizations plan to shift toward DRaaS within two years, ranking cost optimization as their top motivation. Subscription pricing prevents hardware obsolescence and frees IT teams to focus on transformation projects rather than hardware upkeep. SMEs find the economics especially compelling because enterprise-grade recovery becomes attainable without scale-driven investments, broadening the total addressable Disaster Recovery as a Service market.
Deployment and orchestration complexity in hybrid/multi-cloud
Integrating legacy on-premises assets with several public clouds stretches internal teams and forces organizations to learn disparate APIs and security models. The US National Security Agency advises constant testing and infrastructure-as-code practices to keep hybrid recovery scripts reliable. Skills shortages drive reliance on managed DRaaS partners but also prolong sales cycles, as buyers evaluate providers for deep automation and regulatory comprehension.
Other drivers and restraints analyzed in the detailed report include:
- Cloud-first and SaaS adoption accelerating DRaaS uptake
- Cyber-insurance compliance mandating automated fail-over testing
- Data-sovereignty and regulatory barriers
For complete list of drivers and restraints, kindly check the Table Of Contents.
Segment Analysis
Fully Managed offerings controlled 46.60% of Disaster Recovery as a Service market share in 2025 on the back of enterprise demand for turnkey orchestration, monitoring, and compliance reporting. Customers lean on providers for multi-cloud engineering and 24X7 recovery execution, activities that would otherwise balloon internal headcount. Self-Service options, though lean on assistance, post a 12.08% CAGR because SMEs prefer configurable portals that balance autonomy with cost. Assisted models sit between both ends, suiting mid-market firms that own some cloud skills yet still need run-book support.
Managed service momentum underscores a broader reality: resilience now spans infrastructure, applications, and regulatory proof. Vendors like HYCU, which scored a 91 NPS in 2025, showcase how service depth and customer experience trump feature parity. As a result, the Disaster Recovery as a Service market will likely witness sharper service-quality segmentation, where premium support tiers justify higher annual-recurring-revenue multiples, while commodity self-service tiers chase price-sensitive niches.
Public Cloud retains 57.50% revenue thanks to hyperscale economies and on-demand scalability, yet Hybrid/Multi-Cloud configurations command a 14.15% CAGR as firms hedge concentration risk and satisfy residency rules. Disaster Recovery as a Service market size for Hybrid deployments is forecast to expand swiftly because enterprises can replicate critical databases to a sovereign cloud while failing over less-sensitive apps to global regions. Private Cloud persists for workloads steeped in strict data classifications or requiring air-gapping.
Verizon calls hybrid flexibility the linchpin of modern continuity planning verizon. N2WS research agrees, noting that multi-cloud replication cuts vendor lock-in and improves failover granularity. However, orchestrating identical recovery time objectives across divergent clouds remains complex, opening room for tooling that abstracts cloud-native idiosyncrasies.
Complete Report Scope:
- By Service Type
- Fully Managed
- Assisted
- Self-Service
- By Deployment Model
- Public Cloud
- Private Cloud
- Hybrid/Multi-Cloud
- By Service Component
- Backup and Recovery
- Real-time Replication
- Orchestration and Automation
- Data Security and Compliance
- By Organization Size
- Large Enterprises
- Small and Medium Enterprises
- By End-user Vertical
- BFSI
- IT and Telecom
- Government and Public Sector
- Healthcare and Life Sciences
- Manufacturing
- Retail and E-commerce
- Media and Entertainment
- Others
- By Geography
- North America
- United States
- Canada
- Mexico
- South America
- Brazil
- Rest of South America
- Europe
- Germany
- United Kingdom
- France
- Russia
- Rest of Europe
- Asia-Pacific
- China
- Japan
- South Korea
- India
- South East Asia
- Rest of Asia-Pacific
- Middle East and Africa
- Middle East
- Africa
- North America
Geography Analysis
North America maintained a 39.30% share in 2025 by blending hyperscale cloud availability, mature cyber-insurance ecosystems, and prescriptive regulatory frameworks. High ransomware prevalence amplifies board-level urgency, while the Federal Cloud Operations Best Practices Guide supplies public agencies with blueprint standards. Financial institutions, in particular, tie premium discounts to demonstrable DR testing, further cementing uptake. Although the region's Disaster Recovery as a Service market now sees price competition, rising edge deployments and ESG reporting keep demand resilient.
Asia-Pacific registers the highest 14.25% CAGR as governments champion cloud growth to spur GDP. The Asian Development Bank projects that improved cloud policies can lift regional GDP by up to 0.7% between 2024 and 2028. Singapore's aggressive "cloud-first" posture sets policy benchmarks, while Japan and Australia impose rigorous data-sovereignty checks that shape architectural blueprints. National disaster exposure drives mandates for resilient ICT backbones, with agencies referencing ADB's 2025 disaster-preparedness guide to integrate AI sensors and cloud-based recovery. Banks adopt DRaaS to match fintech agility, and manufacturers rely on geo-distributed failover for supply-chain assurance.
Europe balances adoption incentives and compliance roadblocks. GDPR and incoming EU Cloud Certification laws oblige in-region replication, constraining design but also triggering demand for sovereignty-aligned "intra-EU only" recovery nodes. Sustainability legislation boosts interest in "Green-DRaaS," leveraging renewable-powered data centers to hit corporate emissions targets.Public-sector digital-service goals accelerate provider outreach, while financial entities continue to invest to satisfy the Digital Operational Resilience Act (DORA). Despite cost pressure, the imperative to preserve citizen-facing services keeps the market expanding.
- IBM Corporation
- Microsoft Corporation
- Amazon Web Services Inc.
- VMware Inc.
- Zerto Ltd. (HPE)
- Google Cloud Platform
- iLand Internet Solutions Inc.
- Recovery Point Systems LLC
- Evolve IP LLC
- TierPoint LLC
- Sungard Availability Services LP
- C&W Comminications Limited
- Expedient LLC
- CloudHPT Inc.
- InterVision Systems Technologies LLC
- PhoenixNAP Global IT Services LLC
- Flexential LLC
- Acronis International GmbH
- Veeam Software Inc.
- Druva Inc.
- Rackspace Technology inc.
- Databarracks Ltd.
- NTT Ltd.
Additional Benefits:
- The market estimate (ME) sheet in Excel format
- 3 months of analyst support
TABLE OF CONTENTS
1 INTRODUCTION
- 1.1 Study Assumptions and Market Definition
- 1.2 Scope of the Study
2 RESEARCH METHODOLOGY
3 EXECUTIVE SUMMARY
4 MARKET LANDSCAPE
- 4.1 Market Overview
- 4.2 Market Drivers
- 4.2.1 Escalating ransomware and data-breach incidents
- 4.2.2 Lower TCO vs. traditional DR infrastructure
- 4.2.3 Cloud-first and SaaS adoption accelerating DRaaS uptake
- 4.2.4 Cyber-insurance compliance mandating automated fail-over testing
- 4.2.5 Edge-computing roll-outs needing geo-distributed micro-recovery nodes
- 4.2.6 Green-DRaaS: Net-zero pressures favouring renewably-powered recovery sites
- 4.3 Market Restraints
- 4.3.1 Deployment and orchestration complexity in hybrid/multi-cloud
- 4.3.2 Data-sovereignty and regulatory barriers to cross-border replication
- 4.3.3 Provider lock-in and egress-cost uncertainty
- 4.3.4 Shortage of multi-cloud DR engineers and skills
- 4.4 Industry Ecosystem Analysis
- 4.5 Technological Outlook
- 4.6 Porter's Five Forces Analysis
- 4.6.1 Bargaining Power of Suppliers
- 4.6.2 Bargaining Power of Consumers
- 4.6.3 Threat of New Entrants
- 4.6.4 Intensity of Competitive Rivalry
- 4.6.5 Threat of Substitutes
5 MARKET SIZE AND GROWTH FORECASTS (VALUES)
- 5.1 By Service Type
- 5.1.1 Fully Managed
- 5.1.2 Assisted
- 5.1.3 Self-Service
- 5.2 By Deployment Model
- 5.2.1 Public Cloud
- 5.2.2 Private Cloud
- 5.2.3 Hybrid/Multi-Cloud
- 5.3 By Service Component
- 5.3.1 Backup and Recovery
- 5.3.2 Real-time Replication
- 5.3.3 Orchestration and Automation
- 5.3.4 Data Security and Compliance
- 5.4 By Organization Size
- 5.4.1 Large Enterprises
- 5.4.2 Small and Medium Enterprises
- 5.5 By End-user Vertical
- 5.5.1 BFSI
- 5.5.2 IT and Telecom
- 5.5.3 Government and Public Sector
- 5.5.4 Healthcare and Life Sciences
- 5.5.5 Manufacturing
- 5.5.6 Retail and E-commerce
- 5.5.7 Media and Entertainment
- 5.5.8 Others
- 5.6 By Geography
- 5.6.1 North America
- 5.6.1.1 United States
- 5.6.1.2 Canada
- 5.6.1.3 Mexico
- 5.6.2 South America
- 5.6.2.1 Brazil
- 5.6.2.2 Rest of South America
- 5.6.3 Europe
- 5.6.3.1 Germany
- 5.6.3.2 United Kingdom
- 5.6.3.3 France
- 5.6.3.4 Russia
- 5.6.3.5 Rest of Europe
- 5.6.4 Asia-Pacific
- 5.6.4.1 China
- 5.6.4.2 Japan
- 5.6.4.3 South Korea
- 5.6.4.4 India
- 5.6.4.5 South East Asia
- 5.6.4.6 Rest of Asia-Pacific
- 5.6.5 Middle East and Africa
- 5.6.5.1 Middle East
- 5.6.5.2 Africa
- 5.6.1 North America
6 COMPETITIVE LANDSCAPE
- 6.1 Market Concentration
- 6.2 Strategic Moves
- 6.3 Market Share Analysis
- 6.4 Company Profiles (includes Global level Overview, Market level overview, Core Segments, Financials as available, Strategic Information, Market Rank/Share for key companies, Products and Services, and Recent Developments)
- 6.4.1 IBM Corporation
- 6.4.2 Microsoft Corporation
- 6.4.3 Amazon Web Services Inc.
- 6.4.4 VMware Inc.
- 6.4.5 Zerto Ltd. (HPE)
- 6.4.6 Google Cloud Platform
- 6.4.7 iLand Internet Solutions Inc.
- 6.4.8 Recovery Point Systems LLC
- 6.4.9 Evolve IP LLC
- 6.4.10 TierPoint LLC
- 6.4.11 Sungard Availability Services LP
- 6.4.12 C&W Comminications Limited
- 6.4.13 Expedient LLC
- 6.4.14 CloudHPT Inc.
- 6.4.15 InterVision Systems Technologies LLC
- 6.4.16 PhoenixNAP Global IT Services LLC
- 6.4.17 Flexential LLC
- 6.4.18 Acronis International GmbH
- 6.4.19 Veeam Software Inc.
- 6.4.20 Druva Inc.
- 6.4.21 Rackspace Technology inc.
- 6.4.22 Databarracks Ltd.
- 6.4.23 NTT Ltd.
7 MARKET OPPORTUNITIES AND FUTURE OUTLOOK
- 7.1 White-space and Unmet-need Assessment

 災難復原即服務 (DRaaS) 市場:按 DRaaS 類型、服務、供應商、部署模式、企業、最終用戶產業和地區分類
 全球災害復原服務(DRaaS) 市場規模、佔有率、趨勢和成長分析報告(2026-2034 年)
 災難復原即服務 (DRaaS) 市場 – 全球市場預測 2026–2032買家指南:數位體驗平台,2026 年
 災難復原即服務 (DRaaS) 市場:市場機會、成長促進因素、產業趨勢分析與未來預測 (2026-2035)
 災害復原解決方案市場規模、佔有率和成長分析:按組件、部署模型、復原類型、組織規模、企業工作負載、最終用戶產業和地區分類-2026-2033 年產業預測
 RTO市場預測至2034年—按容量、設計配置、技術、應用和區域分類的全球分析災難復原即服務 (DRaaS) 市場預測至 2034 年-按服務類型、組織規模、部署類型、營運模式、最終使用者和地區分類的全球分析
 災害復原服務(DRaaS) 市場規模、佔有率、趨勢和預測:按服務類型、服務供應商、部署模式、最終用戶、產業和地區分類,2026-2034 年
 2026-2030年全球災害復原服務(DRAAS)市場