


 |
市場調查報告書
商品編碼
2120617
企業防火牆:市場佔有率分析、產業趨勢與統計及成長預測(2026-2031 年)Enterprise Firewall - Market Share Analysis, Industry Trends & Statistics, Growth Forecasts (2026 - 2031) |
||||||

※ 本網頁內容可能與最新版本有所差異。詳細情況請與我們聯繫。
根據 Mordor Intelligence 估計,企業防火牆市場在 2026 年的價值將達到 151.2 億美元,從 2025 年的 137.2 億美元成長到 2031 年的 246.1 億美元。
預計 2026 年至 2031 年的複合年成長率為 10.23%。
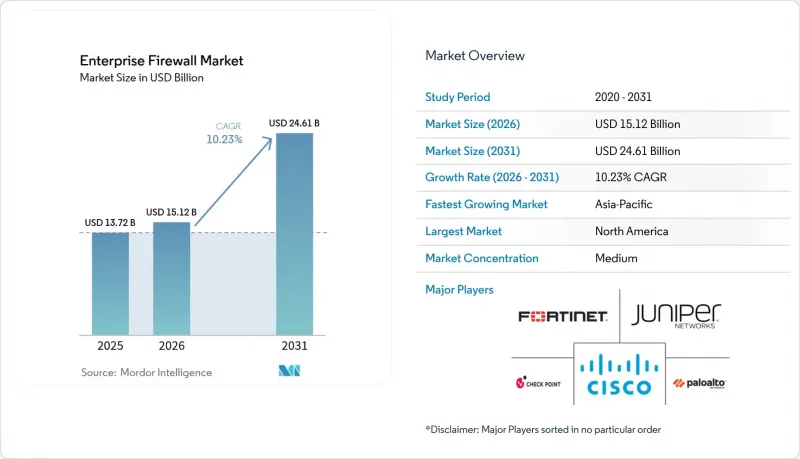
本報告按部署類型(本地設備、雲端原生 FWaaS、混合和虛擬設備)、組件(硬體設備、虛擬設備軟體、託管服務和專業服務)、企業規模(小規模和微企業、中型企業、大型企業)、最終用戶行業(銀行、金融服務和保險、醫療保健和生命科學、其他)以及地區進行分類。
全球企業防火牆市場趨勢與洞察
進階多向量攻擊
攻擊者如今正利用合法軟體和人工智慧技術,在一次攻擊宣傳活動中滲透終端、雲端工作負載和橫向通道,使得靜態規則集失效。帕洛阿爾托網路公司(Palo Alto Networks)的研究表明,2024 年 86% 的事件將直接導致業務中斷,這促使企業部署能夠整合分散式感測器即時情報的新一代防火牆。一家全球電信營運商在其網域控制器之外發現了 200 多個特權會話,凸顯了東西向通訊盲區的嚴重性。供應商正在整合基於機器學習的偵測功能來識別行為異常,使企業能夠在毫秒內隔離可疑流量,並縮短入侵後的潛伏時間。
混合遠距辦公架構的迅速普及
分散式辦公團隊依賴家庭網路和非託管設備,這使得威脅面遠遠超出資料中心邊界。企業正在轉向安全存取服務邊際(SASE) 模型,該模型將身分、設備健康狀況和防火牆控制整合到雲端的單一執行點中。微軟指出,由於加密的 VPN 隧道通常會繞過傳統的安全檢查,許多公司正在轉向防火牆即服務 (FWaaS),該服務允許無論用戶從何處連接,都可以應用統一的安全措施。貝爾加拿大和帕洛阿爾托網路等公司的合作案例表明,電信公司正在將人工智慧驅動的防火牆整合到遠端團隊的託管連接中。
中小企業的預算限制
許多中小企業缺乏專職安全負責人,被迫將有限的資金用於核心運營,導致高級防火牆的普及速度緩慢。雖然網路保險公司現在為訂閱資安管理服務的投保人提供保費折扣,但在價格敏感地區,初始訂閱費用仍然是購買的一大障礙。為了解決這個問題,供應商正在透過提供入門級雲端防火牆來降低採用門檻,這些防火牆配備自動回應模板和基於使用量的收費模式。
細分市場分析
到2025年,本地部署設備在企業防火牆市場仍將佔據46.58%的佔有率,這得益於其可預測的吞吐量以及監管機構對空氣間隙設計的保障。儘管由於協議遷移的不確定性導致更新周期延長,但就收入而言,該細分市場仍佔據企業防火牆市場規模的最大佔有率。在資料中心運行對延遲敏感的工作負載的企業仍然傾向於使用整合加速器的專用硬體,以實現高速TLS檢測。
雲端原生防火牆即服務 (FWaaS) 預計到 2031 年將以 13.68% 的複合年成長率成長,它提供集中式策略管理、彈性可擴展性和「按需收費」的經濟模式,滿足採用多重雲端和遠端辦公策略的企業的需求。此模式也簡化了合規性證據管理,因為提供者可以透過入口網站提供持續的稽核日誌。虛擬設備彌合了這一差距,使企業能夠在私有雲端和邊緣位置複製規則集而無需交付硬體,從而促進零信任遷移中的分店部署。這種混合方法凸顯了當前的趨勢,即買家不再預設選擇單一架構,而是根據工作負載的位置來確定防火牆的外形規格。
到2025年,硬體設備將佔總收入的47.65%,這反映出市場對確定性效能、基於硬體的加密卸載以及滿足審計團隊要求的防篡改設計的強勁需求。雖然企業防火牆市場的這一佔有率預計將穩定成長,但隨著買家將預算轉向能夠最大限度發揮設備潛力的生命週期服務,其佔比預計將會下降。
預計託管服務和專業服務將以 13.52% 的複合年成長率成長,因為持續調優、威脅情報整合和合規性報告等任務已超出許多內部團隊的處理能力。服務供應商正在打包符合 DORA、HIPAA 和行業特定標準的方案,以幫助客戶縮短平均回應時間並滿足監管要求。雖然供應商正擴大將人工智慧驅動的輔助系統整合到管理主機中,但人類專家對於理解異常情況的背景以及使措施與不斷變化的業務目標保持一致仍然至關重要。
區域分析
北美市場引領潮流,預計到2025年將佔全球銷售額的35.02%,這主要得益於嚴格的聯邦法規和高昂的資料外洩應對成本,促使企業積極主動地進行採購。該地區的企業正日益標準化零信任架構,並選擇整合平台來消除營運上的割裂。貝爾加拿大公司與帕洛阿爾托網路公司之間的合作,正是電信業者如何將人工智慧驅動的防火牆與網路連線結合,以支援分散式員工工作的典範。
預計亞太地區將成為所有地區中成長最快的地區,到2031年複合年成長率將達到12.38%。印度、印尼和日本政府強烈要求對公民資料進行國內審查,這推動了可部署在特定國家雲端平台上的防火牆的採購。中國本土供應商正透過提供符合加密法規且以中文處理威脅情報的內嵌機器學習模組來擴大市場佔有率。跨國雲端服務供應商正與區域安全營運中心(SOC)營運商合作,以在滿足主權要求的同時,保持全球遙測覆蓋範圍。
在歐洲,受GDPR和即將推出的DORA框架的推動,安全防護領域正保持穩定發展動能。 DORA框架強制要求可驗證的資料隔離和事件報告。 SonicWall新建的歐洲安全營運中心(SOC)體現了廠商的投資,旨在根據居住法律提供在地化的資料處理和快速回應。德國和英國正致力於打擊工業間諜活動,而法國和西班牙則在投資雲端防火牆,以實現針對多重雲端部署的租戶特定隔離措施。
其他福利
- Excel格式的市場預測(ME)表
- 3個月的分析師支持
目錄
第1章:引言
- 研究假設和市場定義
- 調查範圍
第2章:調查方法
第3章執行摘要
第4章 市場狀況
- 市場概覽
- 市場促進因素
- 網路攻擊正變得越來越複雜和多方面。
- 混合遠距辦公架構的迅速普及
- 零信任和分段的監管要求
- 需要東西方安全性的雲端工作負載激增
- 人工智慧驅動的多態惡意軟體給自適應防火牆帶來了壓力。
- 新興國家的主權交通檢查條款
- 市場限制因素
- 中小企業的預算限制
- 缺乏管理複雜政策的技能
- 向 IPv6 過渡將延緩硬體更新周期。
- 基於資料居住要求遷移到區域雲端安全營運中心 (SOC)
- 產業價值鏈分析
- 監理情勢
- 技術展望
- 產業吸引力—五力分析
- 新進入者的威脅
- 買方的議價能力
- 供應商的議價能力
- 替代品的威脅
- 競爭公司之間的競爭
- 宏觀經濟因素對市場的影響
第5章 市場規模與成長預測
- 依部署類型
- 現場設備
- 雲端原生防火牆即服務 (FWaaS)
- 混合虛擬設備
- 按組件
- 硬體設備
- 虛擬設備軟體
- 託管服務和專業服務
- 按公司規模
- 小規模和微企業(員工人數少於100人)
- 中型企業(100-999人)
- 大型公司(超過1000人)
- 按最終用戶行業分類
- BFSI
- 醫療保健和生命科學
- 製造業和工業
- 政府/國防
- 零售與電子商務
- 通訊與媒體
- 教育/研究
- 能源與公共產業
- 其他
- 按地區
- 北美洲
- 美國
- 加拿大
- 墨西哥
- 南美洲
- 巴西
- 阿根廷
- 智利
- 其他南美國家
- 歐洲
- 德國
- 英國
- 法國
- 義大利
- 西班牙
- 俄羅斯
- 其他歐洲國家
- 亞太地區
- 中國
- 印度
- 日本
- 韓國
- 新加坡
- 馬來西亞
- 澳洲
- 其他亞太國家
- 中東和非洲
- 中東
- 阿拉伯聯合大公國
- 沙烏地阿拉伯
- 土耳其
- 其他中東國家
- 非洲
- 南非
- 奈及利亞
- 埃及
- 其他非洲地區
- 中東
- 北美洲
第6章 競爭情勢
- 市場集中度
- 策略趨勢
- 市佔率分析
- 公司簡介
- Fortinet, Inc.
- Palo Alto Networks, Inc.
- Check Point Software Technologies Ltd.
- Cisco Systems, Inc.
- Juniper Networks, Inc.
- Sophos Ltd.
- WatchGuard Technologies, Inc.
- SonicWall LLC
- Forcepoint LLC
- Barracuda Networks, Inc.
- Hillstone Networks Co., Ltd.
- Stormshield SAS
- AhnLab, Inc.
- Clavister AB
- Untangle, Inc.
- GajShield Infotech (India) Pvt. Ltd.
- F-Secure Corp.
- OPNsense(Deciso BV)
- Gateworks Corp.
- Sangfor Technologies Inc.
- Huawei Technologies Co., Ltd.
- Hillstone Networks
- Array Networks, Inc.
- Stonesoft Oy(McAfee 的子公司)
- Netgate(ESF)
第7章 市場機會與未來趨勢
- 評估閒置頻段和未滿足的需求
According to Mordor Intelligence, the enterprise firewall market size in 2026 is estimated at USD 15.12 billion, growing from 2025 value of USD 13.72 billion with 2031 projections showing USD 24.61 billion, growing at 10.23% CAGR over 2026-2031.
This report is Segmented by Deployment Type (On-Premise Appliance, Cloud-Native Firewall-As-A-Service, and Hybrid/Virtual Appliance), Component (Hardware Appliance, Virtual Appliance/Software, and Managed and Professional Services), Enterprise Size (Small and Micro Enterprises, Mid-Sized Enterprises, and Large Enterprises), End-User Industry (BFSI, Healthcare and Life Sciences, and More), and Geography.
Global Enterprise Firewall Market Trends and Insights
Escalating Sophistication of Multi-Vector Attacks
Attackers now weaponize legitimate software and AI to breach endpoints, cloud workloads, and lateral pathways in one campaign, leaving static rule sets ineffective. Palo Alto Networks observed that 86% of incidents in 2024 caused direct business disruption, prompting enterprises to deploy next-generation firewalls that correlate real-time intelligence across distributed sensors. A global telecom uncovered more than 200 privileged sessions sitting outside domain controllers, underscoring east-west blind spots. Vendors embed machine-learning inspection to flag behavioral anomalies, enabling enterprises to quarantine suspicious traffic within milliseconds and cut dwell time.
Rapid Adoption of Hybrid and Remote Work Architectures
Decentralized workforces rely on home networks and unmanaged devices, expanding the threat surface far beyond data-center perimeters. Organizations shift toward secure access service edge models that fuse identity, device health, and firewall controls inside a single cloud point of enforcement. Microsoft notes that encrypted VPN tunnels often evade traditional inspection, so many firms migrate to Firewall-as-a-Service for uniform policy wherever users connect. Partnerships such as Bell Canada with Palo Alto Networks highlight how carriers wrap AI-powered firewalls around managed connectivity for remote teams.
Budget Constraints Among SMBs
Many small firms lack full-time security personnel and face pressure to allocate limited capital to core operations, slowing the adoption of advanced firewalls. Cyber-insurance carriers now offer premium reductions to policyholders that deploy managed security services, but up-front subscription costs still deter buyers in price-sensitive regions. Vendors respond with entry-level cloud firewalls that include automated policy templates and usage-based billing, lowering procurement hurdles.
Other drivers and restraints analyzed in the detailed report include:
- Regulatory Mandates for Zero-Trust and Segmentation
- Cloud Workload Proliferation Requiring East-West Security
- Skills Shortage to Manage Complex Policies
For complete list of drivers and restraints, kindly check the Table Of Contents.
Segment Analysis
On-premise appliances retained 46.58% of the 2025 enterprise firewall market share on the back of predictable throughput and regulatory comfort with air-gapped designs. In revenue terms, the segment accounted for the largest slice of the enterprise firewall market size, even as refresh cycles extend because of protocol migration uncertainty. Enterprises running latency-sensitive workloads in data centers continue to favor purpose-built hardware that embeds accelerators for high-speed TLS inspection.
Cloud-native Firewall-as-a-Service, advancing at a 13.68% CAGR through 2031, brings centralized policy, elastic scale, and pay-as-you-grow economics that resonate with firms embracing multicloud and remote work strategies. The model also simplifies compliance evidence because providers surface continuous audit logs via portals. Virtual appliances sit between both worlds, letting enterprises replicate rule sets across private clouds and edge locations without shipping hardware, which eases branch rollouts during zero-trust transitions. The blended approach underlines how buyers now map firewall form factor to workload locality rather than defaulting to a single architecture.
Hardware appliances captured 47.65% of 2025 revenues, reflecting persistent demand for deterministic performance, hardware encryption offload, and tamper-resistant designs that satisfy audit teams. This slice of the enterprise firewall market size is expected to grow steadily, yet its proportion declines as buyers shift budget toward lifecycle services that unlock the appliance's full potential.
Managed and professional services are forecast to expand at 13.52% CAGR because continuous tuning, threat-feed integration, and compliance reporting outstrip many in-house teams' bandwidth. Service providers bundle playbooks for DORA, HIPAA, and sector-specific standards, helping clients cut mean-time-to-respond and satisfy regulators. Vendors increasingly embed AI-driven copilots into management consoles, yet human specialists remain essential for contextualising anomalies and aligning policies with evolving business objectives.
Complete Report Scope:
- By Deployment Type
- On-Premise Appliance
- Cloud-Native Firewall-as-a-Service (FWaaS)
- Hybrid/Virtual Appliance
- By Component
- Hardware Appliance
- Virtual Appliance/Software
- Managed and Professional Services
- By Enterprise Size
- Small and Micro Enterprises ( <100 employees )
- Mid-sized Enterprises (100-999)
- Large Enterprises (>=1,000)
- By End-user Industry
- BFSI
- Healthcare and Life Sciences
- Manufacturing and Industrial
- Government and Defense
- Retail and E-commerce
- Telecom and Media
- Education and Research
- Energy and Utilities
- Other End-user Industries
- By Geography
- North America
- United States
- Canada
- Mexico
- South America
- Brazil
- Argentina
- Chile
- Rest of South America
- Europe
- Germany
- United Kingdom
- France
- Italy
- Spain
- Russia
- Rest of Europe
- Asia-Pacific
- China
- India
- Japan
- South Korea
- Singapore
- Malaysia
- Australia
- Rest of Asia-Pacific
- Middle East and Africa
- Middle East
- United Arab Emirates
- Saudi Arabia
- Turkey
- Rest of Middle East
- Africa
- South Africa
- Nigeria
- Egypt
- Rest of Africa
- Middle East
- North America
Geography Analysis
North America led with 35.02% of 2025 revenues, anchored by strict federal rules and high breach remediation costs that spur proactive purchasing. Enterprises there standardize on zero-trust architectures and increasingly choose consolidated platforms to cut operational fragments. Bell Canada's alliance with Palo Alto Networks shows how telcos bundle AI-driven firewalls with connectivity to serve a dispersed workforce.
Asia-Pacific is set for a 12.38% CAGR through 2031, the fastest across regions. Governments in India, Indonesia, and Japan press for local inspection of citizen data, encouraging procurement of firewalls deployable in country-specific clouds. Domestic vendors in China gain share by aligning with encryption rules and supplying inline machine-learning modules that process Mandarin threat intel. Multinational cloud providers partner with regional SOC operators to satisfy sovereignty clauses while maintaining global telemetry reach.
Europe maintains steady momentum on GDPR and the upcoming DORA framework, which requires demonstrable segmentation and incident reporting. SonicWall's new European SOC exemplifies vendor investment to provide local data handling and rapid response aligned with residency laws. Germany and the United Kingdom focus on industrial espionage defenses, whereas France and Spain invest in cloud firewalls capable of per-tenant policy isolation for multicloud expansion.
- Fortinet, Inc.
- Palo Alto Networks, Inc.
- Check Point Software Technologies Ltd.
- Cisco Systems, Inc.
- Juniper Networks, Inc.
- Sophos Ltd.
- WatchGuard Technologies, Inc.
- SonicWall LLC
- Forcepoint LLC
- Barracuda Networks, Inc.
- Hillstone Networks Co., Ltd.
- Stormshield SAS
- AhnLab, Inc.
- Clavister AB
- Untangle, Inc.
- GajShield Infotech (India) Pvt. Ltd.
- F-Secure Corp.
- OPNsense (Deciso B.V.)
- Gateworks Corp.
- Sangfor Technologies Inc.
- Huawei Technologies Co., Ltd.
- Hillstone Networks
- Array Networks, Inc.
- Stonesoft Oy (a McAfee company)
- Netgate (ESF)
Additional Benefits:
- The market estimate (ME) sheet in Excel format
- 3 months of analyst support
TABLE OF CONTENTS
1 INTRODUCTION
- 1.1 Study Assumptions and Market Definition
- 1.2 Scope of the Study
2 RESEARCH METHODOLOGY
3 EXECUTIVE SUMMARY
4 MARKET LANDSCAPE
- 4.1 Market Overview
- 4.2 Market Drivers
- 4.2.1 Escalating sophistication of multi-vector cyber-attacks
- 4.2.2 Rapid adoption of hybrid/remote work architectures
- 4.2.3 Regulatory mandates for zero-trust and segmentation
- 4.2.4 Cloud workload proliferation requiring east-west security
- 4.2.5 AI-driven polymorphic malware forcing adaptive firewalls
- 4.2.6 Sovereign traffic-inspection clauses in emerging economies
- 4.3 Market Restraints
- 4.3.1 Budget constraints among SMBs
- 4.3.2 Skills shortage to manage complex policies
- 4.3.3 IPv6 transition delaying hardware refresh cycles
- 4.3.4 Data-residency-driven shift to regional cloud SOCs
- 4.4 Industry Value Chain Analysis
- 4.5 Regulatory Landscape
- 4.6 Technological Outlook
- 4.7 Industry Attractiveness - Porter's Five Forces Analysis
- 4.7.1 Threat of New Entrants
- 4.7.2 Bargaining Power of Buyers
- 4.7.3 Bargaining Power of Suppliers
- 4.7.4 Threat of Substitutes
- 4.7.5 Intensity of Competitive Rivalry
- 4.8 Impact of Macroeconomic Factors on the Market
5 MARKET SIZE AND GROWTH FORECASTS (VALUES)
- 5.1 By Deployment Type
- 5.1.1 On-Premise Appliance
- 5.1.2 Cloud-Native Firewall-as-a-Service (FWaaS)
- 5.1.3 Hybrid/Virtual Appliance
- 5.2 By Component
- 5.2.1 Hardware Appliance
- 5.2.2 Virtual Appliance/Software
- 5.2.3 Managed and Professional Services
- 5.3 By Enterprise Size
- 5.3.1 Small and Micro Enterprises ( <100 employees )
- 5.3.2 Mid-sized Enterprises (100-999)
- 5.3.3 Large Enterprises (>=1,000)
- 5.4 By End-user Industry
- 5.4.1 BFSI
- 5.4.2 Healthcare and Life Sciences
- 5.4.3 Manufacturing and Industrial
- 5.4.4 Government and Defense
- 5.4.5 Retail and E-commerce
- 5.4.6 Telecom and Media
- 5.4.7 Education and Research
- 5.4.8 Energy and Utilities
- 5.4.9 Other End-user Industries
- 5.5 By Geography
- 5.5.1 North America
- 5.5.1.1 United States
- 5.5.1.2 Canada
- 5.5.1.3 Mexico
- 5.5.2 South America
- 5.5.2.1 Brazil
- 5.5.2.2 Argentina
- 5.5.2.3 Chile
- 5.5.2.4 Rest of South America
- 5.5.3 Europe
- 5.5.3.1 Germany
- 5.5.3.2 United Kingdom
- 5.5.3.3 France
- 5.5.3.4 Italy
- 5.5.3.5 Spain
- 5.5.3.6 Russia
- 5.5.3.7 Rest of Europe
- 5.5.4 Asia-Pacific
- 5.5.4.1 China
- 5.5.4.2 India
- 5.5.4.3 Japan
- 5.5.4.4 South Korea
- 5.5.4.5 Singapore
- 5.5.4.6 Malaysia
- 5.5.4.7 Australia
- 5.5.4.8 Rest of Asia-Pacific
- 5.5.5 Middle East and Africa
- 5.5.5.1 Middle East
- 5.5.5.1.1 United Arab Emirates
- 5.5.5.1.2 Saudi Arabia
- 5.5.5.1.3 Turkey
- 5.5.5.1.4 Rest of Middle East
- 5.5.5.2 Africa
- 5.5.5.2.1 South Africa
- 5.5.5.2.2 Nigeria
- 5.5.5.2.3 Egypt
- 5.5.5.2.4 Rest of Africa
- 5.5.5.1 Middle East
- 5.5.1 North America
6 COMPETITIVE LANDSCAPE
- 6.1 Market Concentration
- 6.2 Strategic Moves
- 6.3 Market Share Analysis
- 6.4 Company Profiles (includes Global level Overview, Market level overview, Core Segments, Financials as available, Strategic Information, Market Rank/Share for key companies, Products and Services, and Recent Developments)
- 6.4.1 Fortinet, Inc.
- 6.4.2 Palo Alto Networks, Inc.
- 6.4.3 Check Point Software Technologies Ltd.
- 6.4.4 Cisco Systems, Inc.
- 6.4.5 Juniper Networks, Inc.
- 6.4.6 Sophos Ltd.
- 6.4.7 WatchGuard Technologies, Inc.
- 6.4.8 SonicWall LLC
- 6.4.9 Forcepoint LLC
- 6.4.10 Barracuda Networks, Inc.
- 6.4.11 Hillstone Networks Co., Ltd.
- 6.4.12 Stormshield SAS
- 6.4.13 AhnLab, Inc.
- 6.4.14 Clavister AB
- 6.4.15 Untangle, Inc.
- 6.4.16 GajShield Infotech (India) Pvt. Ltd.
- 6.4.17 F-Secure Corp.
- 6.4.18 OPNsense (Deciso B.V.)
- 6.4.19 Gateworks Corp.
- 6.4.20 Sangfor Technologies Inc.
- 6.4.21 Huawei Technologies Co., Ltd.
- 6.4.22 Hillstone Networks
- 6.4.23 Array Networks, Inc.
- 6.4.24 Stonesoft Oy (a McAfee company)
- 6.4.25 Netgate (ESF)
7 MARKET OPPORTUNITIES AND FUTURE TRENDS
- 7.1 White-Space and Unmet-Need Assessment

 2026年全球企業防火牆市場報告
 企業防火牆市場分析及預測(至2035年):依類型、產品類型、服務、技術、組件、應用、部署類型、最終使用者、功能及解決方案分類
 企業防火牆市場:按組件、部署方式、最終用戶和地區分類
 企業防火牆市場 - 全球產業規模、佔有率、趨勢、機會及預測(按部署類型、解決方案、組織、最終用戶、地區和競爭格局分類,2021-2031 年)
 全球企業防火牆市場
 企業用防火牆的全球市場的評估:各提供,各部署方式,不同企業規模,各最終用途產業,各地區,機會,預測(2018年~2032年)
 全球企業防火牆市場規模、佔有率、趨勢分析報告:2024 年至 2031 年按部署模式、企業規模、組件、應用和地區分類的展望和預測
 歐洲企業防火牆:市場佔有率分析、產業趨勢與統計、成長預測(2025-2030 年)