


 |
市場調查報告書
商品編碼
2120578
財務分析:市場佔有率分析、產業趨勢與統計、成長預測(2026-2031)Financial Analytics - Market Share Analysis, Industry Trends & Statistics, Growth Forecasts (2026 - 2031) |
||||||

※ 本網頁內容可能與最新版本有所差異。詳細情況請與我們聯繫。
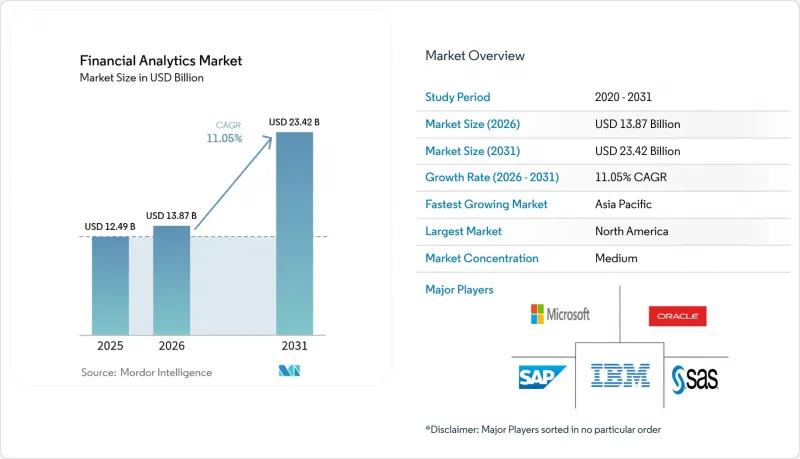
據 Mordor Intelligence 稱,2025 年金融分析市場價值為 124.9 億美元,預計到 2031 年將達到 234.2 億美元,而 2026 年為 138.7 億美元,預測期(2026-2031 年)的複合年成長率為 11.05%。
本報告按部署類型(本地部署和雲端部署)、解決方案類型(資料庫管理和規劃、分析和報告等)、應用程式(風險管理、預算和預測等)、分析類型(說明分析等)、組織規模(大型企業和中小企業)、最終用戶行業(銀行、金融服務和保險、醫療保健等)和地區進行分類。
全球金融分析市場趨勢與洞察
透過「雲端優先」方式實現核心銀行系統現代化的爆炸性成長
從單體核心系統遷移到雲端原生架構的金融機構,在實施的第一年就實現了營運效率提升 45%,成本降低高達 40%。這種遷移釋放了先前用於維護的預算,並支援部署微服務,從而能夠將資料即時串流傳輸到分析引擎。北美的一級銀行正在混合模式轉型,而印度和印尼的中型金融機構則直接遷移到公共雲端上的核心系統。供應商的藍圖目前專注於容器化的分析模組,這些模組可以根據日內交易量靈活擴展。監管機構認可雲端網格的彈性優勢,因為它們能夠實現更快的災害復原和近乎零停機時間。這種發展勢頭正在顯著擴大金融分析市場的潛在需求。
將人工智慧/機器學習整合到金融套件中可降低整體擁有成本
透過將人工智慧引擎整合到金融、貸款和投資組合管理工具中,無需再單獨建立資料科學架構。已部署人工智慧平台的金融機構透過自動化對帳、高精度現金流預測和減少誤報,平均每年節省成本 190 萬美元。最新的套件預先配置了預測模型,可從 ERP 和 CRM 系統中提取數據,即使對於缺乏足夠高技能分析人才的區域性銀行而言,也能縮短引進週期。諸如人工智慧驅動的營運成本最佳化等應用可將預測誤差降低 50%,並創造可重新分配至創收產品的流動性。因此,整體擁有成本 (TCO) 得以降低,從而加速了金融分析市場在成本敏感型細分市場的滲透。
因日益嚴重的網路安全漏洞所造成的損失責任
銀行每次網路攻擊事件的平均損失為 608 萬美元,比業界平均高出近 25%。攻擊延遲通常超過五個月,導致憑證和客戶記錄更容易被盜。 2024 年美國一家大型健康保險公司遭受的勒索軟體攻擊表明,單次攻擊事件就可能導致高達 2,200 萬美元的賠償。目前,各銀行董事會正將資金從分析升級轉向安全性增強,減緩了系統更新周期。網路保險費也呈現兩位數成長,進一步加劇了 IT 預算的壓力。因此,供應商需要在其分析平台中整合零信任控制,以消除買家的疑慮,並維持金融分析市場的成長。
細分市場分析
預計到2025年,本地部署環境仍將佔據金融分析市場60.65%的佔有率,凸顯了該產業在資料居住和延遲控制方面採取的謹慎態度。然而,公共雲端和私有雲端的採用率正以13.04%的複合年成長率穩步成長,隨著監管機構正式建立責任共擔框架,預計兩者之間的差距將進一步縮小。金融機構正在考慮分階段遷移,首先遷移預算沙箱等非核心應用,然後再遷移即時風險管理引擎。隨著供應商建構主權雲端區域以滿足本地合規要求,由雲端平台驅動的金融分析市場規模預計將顯著擴大。銀行也正在採用容器編排管理,使其能夠根據成本和延遲靈活地在本地節點和雲端節點之間切換工作負載。儘管資料遷移費用和供應商鎖定問題依然存在,但多重雲端連接工具和可攜式授權方案正在緩解這些限制,並推動更廣泛的雲端採用。
隨著工作負載的遷移,營運模式也隨之改變。站點可靠性工程師取代了硬體團隊,而付費使用制了IT支出與交易量相符。中小型金融機構可以利用計量收費模式來存取以前僅限於全球性銀行使用的機器學習庫。雲端平台整合了威脅分析功能,用於監控租戶之間的網路流量,從而增強網路彈性。可擴展計算使得無需大量固定投資即可進行投資組合風險的蒙特卡羅模擬。由此帶來的敏捷性進一步給仍然依賴大型主機的現有企業帶來了壓力,促使它們加快向基於雲端的金融分析市場解決方案分配預算。
隨著財務團隊需要整合式儀錶板來加快結算週期,分析和報告套件推動了市場成長,預計到2025年將佔據33.12%的收入佔有率。由於多實體實體需要能夠成為「單一資料來源」的帳簿以滿足複雜的國際財務報告準則(IFRS)和美國通用會計準則(GAAP)要求,財務整合套件預計將以12.46%的複合年成長率成長。這些模組可自動進行外匯轉換和公司間交易抵銷,進而減少70%的人工記帳。供應商正在整合人工智慧功能,以便在集團結算過程中檢測異常差異並提案糾正措施,從而將報告時間縮短數天。隨著監管機構收緊有關氣候變遷和稅務透明度的資訊揭露要求,與合併會計相關的財務分析市場規模預計將顯著擴大。
資料庫管理和規劃工具構成了運作引擎的基礎,而風險和合規模組則整合了情境建模和監管分類系統。 ESG評分分析和基於量子運算的衍生性商品平台佔據了一個新興的細分市場,即「其他解決方案」。隨著企業尋求端到端的財務轉型,供應商正在將帳戶核對和資訊揭露管理等相關功能整合到大規模的平台中。這種融合趨勢正在推動併購,因為供應商競相提供全端式解決方案,加劇了金融分析市場的競爭。
區域分析
到2025年,北美將以38.45%的收入佔有率領先全球,這得益於資金雄厚的銀行早期對人工智慧核心、雲端彈性以及整合合規工作平台的投資。美國監管機構為模型風險管理提供了明確的指導,使金融機構能夠在明確的框架內進行試驗。加拿大銀行是開放銀行API的先驅,這些API可將豐富的交易資料流傳輸到第三方分析層。紐約和多倫多的資本市場公司正在部署低延遲網格,以微秒速度完成衍生性商品定價。超大規模雲端區域的存在減少了資料主權方面的摩擦,並維持了該地區在全部區域金融分析市場的主導地位。
在亞太地區,在積極的數位轉型、扶持政策以及中產階級對金融服務日益成長的需求的推動下,預計到2031年,該地區的年複合成長率將達到12.32%。中國兆豐銀行正在雲端預算方面投入數十億美元,而印度公共部門銀行則參與帳戶聚合網路,利用新的資料集進行信用評分。日本金融巨頭正在探索量子運算聯盟,以降低利率風險。東南亞的金融科技公司正在幫助那些銀行帳戶的人獲得貸款,並將即時分析工作負載轉移到邊緣。預計到2028年,該地區與人工智慧相關的支出將達到1,100億美元,進一步加速長期成長動能。
歐洲憑藉其先進的ESG報告標準和成熟的批發市場,保持著舉足輕重的地位。法國銀行正在將碳計量納入其信貸模型,而德國保險公司則正在實施反映氣候風險的精算引擎。歐盟資料法提高了隱私合規的重要性,促使隱私保護分析技術(例如安全飛地)的普及。同時,歐洲央行針對後量子密碼技術所進行的旨在保護支付基礎設施的調查,也使人們更加關注為量子技術做好準備。南美洲、中東和非洲目前市場佔有率較小,但隨著其在行動支付、數位身分和開放銀行領域的努力日益成熟,這些地區的成長率正達到兩位數。
其他好處:
- Excel格式的市場預測(ME)表
- 3個月的分析師支持
目錄
第1章:引言
- 研究假設和市場定義
- 調查範圍
第2章:調查方法
第3章執行摘要
第4章 市場狀況
- 市場概覽
- 市場促進因素
- 在「雲端優先」的旗幟下,核心銀行系統的現代化正在迅速擴展。
- 將人工智慧/機器學習整合到金融套件中可降低整體擁有成本。
- 監管機構為實現即時風險和資本報告所做的努力
- 中小企業數據驅動型財務規劃與分析的激增
- ESG評分掛鉤債券發行分析
- 用於 VAR 的量子蒙特卡羅引擎
- 市場限制因素
- 網路安全漏洞造成的損失責任增加
- 缺乏具備高階分析技能的人員
- 不斷上漲的雲端出口費用和供應商鎖定
- 關於演算法偏差的合規性調查
- 價值鏈分析
- 監理情勢
- 技術展望
- 波特五力分析
- 評估宏觀經濟趨勢對市場的影響
第5章 市場規模與成長預測
- 部署模式
- 現場
- 雲
- 按解決方案類型
- 資料庫管理與規劃
- 分析與報告撰寫
- 合併財務報表
- 風險與合規
- 其他解決方案
- 透過使用
- 風險管理
- 預算編制與預測
- 收益管理
- 詐欺偵測
- 現金流量和財務分析
- 合規與報告
- 資產和投資組合分析
- 按分析類型
- 說明分析
- 診斷分析
- 預測分析
- 指示性分析
- 按組織規模
- 大公司
- 小型企業
- 按最終用戶行業分類
- BFSI
- 衛生保健
- 製造業
- 政府
- 資訊科技/通訊
- 零售與電子商務
- 其他
- 按地區
- 北美洲
- 美國
- 加拿大
- 墨西哥
- 歐洲
- 德國
- 英國
- 法國
- 義大利
- 西班牙
- 俄羅斯
- 其他歐洲國家
- 亞太地區
- 中國
- 日本
- 印度
- 韓國
- ASEAN
- 澳洲和紐西蘭
- 其他亞太國家
- 南美洲
- 巴西
- 阿根廷
- 其他南美國家
- 中東和非洲
- 中東
- 沙烏地阿拉伯
- UAE
- 土耳其
- 其他中東國家
- 非洲
- 南非
- 奈及利亞
- 其他非洲國家
- 中東
- 北美洲
第6章 競爭情勢
- 市場集中度
- 策略趨勢
- 市佔率分析
- 公司簡介
- FICO
- Hitachi Vantara
- SAS Institute
- IBM Corporation
- Microsoft Corporation
- Oracle Corporation
- SAP SE
- Teradata Corporation
- Salesforce(Tableau)
- Qlik Tech
- TIBCO Software
- Alteryx
- ThoughtSpot
- Domo
- MicroStrategy
- Sisense
- Anaplan
- Workday Adaptive Planning
- Moody's Analytics
- SandP Global Market Intelligence
- BlackLine
- Infor
- Wolters Kluwer
- Datarails
第7章 市場機會與未來展望
According to Mordor Intelligence, the financial analytics market size was valued at USD 12.49 billion in 2025 and estimated to grow from USD 13.87 billion in 2026 to reach USD 23.42 billion by 2031, at a CAGR of 11.05% during the forecast period (2026-2031).
This report is Segmented by Deployment Mode (On-Premise and Cloud), Solution Type (Database Management and Planning, Analysis and Reporting, and More), Application (Risk Management, Budgeting and Forecasting, and More), Analytics Type (Descriptive Analytics, and More), Organization Size (Large Enterprises and Small and Medium Enterprises), End-User Industry (BFSI, Healthcare, and More), and Geography.
Global Financial Analytics Market Trends and Insights
Explosion in Cloud-First Core-Banking Modernizations
Financial institutions that migrate from monolithic cores to cloud-native architectures record 45% jumps in operational efficiency and up to 40% cost savings within the first year. The shift frees budgets historically consumed by maintenance and enables microservices that stream data into analytics engines in real time. North American tier-1 banks are executing hybrid moves, while mid-tier lenders in India and Indonesia leap directly to public cloud cores. Vendor roadmaps now center on containerized analytics modules that scale elastically with intraday transaction volumes. Regulators acknowledge the resilience benefit because cloud grids allow faster disaster recovery and near-zero downtime. This momentum greatly enlarges addressable demand in the financial analytics market.
AI/ML Embedded in Finance Suites Lowers TCO
Embedding AI engines inside treasury, lending, and portfolio tools removes the need for separate data science stacks. Institutions deploying AI-infused platforms save an average of USD 1.9 million annually through automated reconciliations, hyper-accurate cash forecasts, and fewer false-positive alerts. Modern suites come pre-configured with predictive models that pull data from ERP and CRM pipes, shrinking implementation cycles for regional banks lacking deep analytics talent. Applications such as AI-guided working capital optimization reduce forecast errors by 50%, unlocking liquidity that can be redeployed into revenue-generating products. The resulting lower total cost of ownership accelerates penetration of the financial analytics market into cost-sensitive segments.
Escalating Cyber-Breach Liabilities
Banks average USD 6.08 million in loss per breach, nearly 25% above cross-sector norms. Attack dwell time often exceeds five months, amplifying theft of credentials and customer records. The 2024 ransomware strike on a leading U.S. health insurer showed how a single breach can trigger USD 22 million in payouts. Boards now divert capital from analytics upgrades to security hardening, slowing refresh cycles. Cyber insurance premiums also rise by double digits, squeezing IT budgets further. Vendors must therefore embed zero-trust controls inside analytics platforms to assuage buyer concerns and sustain growth in the financial analytics market.
Other drivers and restraints analyzed in the detailed report include:
- Regulatory Push for Real-Time Risk and Capital Reporting
- Surge in Data-Driven Financial Planning and Analysis Across SMBs
- Shortage of Advanced Analytics Talent
For complete list of drivers and restraints, kindly check the Table Of Contents.
Segment Analysis
On-premise setups retained 60.65% of the financial analytics market share in 2025, underscoring the sector's cautious stance on data residency and latency control. However, public and private cloud deployments are advancing at 13.04% CAGR and will narrow the gap as regulators formalize shared-responsibility frameworks. Institutions weigh staged migrations beginning with non-core applications, such as budgeting sandboxes, before moving real-time risk engines. The financial analytics market size attributed to cloud platforms is forecast to climb markedly as vendors build sovereign cloud regions to satisfy local compliance. Banks also adopt container orchestration that allows workloads to swing between on-premise and cloud nodes based on cost or latency. Although data-egress fees and vendor lock-in fears linger, multicloud connectivity tools and portable licensing help alleviate these restraints and propel broader cloud adoption.
Once workloads shift, operating models change. Site-reliability engineers replace hardware teams, and consumption pricing aligns IT spend with transaction volumes. Smaller lenders exploit the pay-as-you-go model to access machine-learning libraries previously limited to global banks. Cloud platforms integrate threat analytics that monitor network traffic across tenants, strengthening cyber resilience. Scalable compute further enables Monte Carlo simulations for portfolio risk without large fixed investments. The resulting agility places added pressure on incumbents still anchored to mainframes, encouraging an accelerated reallocation of budgets toward cloud-based financial analytics market solutions.
Analysis and reporting suites led the 2025 landscape with 33.12% revenue share as finance teams demanded unified dashboards for faster close cycles. Financial consolidation suites exhibit 12.46% CAGR because multi-entity corporations require single-version-of-truth ledgers to meet complex IFRS and GAAP obligations. These modules automate currency translation and intercompany eliminations, reducing manual journal entries by 70%. Vendors embed AI that flags anomalous variances during group close and recommends corrective actions, shaving days off reporting timelines. The financial analytics market size associated with consolidation is projected to expand significantly as regulators intensify disclosure demands for climate and tax transparency.
Database management and planning tools form the substrate on which analytical engines run, while risk and compliance modules integrate scenario modeling with regulatory taxonomy. ESG-score analytics and quantum-ready derivatives platforms occupy the emerging "other solutions" niche. As corporations seek end-to-end financial transformation, vendors bundle adjacent capabilities such as account reconciliation and disclosure management into larger platforms. The convergence trend fuels mergers and acquisitions as providers race to offer full-stack coverage, amplifying competition within the financial analytics market.
Complete Report Scope:
- By Deployment Mode
- On-premise
- Cloud
- By Solution Type
- Database Management and Planning
- Analysis and Reporting
- Financial Consolidation
- Risk and Compliance
- Other Solutions
- By Application
- Risk Management
- Budgeting and Forecasting
- Revenue Management
- Fraud Detection
- Cash-flow and Treasury Analytics
- Compliance and Reporting
- Wealth and Portfolio Analytics
- By Analytics Type
- Descriptive Analytics
- Diagnostic Analytics
- Predictive Analytics
- Prescriptive Analytics
- By Organisation Size
- Large Enterprises
- Small and Medium Enterprises
- By End-user Industry
- BFSI
- Healthcare
- Manufacturing
- Government
- IT and Telecom
- Retail and eCommerce
- Others
- By Geography
- North America
- United States
- Canada
- Mexico
- Europe
- Germany
- United Kingdom
- France
- Italy
- Spain
- Russia
- Rest of Europe
- Asia-Pacific
- China
- Japan
- India
- South Korea
- ASEAN
- Australia and New Zealand
- Rest of Asia-Pacific
- South America
- Brazil
- Argentina
- Rest of South America
- Middle East and Africa
- Middle East
- Saudi Arabia
- UAE
- Turkey
- Rest of Middle East
- Africa
- South Africa
- Nigeria
- Rest of Africa
- Middle East
- North America
Geography Analysis
North America led with 38.45% revenue share in 2025 as well-capitalized banks invested early in AI cores, cloud resilience, and integrated compliance workbenches. U.S. regulators provide clear guidance on model risk management, allowing institutions to experiment within well-defined guardrails. Canadian banks pioneer open-banking APIs that stream enriched transaction data into third-party analytics layers. Capital markets firms in New York and Toronto deploy low-latency grids that price derivatives in microseconds. The presence of hyperscale cloud regions reduces data-sovereignty friction, sustaining dominance of the financial analytics market across the region.
Asia-Pacific is expected to post a 12.32% CAGR through 2031 on the back of aggressive digitization, supportive policy, and expanding middle-class demand for financial services. China's megabanks commit multi-billion-dollar cloud budgets, while India's public-sector banks join account-aggregator networks that unleash new data sets for credit scoring. Japan's financial giants explore quantum computing consortiums to mitigate interest-rate volatility. Southeast Asian fintechs unlock credit access for the unbanked, pushing real-time analytics workloads to the edge. Regional AI spend is forecast to hit USD 110 billion by 2028, reinforcing long-term momentum.
Europe maintains a sizeable footprint with advanced ESG reporting norms and sophisticated wholesale markets. French banks integrate carbon accounting into credit models, while German insurers deploy actuarial engines that factor climate risk. The EU Data Act elevates privacy compliance, prompting wider adoption of privacy-preserving analytics such as secure enclaves. Meanwhile, quantum readiness gains traction after the European Central Bank explored post-quantum cryptography to safeguard payment rails. South America, and Middle East, and Africa contribute smaller shares today but register double-digit growth as mobile money, digital ID, and open banking initiatives mature.
- FICO
- Hitachi Vantara
- SAS Institute
- IBM Corporation
- Microsoft Corporation
- Oracle Corporation
- SAP SE
- Teradata Corporation
- Salesforce (Tableau)
- Qlik Tech
- TIBCO Software
- Alteryx
- ThoughtSpot
- Domo
- MicroStrategy
- Sisense
- Anaplan
- Workday Adaptive Planning
- Moody's Analytics
- SandP Global Market Intelligence
- BlackLine
- Infor
- Wolters Kluwer
- Datarails
Additional Benefits:
- The market estimate (ME) sheet in Excel format
- 3 months of analyst support
TABLE OF CONTENTS
1 INTRODUCTION
- 1.1 Study Assumptions and Market Definition
- 1.2 Scope of the Study
2 RESEARCH METHODOLOGY
3 EXECUTIVE SUMMARY
4 MARKET LANDSCAPE
- 4.1 Market Overview
- 4.2 Market Drivers
- 4.2.1 Explosion in cloud-first core-banking modernisations
- 4.2.2 AI/ML embedded in finance suites lowers TCO
- 4.2.3 Regulatory push for real-time risk and capital reporting
- 4.2.4 Surge in data-driven financial planning and analysis across SMBs
- 4.2.5 ESG-score-linked debt issuance analytics
- 4.2.6 Quantum-ready Monte-Carlo engines for VAR
- 4.3 Market Restraints
- 4.3.1 Escalating cyber-breach liabilities
- 4.3.2 Shortage of advanced analytics talent
- 4.3.3 Rising cloud egress fees and vendor lock-in
- 4.3.4 Algorithmic bias compliance investigations
- 4.4 Value Chain Analysis
- 4.5 Regulatory Landscape
- 4.6 Technological Outlook
- 4.7 Porter's Five Forces Analysis
- 4.7.1 Threat of New Entrants
- 4.7.2 Bargaining Power of Buyers
- 4.7.3 Bargaining Power of Suppliers
- 4.7.4 Threat of Substitutes
- 4.7.5 Intensity of Competitive Rivalry
- 4.8 Assessment of the Impact of Macroeconomic Trends on the Market
5 MARKET SIZE AND GROWTH FORECASTS (VALUE)
- 5.1 By Deployment Mode
- 5.1.1 On-premise
- 5.1.2 Cloud
- 5.2 By Solution Type
- 5.2.1 Database Management and Planning
- 5.2.2 Analysis and Reporting
- 5.2.3 Financial Consolidation
- 5.2.4 Risk and Compliance
- 5.2.5 Other Solutions
- 5.3 By Application
- 5.3.1 Risk Management
- 5.3.2 Budgeting and Forecasting
- 5.3.3 Revenue Management
- 5.3.4 Fraud Detection
- 5.3.5 Cash-flow and Treasury Analytics
- 5.3.6 Compliance and Reporting
- 5.3.7 Wealth and Portfolio Analytics
- 5.4 By Analytics Type
- 5.4.1 Descriptive Analytics
- 5.4.2 Diagnostic Analytics
- 5.4.3 Predictive Analytics
- 5.4.4 Prescriptive Analytics
- 5.5 By Organisation Size
- 5.5.1 Large Enterprises
- 5.5.2 Small and Medium Enterprises
- 5.6 By End-user Industry
- 5.6.1 BFSI
- 5.6.2 Healthcare
- 5.6.3 Manufacturing
- 5.6.4 Government
- 5.6.5 IT and Telecom
- 5.6.6 Retail and eCommerce
- 5.6.7 Others
- 5.7 By Geography
- 5.7.1 North America
- 5.7.1.1 United States
- 5.7.1.2 Canada
- 5.7.1.3 Mexico
- 5.7.2 Europe
- 5.7.2.1 Germany
- 5.7.2.2 United Kingdom
- 5.7.2.3 France
- 5.7.2.4 Italy
- 5.7.2.5 Spain
- 5.7.2.6 Russia
- 5.7.2.7 Rest of Europe
- 5.7.3 Asia-Pacific
- 5.7.3.1 China
- 5.7.3.2 Japan
- 5.7.3.3 India
- 5.7.3.4 South Korea
- 5.7.3.5 ASEAN
- 5.7.3.6 Australia and New Zealand
- 5.7.3.7 Rest of Asia-Pacific
- 5.7.4 South America
- 5.7.4.1 Brazil
- 5.7.4.2 Argentina
- 5.7.4.3 Rest of South America
- 5.7.5 Middle East and Africa
- 5.7.5.1 Middle East
- 5.7.5.1.1 Saudi Arabia
- 5.7.5.1.2 UAE
- 5.7.5.1.3 Turkey
- 5.7.5.1.4 Rest of Middle East
- 5.7.5.2 Africa
- 5.7.5.2.1 South Africa
- 5.7.5.2.2 Nigeria
- 5.7.5.2.3 Rest of Africa
- 5.7.5.1 Middle East
- 5.7.1 North America
6 COMPETITIVE LANDSCAPE
- 6.1 Market Concentration
- 6.2 Strategic Moves
- 6.3 Market Share Analysis
- 6.4 Company Profiles (includes Global level Overview, Market level overview, Core Segments, Financials as available, Strategic Information, Market Rank/Share for key companies, Products and Services, and Recent Developments)
- 6.4.1 FICO
- 6.4.2 Hitachi Vantara
- 6.4.3 SAS Institute
- 6.4.4 IBM Corporation
- 6.4.5 Microsoft Corporation
- 6.4.6 Oracle Corporation
- 6.4.7 SAP SE
- 6.4.8 Teradata Corporation
- 6.4.9 Salesforce (Tableau)
- 6.4.10 Qlik Tech
- 6.4.11 TIBCO Software
- 6.4.12 Alteryx
- 6.4.13 ThoughtSpot
- 6.4.14 Domo
- 6.4.15 MicroStrategy
- 6.4.16 Sisense
- 6.4.17 Anaplan
- 6.4.18 Workday Adaptive Planning
- 6.4.19 Moody's Analytics
- 6.4.20 SandP Global Market Intelligence
- 6.4.21 BlackLine
- 6.4.22 Infor
- 6.4.23 Wolters Kluwer
- 6.4.24 Datarails
7 MARKET OPPORTUNITIES AND FUTURE OUTLOOK
- 7.1 White-space and Unmet-need Assessment

 金融資料分析與預測:金融平台市場預測至2034年-全球分析(依組件、分析類型、部署模式、技術、資料來源、最終使用者和地區分類)
 2026年全球財務管理市場報告
 金融分析市場規模、佔有率、趨勢和預測:按類型、組件、應用、公司規模、行業和地區分類,2026-2034 年金融分析市場預測至2034年-按組件、部署類型、組織規模、應用、最終用戶和地區分類的全球分析
 金融分析市場:按組件、服務類型、應用、最終用戶產業和部署模式分類-2026-2032年全球市場預測2026年全球金融分析市場報告
 金融分析市場規模、佔有率和成長分析(按組件、部署模式、企業類型、應用、最終用戶產業和地區分類)-2026-2033年產業預測
 金融分析市場分析及預測(至2035年):按類型、產品、技術、組件、應用、部署類型、最終用戶、功能及解決方案分類
 全球金融分析市場規模、佔有率、趨勢和成長分析報告(2026-2034)金融分析市場規模、佔有率、成長及全球產業分析:按類型、應用和地區分類的洞察,2026-2034 年預測