


 |
市場調查報告書
商品編碼
2120321
礦業化學品:市場佔有率分析、行業趨勢和統計數據、成長預測(2026-2031 年)Mining Chemicals - Market Share Analysis, Industry Trends & Statistics, Growth Forecasts (2026 - 2031) |
||||||

※ 本網頁內容可能與最新版本有所差異。詳細情況請與我們聯繫。
據 Mordor Intelligence 稱,礦業化學品市場預計將從 2025 年的 70.2 億美元成長到 2026 年的 73.2 億美元,到 2031 年達到 90 億美元,預計 2026 年至 2031 年的複合年成長率為 4.22%。
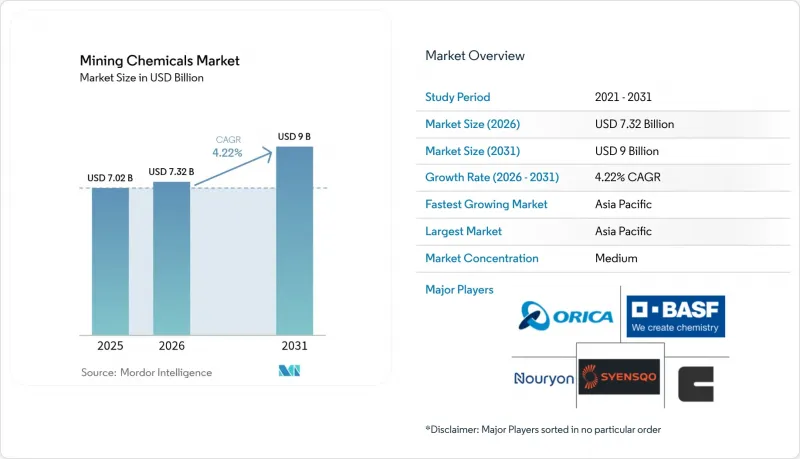
本報告按功能(浮選化學品、萃取化學品、磨礦助劑)、應用(礦物處理和污水處理)以及地區(亞太地區、北美地區、歐洲地區、南美地區、中東和非洲地區)進行細分。市場預測以美元計價。
全球礦業化學品市場趨勢及洞察
亞太地區和北美地區的採礦資本支出(CAPEX)增加。
印尼新建設線以及內華達州和亞伯達省的鋰直接提取(DLE)試點項目,正在推動硫酸、磷酸三丁酯和冠醚抽取劑的年需求量成長。智利阿塔卡馬沙漠和加拿大「火環」地區銅礦的擴張增加了對礦石引誘劑和發泡的需求,但礦石分選設施的大規模維修限制了試劑的使用。
電動車和可再生能源供應鏈導致礦產需求激增
透過浮選和溶劑萃取,電池用金屬被提煉成中間產品。在中國,磷酸鋰鐵鋰電池已經超越了鈷含量較高的電池。同時,在西澳大利亞,脂肪酸基礦物萃取劑仍然用於鋰輝石的浮選。由於預計2030年銅將供不應求,對黃原酸鹽和二硫代磷酸酯礦物萃取劑的需求仍穩定。
加強對有毒試劑的全球監管
2024年,歐洲化學品管理局(ECHA)將黃原酸鹽列入其REACH法規候選清單,並啟動了撤銷其授權的程序,該授權將於2026年到期。同時,美國環保署(EPA)正在審查黃原酸鹽酸鉀,而中國環保部(MEE)目前要求47種浮選劑提交新的毒性資料文件。這些監管合規成本正在加重研發預算的壓力,並可能阻礙新型浮選劑的引入,尤其是在那些對監管格外謹慎的地區。
細分市場分析
預計到2025年,浮選化學品將佔礦業化學品市場銷售額的55.33%。雖然捕收劑、發泡劑和抑制劑仍主導銷售主導地位,Hydroxamates和鎳紅土礦製程中。萃取化學品(包括稀釋劑和有機磷抽取劑)的複合年成長率為4.33%,受益於直接鋰萃取(DLE)技術的蓬勃發展,凸顯了礦業化學品市場按功能類別分類的規模分佈正在發生微妙的變化。阿肯色州和玻利維亞的DLE計畫已證明能夠顯著節約用水並縮短生產週期,從而推動了對冠醚和磷酸酯抽取劑的需求。同時,中國和美國的稀土元素設施正在大量使用C6-C12稀釋劑,以穩定混合器和沈澱池內的溫度分佈。
助磨劑在礦業化學品領域佔比最小,但其測試結果卻令人鼓舞。這些助磨劑顯著提高了智利銅提煉和蒙古金提煉的加工能力,並降低了能耗。然而,要實現更廣泛的應用,尤其是在處理不同硬度的礦石時,證明投資回報率至關重要。順應這一趨勢,供應商現在開始提供與試劑配套的數位計量閥。這種策略不僅有助於減少過量用藥,也符合產業向性能驅動型採購的轉變。
區域分析
亞太地區預計到2025年將佔全球銷售額的54.13%,引領礦業化學品市場,並將在2031年之前維持5.12%的複合年成長率。在印度尼西亞,一條新的高壓酸浸(HPAL)生產線已投入使用,每條生產線每年消耗大量的硫酸和抽取劑。在中國,江西省和內蒙古正在擴大銅礦石加工能力,利用國產黃原酸鹽,因為國產黃藥比進口黃藥便宜。在澳大利亞,氫氧化鋰的產量正在增加,在鋰輝石礦浮選過程中,由於礦石粒徑越來越細,對脂肪酸捕收劑的依賴性也越來越高。同時,日本和韓國已成為主要的混合中心,進口松油基發泡,並將其轉售給印尼的鎳冶煉廠。
2025年,北美市場佔據了相當大的佔有率。內華達州克萊頓谷和亞伯達省雷杜克組正在進行試點項目,測試需要特殊離子交換樹脂和磷酸先導計畫稀釋劑的直接液相萃取(DLE)柱。亞利桑那州和不列顛哥倫比亞省銅產量的增加,以及薩斯喀徹爾省鉀生產瓶頸的解決,正在推動對集電器的持續需求。儘管墨西哥的銀礦和金礦仍然是穩定的需求來源,但由於當地反對導致氰化物開採計畫延期,短期試劑訂單減少。
礦業化學品市場的剩餘佔有率由歐洲、南美洲以及中東和非洲地區佔據。 2025年,智利和秘魯共同採購了黃原酸鹽和二硫代磷酸酯。然而,由於水資源短缺問題日益嚴重,目前正迅速轉向使用陰離子聚丙烯醯胺處理的高產能精礦。南非布希維爾德地區的礦業公司目前正在使用複雜的抑制劑混合物,以充分應對梅倫斯基礦和UG2礦的礦物成分。此外,斯堪地那維亞半島的礦業公司正在測試生物收集器,這些收集器預計將成為全球標準,尤其是在2026年起REACH法規進一步收緊的情況下。
其他好處:
- Excel格式的市場預測(ME)表
- 3個月的分析師支持
目錄
第1章:引言
- 研究假設和市場定義
- 調查範圍
第2章:調查方法
第3章執行摘要
第4章 市場狀況
- 市場概覽
- 市場促進因素
- 亞太地區和北美礦業資本投資增加
- 電動車和可再生能源供應鏈中礦物需求激增
- 大型礦山更嚴格的水循環利用標準
- 大宗商品價格的回升支撐了探勘預算。
- 為符合ESG法規,向生物基收集器過渡
- 市場限制因素
- 加強對有毒試劑的全球監管
- 原油衍生原料成本波動極大
- 一種無需濕試劑的新型乾加工技術。
- 價值鏈分析
- 波特五力模型
第5章 市場規模與成長預測
- 按功能
- 浮選化學品
- 收款代理人
- 沉澱劑
- 凝聚劑
- 發泡劑
- 分散劑
- 萃取化學品
- 沖淡
- 抽取劑
- 研磨助劑
- 浮選化學品
- 透過使用
- 礦物加工
- 污水處理
- 按地區
- 亞太地區
- 中國
- 印度
- 日本
- 韓國
- 印尼
- 馬來西亞
- 澳洲和紐西蘭
- 其他亞太國家
- 北美洲
- 美國
- 加拿大
- 墨西哥
- 歐洲
- 德國
- 英國
- 法國
- 義大利
- 俄羅斯
- 其他歐洲國家
- 南美洲
- 巴西
- 阿根廷
- 其他南美國家
- 中東和非洲
- 沙烏地阿拉伯
- 南非
- 其他中東和非洲國家
- 亞太地區
第6章 競爭情勢
- 市場集中度
- 策略趨勢
- 市佔率和排名分析
- 公司簡介
- 3M
- AECI
- Arkema
- BASF
- Betachem(Pty)Ltd
- Celanese Corporation
- Chevron Phillips Chemical Company LLC
- Clariant
- CTC(Tennant Consolidated Group)
- Ecolab
- FMC Corporation
- Indorama Ventures Public Limited
- Kemira
- NASACO
- Nouryon
- Orica Limited
- Qingdao Ruchang Mining Industry Co. Ltd
- Sasol
- SNF Group
- Syensqo
第7章 市場機會與未來展望
According to Mordor Intelligence, the mining chemicals market size is expected to increase from USD 7.02 billion in 2025 to USD 7.32 billion in 2026 and reach USD 9 billion by 2031, growing at a CAGR of 4.22% over 2026-2031.
This report is Segmented by Function (Flotation Chemicals, Extraction Chemicals, and Grinding Aids), Application (Mineral Processing and Wastewater Treatment), and Geography (Asia-Pacific, North America, Europe, South America, and Middle-East and Africa). The Market Forecasts are Provided in Terms of Value (USD).
Global Mining Chemicals Market Trends and Insights
Increasing Mining CAPEX in Asia-Pacific and North America
New nickel HPAL lines in Indonesia and lithium DLE pilots in Nevada and Alberta are lifting annual demand for sulfuric acid, tributyl phosphate, and crown-ether extractants. Copper expansions in Chile's Atacama Desert and Canada's Ring of Fire are adding collectors and frothers, although widespread ore-sorting retrofits are moderating reagent intensity.
Surging Mineral Demand from Electric Vehicle and Renewable-Energy Supply Chains
Through flotation or solvent extraction, battery metals are purified into intermediates. In China, lithium-iron-phosphate cells have surpassed cobalt-rich chemistries. Meanwhile, in Western Australia, spodumene flotation continues to use fatty-acid collectors. With projected copper deficits by 2030, the demand for xanthate and dithiophosphate collectors remains stable.
Tightening Global Regulations on Toxic Reagents
In 2024, ECHA added sodium ethyl xanthate to the REACH Candidate List, setting off an authorization sunset for 2026. Meanwhile, the U.S. EPA is scrutinizing potassium amyl xanthate, and China's MEE is now requiring fresh toxicity dossiers for 47 flotation reagents. These compliance costs are siphoning off research and development budgets, potentially hindering the adoption of new collectors, especially in jurisdictions that are cautious.
Other drivers and restraints analyzed in the detailed report include:
- Stricter Water-Recycling Norms in Large Mines
- Commodity-Price Rebound Sustaining Exploration Budgets
- Volatile Crude-Derived Raw-Material Costs
For complete list of drivers and restraints, kindly check the Table Of Contents.
Segment Analysis
In 2025, flotation chemicals are projected to account for 55.33% of the mining chemicals market revenue. While collectors, frothers, and depressants lead in value, there's a notable rise in the adoption of hydroxamate and bio-based collectors, especially in oxide-copper and nickel laterite circuits. Extraction chemicals, representing diluents and organophosphorus extractants, are riding the direct-lithium-extraction wave at a 4.33% CAGR, underscoring a subtle shift in the mining chemicals market size allocation across functional lines. DLE initiatives in Arkansas and Bolivia, showcasing substantial water savings and expedited cycle times, are driving up the demand for crown-ether and phosphate-based extractants. Concurrently, rare-earth facilities in China and the U.S. are now utilizing significant volumes of C6-C12 diluents to maintain stable mixer-settler temperature profiles.
Grinding aids, though the smallest segment in the mining chemicals arena, are witnessing promising trials. In Chilean copper and Mongolian gold concentrators, these aids have led to notable increases in throughput and reductions in energy consumption. However, broader adoption is contingent on demonstrating a return on investment, especially with varying ore hardness. In a related trend, suppliers are now offering digital dosage valves alongside reagents. This strategy not only curbs overdosing but also resonates with the industry's pivot towards performance-centric purchasing.
Complete Report Scope:
- By Function
- Flotation Chemicals
- Collectors
- Depressants
- Flocculants
- Frothers
- Dispersants
- Extraction Chemicals
- Diluents
- Extractants
- Grinding Aids
- Flotation Chemicals
- By Application
- Mineral Processing
- Wastewater Treatment
- By Geography
- Asia-Pacific
- China
- India
- Japan
- South Korea
- Indonesia
- Malaysia
- Australia and New Zealand
- Rest of Asia-Pacific
- North America
- United States
- Canada
- Mexico
- Europe
- Germany
- United Kingdom
- France
- Italy
- Russia
- Rest of Europe
- South America
- Brazil
- Argentina
- Rest of South America
- Middle-East and Africa
- Saudi Arabia
- South Africa
- Rest of Middle-East and Africa
- Asia-Pacific
Geography Analysis
Asia-Pacific dominated the mining chemicals market with 54.13% of 2025 revenue and is advancing at a 5.12% CAGR to 2031. Indonesia has rolled out new HPAL lines, each with significant annual consumption of sulfuric acid and extractants. In Jiangxi and Inner Mongolia, China has boosted its copper-ore processing capacity, utilizing domestically produced xanthates that are priced lower than their imported counterparts. Australia has ramped up its lithium hydroxide output, with spodumene flotation increasingly relying on fatty-acid collectors due to finer ore feeds. Meanwhile, Japan and South Korea have positioned themselves as key blending hubs, importing pine-oil frothers and redistributing them to nickel smelters in Indonesia.
North America accounted for a notable portion of the market's 2025 revenue. In Nevada's Clayton Valley and Alberta's Leduc Formation, pilot projects are testing DLE columns, which require specialty ion-exchange resins and tributyl phosphate diluents. Expansions in copper production in Arizona and British Columbia, along with potash debottlenecking in Saskatchewan, are driving sustained demand for collectors. While Mexico's silver and gold belts continue to be consistent consumers, community pushback has postponed cyanide-based projects, leading to a dip in short-term reagent orders.
Europe, South America, and the combined regions of the Middle East and Africa account for the remaining share of the mining chemicals market. In 2025, Chile and Peru made joint purchases of xanthates and dithiophosphates. However, due to escalating water scarcity issues, there's a swift shift towards high-throughput thickeners treated with anionic polyacrylamide. Operators in South Africa's Bushveld region are now opting for intricate depressant blends to adeptly handle both Merensky and UG2 mineralogy. Furthermore, Scandinavian mines are testing bio-collectors, which hold the potential to set global standards, especially with impending REACH restrictions tightening post-2026.
- 3M
- AECI
- Arkema
- BASF
- Betachem (Pty) Ltd
- Celanese Corporation
- Chevron Phillips Chemical Company LLC
- Clariant
- CTC (Tennant Consolidated Group)
- Ecolab
- FMC Corporation
- Indorama Ventures Public Limited
- Kemira
- NASACO
- Nouryon
- Orica Limited
- Qingdao Ruchang Mining Industry Co. Ltd
- Sasol
- SNF Group
- Syensqo
Additional Benefits:
- The market estimate (ME) sheet in Excel format
- 3 months of analyst support
TABLE OF CONTENTS
1 Introduction
- 1.1 Study Assumptions and Market Definition
- 1.2 Scope of the Study
2 Research Methodology
3 Executive Summary
4 Market Landscape
- 4.1 Market Overview
- 4.2 Market Drivers
- 4.2.1 Increasing Mining CAPEX in Asia-Pacific and North America
- 4.2.2 Surging Mineral Demand from Electric Vehicle And Renewable-Energy Supply Chains
- 4.2.3 Stricter Water-Recycling Norms in Large Mines
- 4.2.4 Commodity-Price Rebound Sustaining Exploration Budgets
- 4.2.5 Shift to Bio-Based Collectors for ESG Compliance
- 4.3 Market Restraints
- 4.3.1 Tightening Global Regulations on Toxic Reagents
- 4.3.2 Volatile Crude-Derived Raw-Material Costs
- 4.3.3 Emerging Dry-Processing Technologies that Bypass Wet Reagents
- 4.4 Value Chain Analysis
- 4.5 Porter's Five Forces
- 4.5.1 Bargaining Power of Suppliers
- 4.5.2 Bargaining Power of Buyers
- 4.5.3 Threat of New Entrants
- 4.5.4 Threat of Substitutes
- 4.5.5 Degree of Competition
5 Market Size and Growth Forecasts (Value)
- 5.1 By Function
- 5.1.1 Flotation Chemicals
- 5.1.1.1 Collectors
- 5.1.1.2 Depressants
- 5.1.1.3 Flocculants
- 5.1.1.4 Frothers
- 5.1.1.5 Dispersants
- 5.1.2 Extraction Chemicals
- 5.1.2.1 Diluents
- 5.1.2.2 Extractants
- 5.1.3 Grinding Aids
- 5.1.1 Flotation Chemicals
- 5.2 By Application
- 5.2.1 Mineral Processing
- 5.2.2 Wastewater Treatment
- 5.3 By Geography
- 5.3.1 Asia-Pacific
- 5.3.1.1 China
- 5.3.1.2 India
- 5.3.1.3 Japan
- 5.3.1.4 South Korea
- 5.3.1.5 Indonesia
- 5.3.1.6 Malaysia
- 5.3.1.7 Australia and New Zealand
- 5.3.1.8 Rest of Asia-Pacific
- 5.3.2 North America
- 5.3.2.1 United States
- 5.3.2.2 Canada
- 5.3.2.3 Mexico
- 5.3.3 Europe
- 5.3.3.1 Germany
- 5.3.3.2 United Kingdom
- 5.3.3.3 France
- 5.3.3.4 Italy
- 5.3.3.5 Russia
- 5.3.3.6 Rest of Europe
- 5.3.4 South America
- 5.3.4.1 Brazil
- 5.3.4.2 Argentina
- 5.3.4.3 Rest of South America
- 5.3.5 Middle-East and Africa
- 5.3.5.1 Saudi Arabia
- 5.3.5.2 South Africa
- 5.3.5.3 Rest of Middle-East and Africa
- 5.3.1 Asia-Pacific
6 Competitive Landscape
- 6.1 Market Concentration
- 6.2 Strategic Moves
- 6.3 Market Share(%)/Ranking Analysis
- 6.4 Company Profiles (includes Global Overview, Market Overview, Core Segments, Financials, Strategic Information, Products and Services, Recent Developments)
- 6.4.1 3M
- 6.4.2 AECI
- 6.4.3 Arkema
- 6.4.4 BASF
- 6.4.5 Betachem (Pty) Ltd
- 6.4.6 Celanese Corporation
- 6.4.7 Chevron Phillips Chemical Company LLC
- 6.4.8 Clariant
- 6.4.9 CTC (Tennant Consolidated Group)
- 6.4.10 Ecolab
- 6.4.11 FMC Corporation
- 6.4.12 Indorama Ventures Public Limited
- 6.4.13 Kemira
- 6.4.14 NASACO
- 6.4.15 Nouryon
- 6.4.16 Orica Limited
- 6.4.17 Qingdao Ruchang Mining Industry Co. Ltd
- 6.4.18 Sasol
- 6.4.19 SNF Group
- 6.4.20 Syensqo
7 Market Opportunities and Future Outlook
- 7.1 White-space and Unmet-need Assessment

 礦業化學品市場:依化學品類型、形態、礦石類型和應用分類-2026-2032年全球市場預測
 礦業化學品市場預測至2034年-按產品類型、化學品類型、礦物類型、萃取方法、應用和地區分類的全球分析
 溶液採礦市場規模、佔有率和成長分析:按礦物類型、技術、應用和地區分類-2026-2033年產業預測
 鑽井化學品市場:按化學品、流體類型、應用和地區分類採礦浮選化學品市場:依礦石類型、化學品類型和地區分類。
 礦業化學品市場規模、佔有率、趨勢和預測:按產品類型、礦物類型、應用和地區分類,2026-2034年
 礦業化學品市場規模、佔有率和趨勢分析報告:按礦石類型、應用、地區和細分市場預測(2026-2033 年)礦業化學品市場:依產品類型、應用和地區分類
 2026年全球礦業化學品市場報告
 礦業化學品市場-全球產業規模、佔有率、趨勢、機會及預測(按類型、應用、地區和競爭格局分類,2021-2031年)