


 |
市場調查報告書
商品編碼
2120315
飼料磷酸鹽:市場佔有率分析、產業趨勢和統計數據、成長預測(2026-2031)Feed Phosphate - Market Share Analysis, Industry Trends & Statistics, Growth Forecasts (2026 - 2031) |
||||||

※ 本網頁內容可能與最新版本有所差異。詳細情況請與我們聯繫。
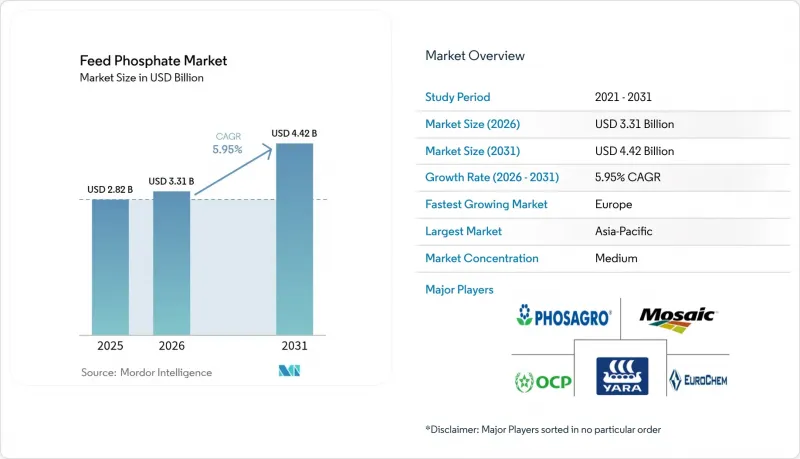
根據 Mordor Intelligence 預測,飼料磷酸鹽市場規模預計將從 2025 年的 28.2 億美元和 2026 年的 33.1 億美元成長到 2031 年的 44.2 億美元,2026 年至 2031 年的複合年成長率為 5.95%。
本報告按飼料類型(磷酸一鈣、磷酸二鈣、磷酸一/磷酸二鈣、磷酸三鈣、脫氟磷酸鹽及其他飼料)、牲畜類型(家禽、豬、牛、水產及其他牲畜)和地區(北美、歐洲、亞太及其他地區)進行細分。市場預測以美元計價。
全球飼料磷酸鹽市場趨勢及洞察
對肉類和乳製品中蛋白質的需求不斷成長。
未來十年,肉類總消費量預計將增加47.9公噸。至2034年,人均年消費量預計將增加0.9公斤(以零售可食用重量計)。在高所得國家,人們對動物福利、環境影響和健康的擔憂正在影響消費者的行為,在某些情況下,人均肉品消費量的成長是推動消費成長的主要動力。中國和印度的都市化正促使人們的可支配收入流向以動物蛋白為主的飲食結構,這需要為肉雞、肥育豬和高產乳牛提供添加磷酸鹽的飼料。巴西和阿根廷已簽訂多年磷酸鹽契約,這些合約擴大了集約化養殖規模,以滿足出口市場需求並穩定價格,同時收緊了現貨市場的供應。儘管改良的技術降低了磷酸鹽的使用比例,但由於磷酸鹽含量低於最低標準會影響骨骼強度,因此需求仍然強勁。因此,儘管效率有所提高,但飼料磷酸鹽市場仍遵循「蛋白質轉換」的趨勢。
工業化畜牧業的擴張
到2025年,美國集約化畜牧設施將飼養920萬牛、7300萬頭豬和18億隻肉雞,這將導致對高純度磷酸鹽的集中需求,以確保牲畜穩定生長和可追溯性。歐洲農場也在擴大規模,為能夠生產粒徑均勻、重金屬含量低的認證產品的供應商創造了有利環境。到2025年,中國主要豬肉生產商將控制大部分產量,其市佔率在一年內增加了4個百分點。這些公司也正在聯合投資建造專用磷酸鹽混合生產線,將當地磨粉商排除在市場之外。隨著牲畜數量的增加,對糞便管理的監管也日益嚴格,一體化生產商傾向於使用能夠減少廢物的生物利用度高的磷酸鹽。大型一體化生產商簽署的大額合約給獨立混合商的利潤率帶來了壓力,但同時,這些合約也明確了市場需求前景,並鼓勵對上游工程的新窯爐進行投資。
嚴格監管磷洩漏問題
切薩皮克灣的每日最大負荷量(TMDL)將年磷排放量限制在830萬公斤以內,重犯者將被處以最高50萬美元的罰款,並要求生產者將飼料中的磷含量降低12%至18%。為了符合標準,這項法規促使飼料配方和糞便管理方式發生了重大變化。在波羅的海地區,排放限制推動了畜禽糞便處理技術和精準飼餵技術的進步,提高了養分利用效率。然而,合規成本正在擠壓價格敏感型市場的利潤空間,迫使生產者採用更具成本效益的解決方案。雖然使用植酸酶和人工授精透過提高磷的消化率和減少廢棄物排放帶來了一定的改善,但受監管流域的磷酸鹽總量保持不變或下降趨勢,抑制了飼料磷酸鹽市場的整體成長。
細分市場分析
到2025年,磷酸二鈣將佔飼料磷酸鹽市場41.5%的佔有率。這反映了其均衡的鈣磷比,既簡化了配方,又能增強飼料蛋殼的強度。蛋雞是一個穩定且對價格敏感的客戶群體,他們重視成本的可預測性,這使得磷酸二鈣供應商能夠簽訂年度契約,從而滿足飼料磷酸鹽市場的基本負載需求。一體化生產商看重該產品的高流動性顆粒,這可以減少大容量粉碎機中的料倉架橋現象,並提高混合均勻性。大型垂直整合企業利用其礦產資源提供具競爭力的交貨價格,從而限制區域混合商。然而,為了應對中國和印度日益嚴格的監管,磷酸二鈣生產線也在進行改進,以降低氟含量。
磷酸一鈣是飼料磷酸鹽中成長最快的類型,年複合成長率達6.1%,預計到2031年將進一步擴大在飼料磷酸鹽市場的佔有率。其超過90%的生物利用度使混合商能夠在降低總磷含量的同時達到性能目標,這在對營養物排放課稅的地區具有顯著提案。高精度感測器可以量化此優勢並實現最佳化,相關數據會即時顯示在工廠管理人員的儀錶板上。摩洛哥和沙烏地阿拉伯的磷酸一鈣供應量正在增加,這兩個國家新建的酸處理廠可以根據季節性需求波動在磷酸一鈣和磷酸二鈣之間切換。
區域分析
到2025年,亞太地區將佔飼料磷酸鹽市場34.2%的佔有率。這主要得益於中國2,800萬噸的家禽養殖業和印度快速成長的水產養殖業。儘管中國強制要求添加植酸酶,但該地區仍需進口高品質磷酸鹽以滿足低氟化物的要求,預計到2025年,摩洛哥和沙烏地阿拉伯的供應量將增加。東南亞蝦類養殖業的快速發展推動了對磷酸二氫鈣的需求,該產品已被證實具有90%的消化率。目前該地區的混合生產商尚無法達到此標準,導致對進口的依賴性增強。日本和韓國是循環磷酸鹽試點計畫的理想試驗場,政府提供的涵蓋資本成本的補貼正在吸引更多新企業進入再生飼料磷酸鹽市場。
預計到2031年,歐洲將實現最快成長,年複合成長率將達到5.2%,這主要得益於「從農場到餐桌」策略以及不斷上漲的碳價對採購決策的影響。德國、法國和荷蘭正在推動對氟含量低於0.18%的優質產品的需求,而波蘭和西班牙則透過擴大家禽生產以供應出口市場來推動銷售量成長。在英國,一項政策已經訂定,允許對與減少營養負荷相關的生態系統服務進行付費,從而促進精準施肥,並使供應商能夠獲得詳細的生物利用度數據。
北美、南美以及中東和非洲的需求前景喜憂參半。在美國,切薩皮克灣和加州等受監管流域的磷酸鹽消費量略有下降,但由於中西部地區生豬和肉雞產量增加,全國範圍內的磷酸鹽消費量保持穩定。巴西對亞洲的出口迫使家禽和生豬生產商不顧外匯波動,確保磷酸鹽進口。一家新的昆蟲蛋白合資企業預計將在高級產品線中實現部分替代。沙烏地阿拉伯的馬阿登公司每年從拉斯蓋爾港出口數十萬噸磷酸鹽,並提供大幅折扣以鞏固其在埃及和約旦的市場佔有率。在撒哈拉以南非洲,奈及利亞和南非的磷酸鹽出口量正從低點回升,但外匯波動迫使一體化生產商建立相當於2-3個月的庫存,增加了營運資金。
其他好處:
- Excel格式的市場預測(ME)表
- 3個月的分析師支持
目錄
第1章:引言
- 研究假設和市場定義
- 調查範圍
第2章:調查方法
第3章執行摘要
第4章 市場狀況
- 市場概覽
- 市場促進因素
- 對肉類和乳製品蛋白的需求增加
- 畜牧業的擴張
- 精密飼料加工的技術進步
- 混合飼餵昆蟲蛋白可提高磷酸鹽的利用效率。
- 強制性磷回收利用正在加速採用再生飼料磷酸鹽。
- 利用人工智慧進行精準磷肥施用,可以減少浪費和成本。
- 市場限制因素
- 嚴格監管磷洩漏問題
- 磷礦石價格波動
- 摩洛哥和俄羅斯岩石出口面臨的地緣政治供應風險
- 碳定價體系推高了熱脫氟的成本,而熱脫氟需要大量的能源。
- 監理情勢
- 技術展望
- 波特五力分析
第5章 市場規模與成長預測
- 按飼料類型
- 磷酸一鈣
- 磷酸二鈣
- 磷酸二鈣
- 磷酸三鈣
- 除氟磷酸鹽
- 其他類型的飼料
- 依牲畜類型
- 家禽
- 豬
- 牛
- 水生動物
- 其他牲畜類型
- 按地區
- 北美洲
- 美國
- 加拿大
- 墨西哥
- 其他北美國家
- 歐洲
- 德國
- 英國
- 法國
- 俄羅斯
- 西班牙
- 其他歐洲國家
- 亞太地區
- 印度
- 中國
- 日本
- 澳洲
- 其他亞太國家
- 南美洲
- 巴西
- 阿根廷
- 其他南美國家
- 中東
- 沙烏地阿拉伯
- 阿拉伯聯合大公國
- 其他中東國家
- 非洲
- 南非
- 奈及利亞
- 其他非洲國家
- 北美洲
第6章 競爭情勢
- 市場集中度
- 策略趨勢
- 市佔率分析
- 公司簡介
- OCP SA
- The Mosaic Company
- Public Joint-Stock Company PhosAgro
- EuroChem Group AG
- Yara International ASA
- TIMAB Industries SAS(Groupe Roullier SA)
- Nutrien Ltd.
- JR Simplot Company
- ICL Group Ltd.
- Saudi Arabian Mining Company(Ma'aden)
- Innophos Holdings Inc.
- Guizhou Chia Tai Industry Co., Ltd.(Charoen Pokphand Group Co., Ltd.)
- Lomon Billions Group Co., Ltd.
- WengFu Group Co., Ltd.
- Vishnupriya Chemicals Pvt. Ltd
第7章 市場機會與未來展望
According to Mordor Intelligence, the feed phosphate market size is projected to expand from USD 2.82 billion in 2025 and USD 3.31 billion in 2026 to USD 4.42 billion by 2031, registering a 5.95% CAGR between 2026 and 2031.
This report is Segmented by Feed Type (Monocalcium Phosphate, Dicalcium Phosphate, Mono-Dicalcium Phosphate, Tricalcium Phosphate, Defluorinated Phosphate, and Other Feed Types), by Livestock Type (Poultry, Swine, Cattle, Aquatic Animals, and Other Livestock Types), and by Geography (North America, Europe, Asia-Pacific, and More). The Market Forecasts are Provided in Terms of Value (USD).
Global Feed Phosphate Market Trends and Insights
Rising Demand for Meat and Dairy Proteins
Total meat consumption is projected to grow by 47.9 metric tons over the next decade. Annual per capita consumption is projected to rise by 0.9 kg per capita per year (edible retail weight equivalent) by 2034. In high-income countries, concerns about animal welfare, environmental impact, and health are influencing consumer behavior, leading to stagnation in per capita meat consumption in some cases, with poultry and pork driving gains in Asia-Pacific and South America. Urbanization in China and India pushes disposable incomes toward animal-protein diets that require phosphate-fortified rations for broilers, finishers, and high-yielding dairy cows. Brazil and Argentina expanded confined feeding to supply export markets, signing multi-year phosphate contracts that stabilize prices yet tighten spot availability. Demand remains resilient because minimum phosphorus thresholds cannot be breached without compromising bone integrity, even as precision tools shave inclusion rates. Consequently, the feed phosphate market continues to track the protein transition despite efficiency gains.
Expansion of Industrial Livestock Operations
Concentrated animal feeding operations in the United States housed 9.2 million cattle, 73 million hogs, and 1.8 billion broilers in 2025, channeling demand toward high-purity phosphates that ensure consistent growth and traceability. European farms with grew, a scale that rewards suppliers capable of producing uniform particle size and certified low heavy metals. China's top pork producers controlled significant output in 2025, up four points in one year, and co-invested in dedicated phosphate blending lines that crowd out local mills. Larger herds intensify scrutiny of manure management, pushing integrators to prefer bioavailable phosphates that reduce excretion loads. Volume contracts signed by mega-integrators also compress margins for independent blenders, yet they provide demand visibility that encourages upstream investment in new kilns.
Stringent Regulations on Phosphorus Run-Off
The Chesapeake Bay Total Maximum Daily Load limits annual phosphorus discharge to 8.3 million kilograms and imposes fines of up to USD 500,000 for repeat violations, requiring producers to reduce dietary phosphorus by 12% to 18%. This regulation has driven significant changes in feed formulations and manure management practices to meet compliance standards. In the Baltic Sea region, a discharge limit has driven advancements in manure treatment technologies and precision feeding practices, enabling more efficient nutrient utilization. Compliance costs have tightened profit margins in price-sensitive markets, compelling producers to adopt cost-effective solutions. While the use of phytase and AI dosing provides some relief by improving phosphorus digestibility and reducing waste, overall phosphate volumes in regulated watersheds remain stable or decline, tempering growth in the broader feed phosphate market.
Other drivers and restraints analyzed in the detailed report include:
- Insect-Protein Co-Feeding Improving Phosphate Utilization
- Phosphorus-Recycling Mandates Accelerating Circular Feed Phosphates
- Carbon-Pricing Schemes Inflating High-Energy Thermal Defluorination Costs
For complete list of drivers and restraints, kindly check the Table Of Contents.
Segment Analysis
Dicalcium phosphate captured 41.5% of the feed phosphate market share in 2025, reflecting its balanced calcium-to-phosphorus ratio that simplifies formulation and supports eggshell strength in layer diets. Layers represent a steady, price-sensitive customer base that values cost predictability, enabling dicalcium suppliers to secure annual contracts that underpin base-load demand in the feed phosphate market. Integrators appreciate the product's free-flowing granules, which reduce bin bridging and improve mixing uniformity in high-throughput mills. Vertical-integrated majors leverage rock ownership to offer competitive delivered pricing, keeping regional blenders at bay. Nonetheless, even dicalcium lines are upgrading to lower fluorine profiles to meet tightening limits in China and India.
Monocalcium phosphate is the fastest-growing feed type, projected to log a 6.1% CAGR and raise its share of the feed phosphate market by 2031. Its 90%-plus bioavailability lets formulators cut total phosphorus while still hitting performance targets, a powerful value proposition in regions that tax nutrient discharge. Precision sensors quantify this advantage, enabling real-time optimization that lights up on dashboards for mill managers. Supply is ramping in Morocco and Saudi Arabia, where new acid-route plants can swing between mono- and dicalcium grades to match seasonal pulls.
Complete Report Scope:
- By Feed Type
- Monocalcium Phosphate
- Dicalcium Phosphate
- Mono-Dicalcium Phosphate
- Tricalcium Phosphate
- Defluorinated Phosphate
- Other Feed Types
- By Livestock Type
- Poultry
- Swine
- Cattle
- Aquatic Animals
- Other Livestock Types
- By Geography
- North America
- United States
- Canada
- Mexico
- Rest of North America
- Europe
- Germany
- United Kingdom
- France
- Russia
- Spain
- Rest of Europe
- Asia-Pacific
- India
- China
- Japan
- Australia
- Rest of Asia-Pacific
- South America
- Brazil
- Argentina
- Rest of South America
- Middle East
- Saudi Arabia
- United Arab Emirates
- Rest of Middle East
- Africa
- South Africa
- Nigeria
- Rest of Africa
- North America
Geography Analysis
Asia-Pacific generated 34.2% of the feed phosphate market share in 2025, anchored by China's 28 million metric tons poultry sector and India's accelerating aquaculture output. China mandates phytase inclusion yet still imports premium phosphates to meet low-fluorine demands, lifting Moroccan and Saudi deliveries in 2025. Southeast Asia's shrimp boom has shifted preference toward monocalcium grades with verified 90% digestibility, a specification that regional blenders cannot yet match, leading to increased reliance on imports. Japan and South Korea provide fertile test beds for circular-phosphorus pilots, and government subsidies covering capital costs draw new entrants into the recycled feed phosphate market.
Europe is anticipated to witness the fastest growth, with a 5.2% CAGR through 2031, supported by the Farm to Fork Strategy and increasing carbon prices shaping procurement decisions. Germany, France, and the Netherlands dominate demand for premium grades with fluorine content below 0.18%, while Poland and Spain drive volume growth through poultry expansion aimed at export markets. In the United Kingdom, policies now offer payments for ecosystem services linked to reduced nutrient loading, promoting precision dosing and benefiting suppliers with detailed bioavailability dossiers.
The demand in North America, South America, the Middle East, and Africa presents a mixed outlook. United States consumption edges lower in regulated watersheds such as Chesapeake Bay and California, but stays stable nationally due to hog and broiler growth in the Midwest. Brazil's exports to Asia push poultry and swine producers to lock in phosphate imports despite currency swings, with new insect-protein joint ventures promising partial substitution in premium lines. Saudi Arabia's Ma'aden ships hundreds of thousands of metric tons annually from Ras Al Khair, offering significant discounts to strengthen its market presence in Egypt and Jordan. In sub-Saharan Africa, Nigeria and South Africa lift volume from a low base, although forex volatility forces integrators to stockpile two to three months of inventory, inflating working capital.
- OCP S.A.
- The Mosaic Company
- Public Joint-Stock Company PhosAgro
- EuroChem Group AG
- Yara International ASA
- TIMAB Industries S.A.S. (Groupe Roullier S.A.)
- Nutrien Ltd.
- J.R. Simplot Company
- ICL Group Ltd.
- Saudi Arabian Mining Company (Ma'aden)
- Innophos Holdings Inc.
- Guizhou Chia Tai Industry Co., Ltd. (Charoen Pokphand Group Co., Ltd.)
- Lomon Billions Group Co., Ltd.
- WengFu Group Co., Ltd.
- Vishnupriya Chemicals Pvt. Ltd
Additional Benefits:
- The market estimate (ME) sheet in Excel format
- 3 months of analyst support
TABLE OF CONTENTS
1 Introduction
- 1.1 Study Assumptions and Market Definition
- 1.2 Scope of the Study
2 Research Methodology
3 Executive Summary
4 Market Landscape
- 4.1 Market Overview
- 4.2 Market Drivers
- 4.2.1 Rising demand for meat and dairy proteins
- 4.2.2 Expansion of industrial livestock operations
- 4.2.3 Technological advances in precision feed processing
- 4.2.4 Insect-protein co-feeding improving phosphate utilization
- 4.2.5 Phosphorus-recycling mandates accelerating circular feed phosphates
- 4.2.6 Artificial Intelligence driven precision phosphorus dosing cutting wastage and cost
- 4.3 Market Restraints
- 4.3.1 Stringent regulations on phosphorus run-off
- 4.3.2 Volatility in phosphate-rock prices
- 4.3.3 Geo-political supply risk to Moroccan and Russian rock exports
- 4.3.4 Carbon-pricing schemes inflating high-energy thermal defluorination costs
- 4.4 Regulatory Landscape
- 4.5 Technological Outlook
- 4.6 Porter's Five Forces Analysis
- 4.6.1 Bargaining Power of Suppliers
- 4.6.2 Bargaining Power of Buyers
- 4.6.3 Threat of New Entrants
- 4.6.4 Threat of Substitute Products
- 4.6.5 Intensity of Competitive Rivalry
5 Market Size and Growth Forecasts (Value)
- 5.1 By Feed Type
- 5.1.1 Monocalcium Phosphate
- 5.1.2 Dicalcium Phosphate
- 5.1.3 Mono-Dicalcium Phosphate
- 5.1.4 Tricalcium Phosphate
- 5.1.5 Defluorinated Phosphate
- 5.1.6 Other Feed Types
- 5.2 By Livestock Type
- 5.2.1 Poultry
- 5.2.2 Swine
- 5.2.3 Cattle
- 5.2.4 Aquatic Animals
- 5.2.5 Other Livestock Types
- 5.3 By Geography
- 5.3.1 North America
- 5.3.1.1 United States
- 5.3.1.2 Canada
- 5.3.1.3 Mexico
- 5.3.1.4 Rest of North America
- 5.3.2 Europe
- 5.3.2.1 Germany
- 5.3.2.2 United Kingdom
- 5.3.2.3 France
- 5.3.2.4 Russia
- 5.3.2.5 Spain
- 5.3.2.6 Rest of Europe
- 5.3.3 Asia-Pacific
- 5.3.3.1 India
- 5.3.3.2 China
- 5.3.3.3 Japan
- 5.3.3.4 Australia
- 5.3.3.5 Rest of Asia-Pacific
- 5.3.4 South America
- 5.3.4.1 Brazil
- 5.3.4.2 Argentina
- 5.3.4.3 Rest of South America
- 5.3.5 Middle East
- 5.3.5.1 Saudi Arabia
- 5.3.5.2 United Arab Emirates
- 5.3.5.3 Rest of Middle East
- 5.3.6 Africa
- 5.3.6.1 South Africa
- 5.3.6.2 Nigeria
- 5.3.6.3 Rest of Africa
- 5.3.1 North America
6 Competitive Landscape
- 6.1 Market Concentration
- 6.2 Strategic Moves
- 6.3 Market Share Analysis
- 6.4 Company Profiles (Includes Global-Level Overview, Market-Level Overview, Core Segments, Financials as Available, Strategic Information, Market Rank/Share, Products and Services, and Recent Developments)
- 6.4.1 OCP S.A.
- 6.4.2 The Mosaic Company
- 6.4.3 Public Joint-Stock Company PhosAgro
- 6.4.4 EuroChem Group AG
- 6.4.5 Yara International ASA
- 6.4.6 TIMAB Industries S.A.S. (Groupe Roullier S.A.)
- 6.4.7 Nutrien Ltd.
- 6.4.8 J.R. Simplot Company
- 6.4.9 ICL Group Ltd.
- 6.4.10 Saudi Arabian Mining Company (Ma'aden)
- 6.4.11 Innophos Holdings Inc.
- 6.4.12 Guizhou Chia Tai Industry Co., Ltd. (Charoen Pokphand Group Co., Ltd.)
- 6.4.13 Lomon Billions Group Co., Ltd.
- 6.4.14 WengFu Group Co., Ltd.
- 6.4.15 Vishnupriya Chemicals Pvt. Ltd

