


 |
市場調查報告書
商品編碼
2119907
3D測量:市場佔有率分析、產業趨勢與統計、成長預測(2026-2031年)3D Metrology - Market Share Analysis, Industry Trends & Statistics, Growth Forecasts (2026 - 2031) |
||||||

※ 本網頁內容可能與最新版本有所差異。詳細情況請與我們聯繫。
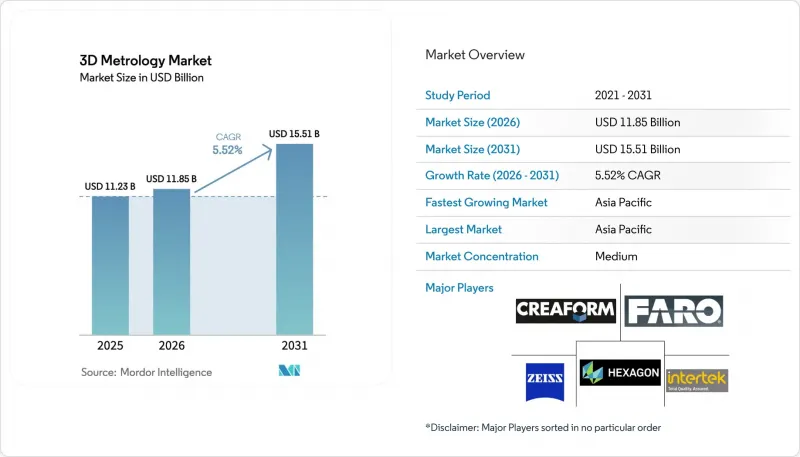
根據 Mordor Intelligence 預測,3D 測量市場規模將從 2025 年的 112.3 億美元成長到 2026 年的 118.5 億美元,然後在 2031 年達到 155.1 億美元,2026 年至 2031 年的複合年成長率為 5.52%。
本報告按組件(硬體、軟體、服務)、硬體類型(座標測量機、雷射追蹤儀等)、應用(品管和檢測、逆向工程、校準和組裝等)、最終用戶產業(汽車、航太和國防、建築和工程等)以及地區進行細分。市場預測以價值(美元)表示。
全球3D測量市場趨勢與洞察
在電動汽車電池超級工廠引入線上測量
隨著汽車製造商加速電動車的生產,即時尺寸檢測正成為鋰離子電池工廠的標準配備。美國和加拿大的政府獎勵正在加速超級工廠的建設,從而催生了對高通量X光電腦斷層掃描(CT)系統的需求,該系統能夠在不損壞電芯的情況下檢測內部焊接缺陷。整合到生產線中的掃描器正在提高良率,適應新的電池化學成分,並降低保固風險。供應商正在整合分析功能,將測量數據與電池組的數位孿生模型關聯起來,使工程師能夠在出貨前預測熱失控。隨著北美供應鏈的在地化程度不斷提高,歐盟電池法規也正在將類似技術引入歐洲工廠。因此,結構性利多因素正在推動電芯、模組和電池組組裝工廠對光學、雷射和X光測量技術的投資。
航太原始設備製造商對積層製造(AM)的檢驗要求
如今,各大飛機製造商要求所有採用積層製造 (AM) 技術製造的結構部件在首飛前進行尺寸檢驗。美國聯邦航空管理局 (FAA) 和美國空軍正在聯合開發統一的檢測指南,該指南利用高解析度雷射掃描儀和工業 CT 掃描來檢驗傳統測量儀器無法觸及的內部晶格結構。攜帶式藍光掃描儀已被證明對採用選擇性雷射熔融(SLM) 技術製造的鈦合金零件具有極高的精度,從而能夠在飛機大修期間進行快速的現場檢測。歐洲領先的製造商已經擴建了其品管(QC) 實驗室以滿足此要求,這為提供硬體、軟體和培訓一體化解決方案供應商創造了新的商機。這項要求也正在波及二級供應商,他們正在採用基於雲端的分析功能來贏得新契約,儘管國防領域的網路安全法規限制了遠端資料託管。
符合 ISO 17025 標準的校準實驗室短缺
在非洲,每1000萬人中僅有不到一個校準實驗室,這限制了需要年度溯源性測試的高精度儀器的區域可用性。儘管南部非洲發展共同體(SADCAS)已在其13個成員國中認證了300家機構,但產能仍無法滿足需求。研究表明,成功的關鍵在於經營團隊的承諾、資金籌措和熟練的員工。由於缺乏認證,許多公司不得不將探頭送往歐洲或亞洲進行測試,導致停機時間延長6-8週。雖然各國政府試圖透過「永續發展品質基礎設施」(QISD)計畫來彌合這一差距,但進展緩慢,阻礙了高階系統的銷售。
細分市場分析
預計到2025年,硬體部分將佔銷售額的65.40%,凸顯了製造業對實體掃描器、座標測量機(CMM)和X光系統的需求。然而,隨著製造商購買包含安裝、校準和分析的承包解決方案,預計到2031年,服務部分將以8.31%的複合年成長率成長,超過設備銷售增速。隨著航太、醫療和電動車電池生產線的流程日益複雜,企業被迫將測量技術的專業知識外包。供應商現在銷售基於訂閱的軟體,並捆綁維護契約,從而產生持續的現金流,而這在純硬體模式下難以實現。例如,Hexagon的「製造智慧」部門將資訊服務定位為設計和生產之間的橋樑,旨在提高運轉率並促進永續性。
隨著客戶對基於結果的合約需求日益成長,供應商正投資建造遠端監控平台,以檢測工具磨損和夾具錯位,並在故障發生前派遣現場工程師。這種託管服務模式與自動化和機器人領域的趨勢類似。由於認證和應用專業知識至關重要,全球企業正利用其獲得 ISO 17025 認證的實驗室來鞏固長期客戶關係。在技術人才稀缺的新興市場,服務溢價更高,成長重心也正從一次性設備交易轉移到服務。這種轉變提高了僅提供硬體的新參與企業的進入門檻,但也為專注於 3D 測量行業細分垂直市場的專業服務公司開闢了新的利基市場。
座標測量機 (CMM) 憑藉其亞微米級的重複精度和成熟的 ISO 10360 標準,在 2025 年仍保持 37.65% 的市場佔有率。橋式 CMM 用於引擎缸體測量,而龍門式 CMM 則用於航太結構測量。然而,雷射掃描儀正以每年 6.18% 的速度成長,因為生產線更傾向於對複雜自由曲面進行快速、非接觸式測量。可攜式手持設備如今已具備以往只有固定式設備才能達到的精度,其應用範圍也已擴展到品管(QC) 實驗室之外。光學結構掃描儀無需噴塗粉末即可測量塗漆和光滑表面,從而縮短了準備時間。結合接觸式和光學探頭的多感測器設備正在湧現,透過支援混合操作,在單一安裝空間內提供了柔軟性。
研究表明,手持式雷射三角測量和藍光系統為選擇性雷射熔融(SLM) 零件提供了最高的精度,這在積層製造領域是一項顯著優勢。市場領導者正在整合攝影測量目標,以拓展其應用範圍,例如船舶船體和風力渦輪機葉片。二極體成本的降低和 GPU 速度的提升使得即時點雲生成成為可能,從而推動了 3D 測量市場對線上機器人消除技術的興趣。供應商強調其在製造環境中對振動和熱漂移的穩健性,並透過軟體升級增加了 AI 濾波功能來抑制雜訊。這些進步正在縮小光學方法和接觸式方法之間的精確度差距,使用戶能夠將更多檢測提前到流程的早期階段。
區域分析
預計到2025年,亞太地區將佔全球銷售額的51.60%,並在2031年之前維持5.55%的複合年成長率。這主要得益於中國的「中國製造2025」藍圖,促使機器人相關藍圖增加13%,機器人相關企業數量激增29.5%。韓國的補貼計畫正在加速半導體製造廠向智慧工廠的升級改造,而日本的精密工程傳統則支撐著穩定的更新換代週期。此外,亞太地區在客製化醫療植入領域也發揮主導作用,利用積層製造技術滿足老齡化社會的需求。
北美是第二大市場。美國《晶片技術創新與應用法案》(CHIPS Act)以及美國國家標準與技術研究院(NIST)申請的2025會計年度14.98億美元預算(其中4,770萬美元用於人工智慧測量研究)正在支持奈米級測量技術的投資。華盛頓州、阿拉巴馬州和魁北克省的航太設施正在根據美國聯邦航空指南(FAA)的新指南部署攜帶式測量設備,用於積層製造(AM)零件的檢驗。
歐洲在技術上依然領先,德國和北歐國家在風力發電機的數位孿生專案方面主導。法國航太產業叢集正在進行現代化改造,引入了用於引擎零件的CT掃描技術。拉丁美洲和中東的投資週期與汽車和石油天然氣產業的投資週期相吻合。巴西正在使用雷射追蹤器維修鋼鐵廠,而阿拉伯聯合大公國的一家能源公司正在掃描海上鑽井平台,以製定維修計劃。非洲由於認證測試實驗室數量有限而略顯落後,但南部非洲發展共同體(SADCAS)計畫已認證了300家實驗室,這表明其生態系統正在逐步發展。
其他好處:
- Excel格式的市場預測(ME)表
- 3個月的分析師支持
目錄
第1章:引言
- 研究假設和市場定義
- 調查範圍
第2章:調查方法
第3章執行摘要
第4章 市場狀況
- 市場概覽
- 市場促進因素
- 在北美電動車電池超級工廠引進線上測量技術
- 歐洲航太原始設備製造商對積層製造零件的驗證要求
- 亞洲醫療植入契約製造業務激增
- 韓國和中國政府對智慧製造的補貼
- 汽車生產線向輕質複合材料過渡需要非接觸式藍光掃描
- 將測量數據整合到北歐風力發電機葉片的數位孿生模型中
- 市場限制因素
- 非洲符合 ISO 17025 標準的校準實驗室短缺
- 中小企業擁有多感測器三座標測量機的總擁有成本較高。
- 資料安全問題阻礙了國防領域基於雲端的測量和分析。
- AS9100 文件的複雜性導致航太產業二級供應商採用此標準延誤。
- 產業生態系分析
- 技術展望
- 波特五力分析
第5章 市場規模與成長預測
- 按組件
- 硬體
- 軟體
- 服務
- 依硬體類型
- 座標測量機(CMM)
- 雷射追蹤器
- 光學和結構光學掃描儀
- 視訊測量機(VMM)
- 攝影測量系統
- 其他
- 透過使用
- 品管和檢驗
- 逆向工程
- 虛擬模擬與數位孿生
- 3D列印和積層製造技術的檢驗
- 對準和組裝
- 其他
- 按最終用戶行業分類
- 車
- 航太/國防
- 工業製造和重型機械
- 電子和半導體
- 醫療和牙科護理
- 能源和發電
- 建築與工程
- 文化遺產與考古
- 其他
- 按地區
- 北美洲
- 美國
- 加拿大
- 墨西哥
- 歐洲
- 德國
- 英國
- 法國
- 義大利
- 西班牙
- 其他歐洲國家
- 亞太地區
- 中國
- 日本
- 韓國
- 印度
- 東南亞
- 其他亞太國家
- 南美洲
- 巴西
- 其他南美國家
- 中東和非洲
- 中東
- 阿拉伯聯合大公國
- 沙烏地阿拉伯
- 其他中東國家
- 非洲
- 南非
- 其他非洲國家
- 中東
- 北美洲
第6章 競爭情勢
- 市場集中度
- 策略趨勢
- 市佔率分析
- 公司簡介
- Hexagon AB
- Carl Zeiss AG
- FARO Technologies Inc.
- Nikon Corporation(Nikon Metrology)
- Mitutoyo Corporation
- Renishaw plc
- Creaform Inc.
- WENZEL Group GmbH and Co. KG
- GOM GmbH(ZEISS)
- Trimble Inc.
- Keyence Corporation
- Perceptron Inc.(Atlas Copco)
- KLA Corporation
- Zygo Corporation
- 3D Systems Corporation
- Metrologic Group
- Jenoptik AG
- InnovMetric Software Inc.
- Leica Geosystems AG
- Hexagon Manufacturing Intelligence
- Intertek Group plc
- API-Automated Precision Inc.
- Shining 3D
- Kreon Technologies
- CyberOptics Corporation
第7章 市場機會與未來展望
According to Mordor Intelligence, the 3D metrology market size is expected to grow from USD 11.23 billion in 2025 to USD 11.85 billion in 2026 and is forecast to reach USD 15.51 billion by 2031 at 5.52% CAGR over 2026-2031.
This report is Segmented by Component (Hardware, Software, and Services), Hardware Type (Coordinate Measuring Machine, Laser Trackers, and More), Application (Quality Control and Inspection, Reverse Engineering, Alignment and Assembly, and More), End-User Industry (Automotive, Aerospace and Defense, Construction and Engineering, and More), and Geography. The Market Forecasts are Provided in Terms of Value (USD).
Global 3D Metrology Market Trends and Insights
Adoption of Inline Metrology for EV Battery Gigafactories
Real-time dimensional checks are becoming standard in lithium-ion battery plants as automakers race to scale electric-vehicle output. Government incentives in the United States and Canada have accelerated gigafactory construction, creating demand for high-throughput X-ray computed-tomography systems that uncover internal weld defects without destroying cells. Line-integrated scanners are improving yield, supporting new chemistries, and reducing warranty risk. Suppliers are embedding analytics that link measurement data to digital twins of the battery pack, allowing engineers to predict thermal runaway before shipment. As the North American supply chain regionalizes, similar technology is migrating to European facilities under the EU Battery Regulation. The result is a structural tailwind lifting capital spending on optical, laser, and X-ray metrology across cell, module, and pack assembly halls.
Aerospace OEM Mandates for Additive Manufacturing Validation
Major airframe builders now require dimensional proof of every additively manufactured (AM) structural part before first flight. The Federal Aviation Administration's joint program with the U.S. Air Force is finalizing uniform inspection guidelines that depend on high-resolution laser scanners and industrial CT to verify internal lattices that traditional gauges cannot reach. Portable blue-light scanners are proving accurate for selective-laser-melted titanium components, enabling rapid on-site checks during aircraft overhauls. European primes have already expanded QC labs to comply, opening opportunity for solution providers offering combined hardware, software, and training packages. The mandate is cascading to tier-2 suppliers, who are adding cloud-based analytics-even as cyber-rules in defense constrain remote data hosting-to secure new contracts.
Shortage of ISO 17025-Compliant Calibration Labs
Africa fields fewer than 1 calibration lab per 10 million inhabitants, limiting the regional uptake of high-precision instruments that require annual traceability checks. Despite SADCAS accrediting 300 facilities across 13 member states, capacity still trails demand. Studies pin success on leadership commitment, funding, and skilled staff. Lacking accreditation, many firms ship probes to Europe or Asia, extending downtime by 6-8 weeks. Governments aim to close the gap through Quality Infrastructure for Sustainable Development programs, but progress is slow, curbing sales of top-end systems.
Other drivers and restraints analyzed in the detailed report include:
- Surge in Medical Implant Custom Manufacturing
- Government Subsidies for Smart Manufacturing
- Data-Security Concerns Hindering Cloud-based Metrology Analytics in Defense
For complete list of drivers and restraints, kindly check the Table Of Contents.
Segment Analysis
The hardware segment commanded 65.40% revenue in 2025, underscoring the need for physical scanners, CMMs, and X-ray systems on shop floors. Yet services are forecast to compound at 8.31% through 2031, outpacing equipment sales as manufacturers buy turnkey solutions covering installation, calibration, and analytics. Rising process complexity in aerospace, medical, and EV battery lines pushes firms to outsource metrology know-how. Vendors now bundle subscription-based software with maintenance agreements, creating recurring cash flows that were scarce in pure hardware models. Hexagon's Manufacturing Intelligence unit, for instance, positions data services as the bridge between design and production to boost uptime and sustainability.
As customers demand outcome-based contracts, suppliers invest in remote-monitoring portals that flag tool wear or fixture drift, then dispatch field engineers before failures occur. This managed-services logic mirrors trends seen in automation and robotics. Because accreditation and application expertise are vital, global players leverage their ISO 17025 labs to lock in long-term clients. In emerging economies where technical talent is scarce, the services premium is even higher, further tilting growth away from one-time equipment deals. The transition widens entry barriers for new hardware-only entrants but opens niches for specialized service boutiques focused on niche verticals within the 3D metrology industry.
CMMs retained a 37.65% share in 2025 thanks to sub-micron repeatability and established ISO 10360 standards. Bridge-type models handle engine blocks, while gantry versions cover aerospace structures. However, laser scanners are growing 6.18% annually as production lines favor rapid, non-contact capture of complex free-form shapes. Portable handheld units now deliver accuracy once limited to fixed-bed machines, broadening deployment beyond QC labs. Optical structured-light scanners serve painted or shiny surfaces without powdering, reducing prep time. Multi-sensor machines that fuse tactile and optical probes arrive to serve hybrid tasks, offering flexibility in a single footprint.
Research finds handheld laser-triangulation and blue-light systems provide the best accuracy for selective-laser-melted parts, a key edge in additive manufacturing. Market leaders integrate photogrammetry targets to extend working volumes for ship hulls or wind blades. Falling diode costs and faster GPUs support real-time point-cloud creation, spurring interest across the 3D metrology market for inline robotic scanning cells. Vendors emphasize ruggedness against shop-floor vibration and thermal drift, while software upgrades add AI filtering to suppress noise. These advances close the gap between optical and tactile accuracy, encouraging users to slide more inspections to upstream processes.
Complete Report Scope:
- By Component
- Hardware
- Software
- Services
- By Hardware Type
- Coordinate Measuring Machines (CMM)
- Laser Trackers
- Optical and Structured-Light Scanners
- Video Measuring Machines (VMM)
- Photogrammetry Systems
- Others
- By Application
- Quality Control and Inspection
- Reverse Engineering
- Virtual Simulation and Digital Twin
- 3D Printing and Additive Manufacturing Validation
- Alignment and Assembly
- Others
- By End-user Industry
- Automotive
- Aerospace and Defense
- Industrial Manufacturing and Heavy Machinery
- Electronics and Semiconductor
- Medical and Dental
- Energy and Power Generation
- Construction and Engineering
- Heritage and Archaeology
- Others
- By Geography
- North America
- United States
- Canada
- Mexico
- Europe
- Germany
- United Kingdom
- France
- Italy
- Spain
- Rest of Europe
- Asia-Pacific
- China
- Japan
- South Korea
- India
- South East Asia
- Rest of Asia-Pacific
- South America
- Brazil
- Rest of South America
- Middle East and Africa
- Middle East
- United Arab Emirates
- Saudi Arabia
- Rest of Middle East
- Africa
- South Africa
- Rest of Africa
- Middle East
- North America
Geography Analysis
Asia Pacific generated 51.60% of global revenue in 2025 and is growing at a 5.55% CAGR to 2031, propelled by China's Made in China 2025 roadmap, which drove a 13% rise in robot patents and a 29.5% jump in robotics firms. South Korea's subsidy programs speed smart-factory upgrades in semiconductor fabs, while Japan's legacy of precision engineering sustains steady replacement cycles. The region also leads in custom medical implants, applying additive manufacturing to aging population.
North America is the second-largest market. The United States' CHIPS Act and NIST's USD 1.498 billion FY 2025 request-USD 47.7 million of which is earmarked for AI measurement research-support investment in nano-scale metrology. Aerospace hubs in Washington, Alabama, and Quebec deploy portable metrology to validate AM components under new FAA guidance.
Europe remains technologically advanced, spearheading digital-twin projects for wind turbines in Germany and the Nordics. France's aerospace valley continues to modernize with CT-based inspection for engine parts. Latin America and the Middle East follow automotive and oil-and-gas investment cycles; Brazil retrofits steel mills with laser trackers, while UAE energy firms scan offshore rigs for retrofit planning. Africa lags due to limited accredited labs, yet the SADCAS program has accredited 300 sites, signaling gradual ecosystem development.
- Hexagon AB
- Carl Zeiss AG
- FARO Technologies Inc.
- Nikon Corporation (Nikon Metrology)
- Mitutoyo Corporation
- Renishaw plc
- Creaform Inc.
- WENZEL Group GmbH and Co. KG
- GOM GmbH (ZEISS)
- Trimble Inc.
- Keyence Corporation
- Perceptron Inc. (Atlas Copco)
- KLA Corporation
- Zygo Corporation
- 3D Systems Corporation
- Metrologic Group
- Jenoptik AG
- InnovMetric Software Inc.
- Leica Geosystems AG
- Hexagon Manufacturing Intelligence
- Intertek Group plc
- API - Automated Precision Inc.
- Shining 3D
- Kreon Technologies
- CyberOptics Corporation
Additional Benefits:
- The market estimate (ME) sheet in Excel format
- 3 months of analyst support
TABLE OF CONTENTS
1 INTRODUCTION
- 1.1 Study Assumptions and Market Definition
- 1.2 Scope of the Study
2 RESEARCH METHODOLOGY
3 EXECUTIVE SUMMARY
4 MARKET LANDSCAPE
- 4.1 Market Overview
- 4.2 Market Drivers
- 4.2.1 Adoption of Inline Metrology for EV Battery Gigafactories in North America
- 4.2.2 Aerospace OEM Mandates for Additive Manufacturing Part Validation in Europe
- 4.2.3 Surge in Medical Implant Custom Manufacturing Across Asia
- 4.2.4 Government Subsidies for Smart Manufacturing in South Korea and China
- 4.2.5 Transition to Lightweight Composites Requiring Non-contact Blue-light Scanning in Automotive Lines
- 4.2.6 Integration of Metrology Data into Digital Twins for Wind Turbine Blades in the Nordics
- 4.3 Market Restraints
- 4.3.1 Shortage of ISO 17025-Compliant Calibration Labs in Africa
- 4.3.2 High Total Cost of Ownership of Multi-sensor CMMs for SMBs
- 4.3.3 Data-security Concerns Hindering Cloud-based Metrology Analytics in Defense
- 4.3.4 Complexity of AS9100 Documentation Slowing Adoption among Tier-2 Aerospace Suppliers
- 4.4 Industry Ecosystem Analysis
- 4.5 Technological Outlook
- 4.6 Porter's Five Forces Analysis
- 4.6.1 Bargaining Power of Suppliers
- 4.6.2 Bargaining Power of Buyers
- 4.6.3 Threat of New Entrants
- 4.6.4 Threat of Substitutes
- 4.6.5 Intensity of Competitive Rivalry
5 MARKET SIZE AND GROWTH FORECASTS (VALUES)
- 5.1 By Component
- 5.1.1 Hardware
- 5.1.2 Software
- 5.1.3 Services
- 5.2 By Hardware Type
- 5.2.1 Coordinate Measuring Machines (CMM)
- 5.2.2 Laser Trackers
- 5.2.3 Optical and Structured-Light Scanners
- 5.2.4 Video Measuring Machines (VMM)
- 5.2.5 Photogrammetry Systems
- 5.2.6 Others
- 5.3 By Application
- 5.3.1 Quality Control and Inspection
- 5.3.2 Reverse Engineering
- 5.3.3 Virtual Simulation and Digital Twin
- 5.3.4 3D Printing and Additive Manufacturing Validation
- 5.3.5 Alignment and Assembly
- 5.3.6 Others
- 5.4 By End-user Industry
- 5.4.1 Automotive
- 5.4.2 Aerospace and Defense
- 5.4.3 Industrial Manufacturing and Heavy Machinery
- 5.4.4 Electronics and Semiconductor
- 5.4.5 Medical and Dental
- 5.4.6 Energy and Power Generation
- 5.4.7 Construction and Engineering
- 5.4.8 Heritage and Archaeology
- 5.4.9 Others
- 5.5 By Geography
- 5.5.1 North America
- 5.5.1.1 United States
- 5.5.1.2 Canada
- 5.5.1.3 Mexico
- 5.5.2 Europe
- 5.5.2.1 Germany
- 5.5.2.2 United Kingdom
- 5.5.2.3 France
- 5.5.2.4 Italy
- 5.5.2.5 Spain
- 5.5.2.6 Rest of Europe
- 5.5.3 Asia-Pacific
- 5.5.3.1 China
- 5.5.3.2 Japan
- 5.5.3.3 South Korea
- 5.5.3.4 India
- 5.5.3.5 South East Asia
- 5.5.3.6 Rest of Asia-Pacific
- 5.5.4 South America
- 5.5.4.1 Brazil
- 5.5.4.2 Rest of South America
- 5.5.5 Middle East and Africa
- 5.5.5.1 Middle East
- 5.5.5.1.1 United Arab Emirates
- 5.5.5.1.2 Saudi Arabia
- 5.5.5.1.3 Rest of Middle East
- 5.5.5.2 Africa
- 5.5.5.2.1 South Africa
- 5.5.5.2.2 Rest of Africa
- 5.5.5.1 Middle East
- 5.5.1 North America
6 COMPETITIVE LANDSCAPE
- 6.1 Market Concentration
- 6.2 Strategic Moves
- 6.3 Market Share Analysis
- 6.4 Company Profiles (includes Global level Overview, Market level overview, Core Segments, Financials as available, Strategic Information, Market Rank/Share for key companies, Products and Services, and Recent Developments)
- 6.4.1 Hexagon AB
- 6.4.2 Carl Zeiss AG
- 6.4.3 FARO Technologies Inc.
- 6.4.4 Nikon Corporation (Nikon Metrology)
- 6.4.5 Mitutoyo Corporation
- 6.4.6 Renishaw plc
- 6.4.7 Creaform Inc.
- 6.4.8 WENZEL Group GmbH and Co. KG
- 6.4.9 GOM GmbH (ZEISS)
- 6.4.10 Trimble Inc.
- 6.4.11 Keyence Corporation
- 6.4.12 Perceptron Inc. (Atlas Copco)
- 6.4.13 KLA Corporation
- 6.4.14 Zygo Corporation
- 6.4.15 3D Systems Corporation
- 6.4.16 Metrologic Group
- 6.4.17 Jenoptik AG
- 6.4.18 InnovMetric Software Inc.
- 6.4.19 Leica Geosystems AG
- 6.4.20 Hexagon Manufacturing Intelligence
- 6.4.21 Intertek Group plc
- 6.4.22 API - Automated Precision Inc.
- 6.4.23 Shining 3D
- 6.4.24 Kreon Technologies
- 6.4.25 CyberOptics Corporation
7 MARKET OPPORTUNITIES AND FUTURE OUTLOOK
- 7.1 White-space and Unmet-need Assessment

 X光測量系統市場:全球市場預測,2026-2032年晶圓翹曲測量系統市場:全球市場預測,2026-2032年3D雷射掃描測量市場:全球市場預測,2026-2032年3D測量市場:按產品、測量類型、安裝類型、自動化程度、應用和最終用戶分類-全球預測,2026-2032年
 2035年3D測量市場分析及預測:依類型、產品、服務、技術、組件、應用、最終用戶、功能、安裝及解決方案分類
 奈米測量市場規模、佔有率和成長分析:按產品類型、應用、最終用戶產業和地區分類 - 2026-2033 年產業預測
 全球3D測量市場規模、佔有率、趨勢和成長分析報告(2026-2034年)
 2026年全球3D測量技術市場報告
 3D計量市場-全球產業規模、佔有率、趨勢、機會及預測(依產品類型、應用、最終用戶、地區及競爭格局分類,2021-2031年)
 3D測量系統市場:全球2025-2029