


 |
市場調查報告書
商品編碼
2119906
資料標註工具:市場佔有率分析、產業趨勢與統計資料、成長預測(2026-2031 年)Data Annotation Tools - Market Share Analysis, Industry Trends & Statistics, Growth Forecasts (2026 - 2031) |
||||||

※ 本網頁內容可能與最新版本有所差異。詳細情況請與我們聯繫。
根據 Mordor Intelligence 預測,數據標註工具市場規模將從 2025 年的 23.2 億美元成長到 2026 年的 30.7 億美元,然後在 2031 年達到 124.2 億美元,2026 年至 2031 年的複合年成長率為 32.27%。
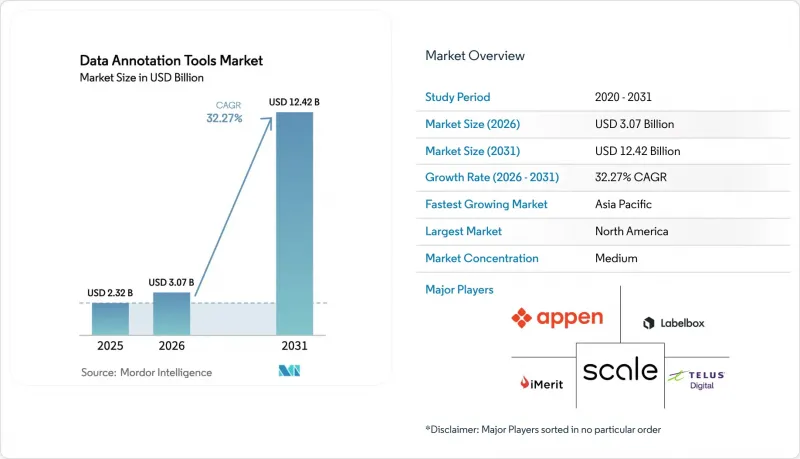
本報告按元件(軟體平台和服務)、資料類型(文字、影像等)、標註類型(手動、半監督等)、部署模式(雲端、本地部署、混合部署)、最終用戶產業(IT與電信、銀行、金融服務和保險、零售與電子商務等)以及地區進行細分。所有細分市場的規模和預測均以美元(USD)計價。
全球數據標註工具市場趨勢及洞察
人工智慧/機器學習技術正在各行業中廣泛應用。
人工智慧在企業中的應用意味著標註品質如今直接影響營收。 Target 在產品內容審核方面實現了 96% 的自動化率和 99% 的準確率,並將標註準確率與電商通路轉換率的提升緊密聯繫起來。 Scale AI 的營收預計將在 2024 年達到 8.7 億美元,並在 2025 年達到 20 億美元,這表明對大規模多模態資料集的需求正在改變資料標註工具市場。像 Inscribe 這樣的金融服務公司透過使用專家標註的資料訓練文件檢驗模型,將詐欺篩選所需時間縮短了 20 倍。隨著各行業向基礎模型的轉變,標註平台正日益成為戰略基礎設施,而不僅僅是戰術性供應商。
自動駕駛汽車研發的激增
每個專案都正從研發階段的試點計畫逐步推進到商業部署,這需要詳細的3D標註和感測器融合數據。特斯拉位於布法羅、帕洛阿爾托和德雷珀的中心每天處理數千個影片片段,用於訓練其全自動駕駛軟體,這充分展現了這項工作的規模和精度。 Waymo的開放資料集包含1,200萬個雷射雷達資料點和990萬個由訓練有素的標註員精心整理的攝影機標註。像Scale AI這樣的供應商提供的汽車數據引擎,將2D和3D標註與持續學習循環相結合,顯示領域專業知識比通用功能更為重要。
熟練標註員短缺
從雷射雷達點雲到X光影像序列,複雜的應用場景需要數月的培訓,導致更高的工資和更長的專案週期。特斯拉的多站點標註員網路凸顯了運作環境所需的規模。在群眾外包平台上保持品質非常困難,迫使公司要麼組建內部團隊,要麼向專業供應商支付高昂的費用。
細分市場分析
預計到2025年,軟體平台將維持50.12%的數據標註工具市場佔有率,鞏固其作為企業擴展內部工作流程的「首選」地位。然而,服務業預計將以18.12%的複合年成長率成長,顯示當專案需要合規性和專業知識時,對託管解決方案的需求日益成長。 CloudFactory擁有7,000名分析師,每天為一家大型零售商處理5萬個標籤,這一事實凸顯了服務公司如今所擁有的強大處理能力。
這一服務市場的快速成長反映了一種策略轉變。越來越多的企業將包括人員管理、品質保證和合規性在內的整個標註流程外包給像Sama這樣的合作夥伴公司。 Sama的客戶滿意度高達99%,並擁有符合ISO標準的審計追蹤記錄。這些夥伴關係正在催生一種混合採購模式,客戶既購買許可證又購買處理能力,模糊了整個數據標註工具市場中傳統平台和服務之間的界限。
到2025年,影像處理仍將佔據數據標註工具市場35.74%的佔有率,這主要得益於零售、安防和醫療保健等行業的視覺項目。然而,受自動駕駛、太空運算和工業模擬等需求的推動,3D/點雲端領域正以22.45%的複合年成長率快速成長。高通、蘋果和谷歌等公司持續申請與點雲壓縮和基於體素的地圖繪製相關的專利,進一步印證了該領域的技術發展勢頭強勁。
蘋果公司獲得的樓層平面圖產生專利展示了3D標籤如何實現擴增實境(AR)導航中的即時空間感知。由於該領域的複雜性,擁有專有工具的供應商具有優勢;隨著需求從2D空間轉向立體空間,技術領先的企業有望擴大收入。
區域分析
預計到2025年,北美將佔全球收入的41.10%,這得益於充裕的創業投資、領先科技公司的研發投入以及成熟的基本客群。 Scale AI 8.7億美元的營收凸顯了該地區強勁的需求,而Meta公司143億美元的投資也進一步印證了這一點,該投資旨在保障關鍵數據基礎設施的安全。儘管由於技能短缺和工資上漲,一些項目正在轉移到海外,但數據主權法規將高風險工作負載限制在國內,維持了高價位。
預計到2031年,亞太地區的複合年成長率將達到17.86%,超過其他所有地區。中國國家發展和改革委員會已正式製定了標註產業發展藍圖,目標是實現20%的年成長率,並規範人工智慧訓練工作。這刺激了本地語言、多模態和3D資料集的供需。憑藉區域成本優勢、豐富的人才儲備和加速發展的人工智慧,預計到2030年,亞洲人工智慧相關收入將接近3000億美元,該地區將在產能擴張中發揮關鍵作用。
在歐洲,受GDPR和即將訂定的人工智慧立法推動,對可審計且無偏見的資料集的需求日益成長,市場呈現穩步成長態勢。像Brighter AI這樣的供應商為德國鐵路營運商Deutsche Bahn提供符合GDPR標準的影片匿名化服務,凸顯了在以隱私為先的環境下,垂直細分市場的發展。中東和非洲正在崛起為新的處理能力中心。阿拉伯聯合大公國在肯亞的資料中心投資表明,一個新的「南南走廊」正在形成,用於標註服務。南美洲是一個規模雖小但成長迅速的叢集,這得益於對多語言自然語言處理和金融科技投資日益成長的需求。
其他好處:
- Excel格式的市場預測(ME)表
- 3個月的分析師支持
目錄
第1章:引言
- 研究假設和市場定義
- 調查範圍
第2章:調查方法
第3章執行摘要
第4章 市場狀況
- 市場概覽
- 市場促進因素
- 人工智慧/機器學習技術的應用正在各行業不斷擴展。
- 自動駕駛汽車的研發正在蓬勃發展。
- 對醫療影像人工智慧的需求正在擴大。
- 混合工具對於合成資料工作流程至關重要。
- 監理機關推廣可審計註釋
- 對話式人工智慧和虛擬助理的迅速普及
- 市場限制因素
- 熟練標註員短缺
- 人工貼標籤成本高、耗時長。
- 基於數據主權的離岸勞工限制
- 開放原始碼自動標註工具正在侵蝕平台收入。
- 價值鏈分析
- 重要法規結構的評估
- 技術展望
- 波特五力模型
- 對關鍵相關人員的影響評估
- 主要用例和案例研究
- 宏觀經濟因素對市場的影響
- 投資分析
第5章 市場規模與成長預測
- 按組件
- 軟體平台
- 服務
- 類型
- 文字
- 影像
- 影片
- 聲音的
- 3D/點雲
- 標註方法
- 手動的
- 有兼職教師空缺
- 自動的
- 部署模式
- 雲
- 現場
- 混合
- 按最終用戶行業分類
- 資訊科技/通訊
- BFSI
- 零售與電子商務
- 醫療保健和生命科學
- 汽車和運輸業
- 政府/公共部門
- 其他
- 按地區
- 北美洲
- 美國
- 加拿大
- 墨西哥
- 南美洲
- 巴西
- 阿根廷
- 其他南美國家
- 歐洲
- 英國
- 德國
- 法國
- 義大利
- 西班牙
- 北歐的
- 其他歐洲國家
- 中東和非洲
- GCC
- 以色列
- 南非
- 其他中東和非洲國家
- 亞太地區
- 中國
- 印度
- 日本
- 韓國
- ASEAN
- 澳洲
- 紐西蘭
- 其他亞太國家
- 北美洲
第6章 競爭情勢
- 市場集中度
- 策略趨勢
- 市佔率分析
- 公司簡介
- Appen Ltd
- TELUS International AI Inc
- Scale AI Inc
- Labelbox Inc
- iMerit Technology Services
- SenseTime Group Ltd
- CloudFactory Ltd
- SuperAnnotate Inc
- Kili Technology SAS
- Cogito Tech LLC
- Keymakr Inc
- Sama Inc
- Hive Data Inc
- Alegion Inc
- DefinedCrowd Corp
- Clickworker GmbH
- Diffgram Inc
- TaskUs Inc
- Globalme Localization Inc
- Datatang Tech Co
第7章 市場機會與未來展望
According to Mordor Intelligence, the data annotation tools market size is expected to grow from USD 2.32 billion in 2025 to USD 3.07 billion in 2026 and is forecast to reach USD 12.42 billion by 2031 at 32.27% CAGR over 2026-2031.
This report is Segmented by Component (Software Platforms, and Services), Data Type (Text, Image, and More), Annotation Type (Manual, Semi-Supervised, and More), Deployment Mode (Cloud, On-Premise, and Hybrid), End-User Industry (IT and Telecom, BFSI, Retail and E-Commerce, and More), and Geography. The Market Sizes and Forecasts are Provided in Terms of Value (USD) for all the Above Segments.
Global Data Annotation Tools Market Trends and Insights
Growing adoption of AI/ML across industries
Enterprise AI roll-outs now link annotation quality directly to revenue impact. Target reached 96% automation with 99% accuracy in product-content auditing, translating labeling precision into higher conversion on its e-commerce channels. Scale AI's revenue climbed to USD 870 million in 2024 and is tracking USD 2 billion in 2025, illustrating how demand for massive multimodal data sets is reshaping the data annotation tools market. Financial-services players such as Inscribe cut fraud review time twenty-fold by training document-verification models on expertly labeled data. The pivot toward foundation models across sectors positions annotation platforms as strategic infrastructure rather than tactical vendors.
Surge in autonomous-vehicle development
Programs have advanced from R&D pilots to commercial deployment, requiring granular 3-D labeling and sensor-fusion data. Tesla's Buffalo, Palo Alto, and Draper centers process thousands of clips daily to train Full Self-Driving software, illustrating the scale and sensitivity of the workload. Waymo's open set contains 12 million LiDAR and 9.9 million camera annotations curated by trained labelers. Providers such as Scale AI supply automotive data engines that pair 2-D and 3-D labeling with continuous-learning loops, demonstrating that domain expertise trumps generic capabilities.
Shortage of skilled annotators
Complex use cases-from LiDAR point clouds to radiology series-require months of training, pushing wages up and elongating project timelines. Tesla's multi-site annotator workforce underscores the scale needed for production environments. Crowdsourcing portals struggle to maintain quality, forcing enterprises to create in-house teams or pay premium rates to specialized vendors.
Other drivers and restraints analyzed in the detailed report include:
- Expanding medical-imaging AI demand
- Synthetic-data workflows need hybrid tools
- High cost and time of manual labeling
For complete list of drivers and restraints, kindly check the Table Of Contents.
Segment Analysis
Software platforms retained 50.12% share of the data annotation tools market in 2025, cementing their role as the first stop for enterprises scaling internal workflows. Yet services are forecast to climb at an 18.12% CAGR, signaling rising preference for managed solutions when projects demand regulatory compliance or specialized expertise. CloudFactory's 7,000-person analyst network processing 50,000 daily labels for retail majors highlights the depth of capacity service firms now command.
The services boom reflects a strategic shift. Enterprises increasingly outsource entire labeling pipelines-including workforce management, quality assurance, and compliance-to partners such as Sama, which reports 99% client acceptance and ISO-aligned audit trails. These partnerships create a blended procurement pattern in which customers purchase both licenses and capacity, blurring historical platform-service lines across the data annotation tools market.
Images still held a 35.74% slice of the data annotation tools market share in 2025, underpinned by retail, security, and healthcare vision projects. However, the 3-D/point-cloud segment is expanding at 22.45% CAGR, catalyzed by autonomous driving, spatial computing, and industrial simulation needs. Qualcomm, Apple, and Google continue to file patents for point-cloud compression and voxel-based mapping, confirming technological momentum.
Apple's floor-plan generation patent shows how 3-D labeling unlocks real-time spatial understanding for augmented-reality navigation. The segment's complexity favors providers with proprietary tooling, positioning advanced players to consolidate revenue as demand shifts from 2-D to volumetric contexts.
Complete Report Scope:
- By Component
- Software Platforms
- Services
- By Data Type
- Text
- Image
- Video
- Audio
- 3D/Point Cloud
- By Annotation Method
- Manual
- Semi-Supervised
- Automatic
- By Deployment Mode
- Cloud
- On-Premise
- Hybrid
- By End-user Industry
- IT and Telecom
- BFSI
- Retail and E-commerce
- Healthcare and Life Sciences
- Automotive and Transportation
- Government and Public Sector
- Others
- By Geography
- North America
- United States
- Canada
- Mexico
- South America
- Brazil
- Argentina
- Rest of South America
- Europe
- United Kingdom
- Germany
- France
- Italy
- Spain
- Nordics
- Rest of Europe
- Middle East and Africa
- GCC
- Israel
- South Africa
- Rest of Middle East and Africa
- Asia-Pacific
- China
- India
- Japan
- South Korea
- ASEAN
- Australia
- New Zealand
- Rest of Asia-Pacific
- North America
Geography Analysis
North America posted 41.10% of worldwide revenue in 2025, anchored by deep venture capital pools, big-tech R&D, and a mature buyer base. Scale AI's USD 870 million revenue underscores regional demand intensity and explains Meta's USD 14.3 billion stake aimed at locking down critical data infrastructure. Skills shortages and wage inflation are nudging some projects offshore, yet data-sovereignty rules keep high-stakes workloads onshore, sustaining premium pricing.
Asia-Pacific is set to outpace all regions with an 17.86% CAGR to 2031. China's National Development and Reform Commission has formalized a labeling-industry roadmap targeting 20% growth per year and standardized AI training professions, catalyzing both supply and demand in local language, multimodal, and 3-D datasets. Regional cost advantages, vast talent pools, and accelerated AI adoption-Asia's AI revenue could near USD 300 billion in 2030-make the region pivotal for capacity expansion.
Europe exhibits steady growth as GDPR and forthcoming AI-Act rules elevate requirements for auditable, bias-controlled datasets. Providers such as Brighter AI deliver GDPR-compliant video anonymization for rail operator Deutsche Bahn, revealing vertical niches within privacy-first environments. Middle East and Africa are emerging capacity nodes; the UAE's data-center investments in Kenya point to a new South-South corridor for annotation services. South America remains a smaller yet growing cluster, buoyed by multilingual NLP demand and rising fintech investment.
- Appen Ltd
- TELUS International AI Inc
- Scale AI Inc
- Labelbox Inc
- iMerit Technology Services
- SenseTime Group Ltd
- CloudFactory Ltd
- SuperAnnotate Inc
- Kili Technology SAS
- Cogito Tech LLC
- Keymakr Inc
- Sama Inc
- Hive Data Inc
- Alegion Inc
- DefinedCrowd Corp
- Clickworker GmbH
- Diffgram Inc
- TaskUs Inc
- Globalme Localization Inc
- Datatang Tech Co
Additional Benefits:
- The market estimate (ME) sheet in Excel format
- 3 months of analyst support
TABLE OF CONTENTS
1 INTRODUCTION
- 1.1 Study Assumptions and Market Definition
- 1.2 Scope of the Study
2 RESEARCH METHODOLOGY
3 EXECUTIVE SUMMARY
4 MARKET LANDSCAPE
- 4.1 Market Overview
- 4.2 Market Drivers
- 4.2.1 Growing adoption of AI/ML across industries
- 4.2.2 Surge in autonomous-vehicle development
- 4.2.3 Expanding medical-imaging AI demand
- 4.2.4 Synthetic-data workflows need hybrid tools
- 4.2.5 Regulatory push for auditable annotation
- 4.2.6 Rapid adoption of conversational AI and virtual assistants
- 4.3 Market Restraints
- 4.3.1 Shortage of skilled annotators
- 4.3.2 High cost and time of manual labeling
- 4.3.3 Data-sovereignty limits on offshore labor
- 4.3.4 Open-source auto-label tools eroding platform revenues
- 4.4 Value Chain Analysis
- 4.5 Valuation of Critical Regulatory Framework
- 4.6 Technological Outlook
- 4.7 Porter's Five Forces
- 4.7.1 Bargaining Power of Suppliers
- 4.7.2 Bargaining Power of Buyers
- 4.7.3 Threat of New Entrants
- 4.7.4 Threat of Substitutes
- 4.7.5 Competitive Rivalry
- 4.8 Impact Assessment of Key Stakeholders
- 4.9 Key Use Cases and Case Studies
- 4.10 Impact on Macroeconomic Factors of the Market
- 4.11 Investment Analysis
5 MARKET SIZE AND GROWTH FORECAST (VALUE)
- 5.1 By Component
- 5.1.1 Software Platforms
- 5.1.2 Services
- 5.2 By Data Type
- 5.2.1 Text
- 5.2.2 Image
- 5.2.3 Video
- 5.2.4 Audio
- 5.2.5 3D/Point Cloud
- 5.3 By Annotation Method
- 5.3.1 Manual
- 5.3.2 Semi-Supervised
- 5.3.3 Automatic
- 5.4 By Deployment Mode
- 5.4.1 Cloud
- 5.4.2 On-Premise
- 5.4.3 Hybrid
- 5.5 By End-user Industry
- 5.5.1 IT and Telecom
- 5.5.2 BFSI
- 5.5.3 Retail and E-commerce
- 5.5.4 Healthcare and Life Sciences
- 5.5.5 Automotive and Transportation
- 5.5.6 Government and Public Sector
- 5.5.7 Others
- 5.6 By Geography
- 5.6.1 North America
- 5.6.1.1 United States
- 5.6.1.2 Canada
- 5.6.1.3 Mexico
- 5.6.2 South America
- 5.6.2.1 Brazil
- 5.6.2.2 Argentina
- 5.6.2.3 Rest of South America
- 5.6.3 Europe
- 5.6.3.1 United Kingdom
- 5.6.3.2 Germany
- 5.6.3.3 France
- 5.6.3.4 Italy
- 5.6.3.5 Spain
- 5.6.3.6 Nordics
- 5.6.3.7 Rest of Europe
- 5.6.4 Middle East and Africa
- 5.6.4.1 GCC
- 5.6.4.2 Israel
- 5.6.4.3 South Africa
- 5.6.4.4 Rest of Middle East and Africa
- 5.6.5 Asia-Pacific
- 5.6.5.1 China
- 5.6.5.2 India
- 5.6.5.3 Japan
- 5.6.5.4 South Korea
- 5.6.5.5 ASEAN
- 5.6.5.6 Australia
- 5.6.5.7 New Zealand
- 5.6.5.8 Rest of Asia-Pacific
- 5.6.1 North America
6 COMPETITIVE LANDSCAPE
- 6.1 Market Concentration
- 6.2 Strategic Moves
- 6.3 Market Share Analysis
- 6.4 Company Profiles (includes Global level Overview, Market level overview, Core Segments, Financials as available, Strategic Information, Market Rank/Share for key companies, Products and Services, and Recent Developments)
- 6.4.1 Appen Ltd
- 6.4.2 TELUS International AI Inc
- 6.4.3 Scale AI Inc
- 6.4.4 Labelbox Inc
- 6.4.5 iMerit Technology Services
- 6.4.6 SenseTime Group Ltd
- 6.4.7 CloudFactory Ltd
- 6.4.8 SuperAnnotate Inc
- 6.4.9 Kili Technology SAS
- 6.4.10 Cogito Tech LLC
- 6.4.11 Keymakr Inc
- 6.4.12 Sama Inc
- 6.4.13 Hive Data Inc
- 6.4.14 Alegion Inc
- 6.4.15 DefinedCrowd Corp
- 6.4.16 Clickworker GmbH
- 6.4.17 Diffgram Inc
- 6.4.18 TaskUs Inc
- 6.4.19 Globalme Localization Inc
- 6.4.20 Datatang Tech Co
7 MARKET OPPORTUNITIES AND FUTURE OUTLOOK
- 7.1 White-space and Unmet-need Assessment

 模型檢驗與自動化市場規模、佔有率及成長分析:按組件、部署模式、應用、最終用戶和地區分類 - 產業預測,2026-2033 年
 全球數據標註工具市場規模、佔有率、趨勢和成長分析報告(2026-2034)
 文本標註工具市場規模、佔有率和成長分析:按組件、部署模式、標註類型、最終用戶、應用和地區分類-2026-2033年產業預測
 資料標註和註釋市場預測至2034年-按組件、資料類型、註釋類型、技術、應用、最終使用者和地區分類的全球分析
 數據標註與標記市場 - 全球預測,2026-2032 年數據標註工具市場-全球市場預測(2026-2032年)資料標註和標記服務市場預測-全球分析(按組件、資料類型、標註類型、採購類型、應用、使用案例和地區分類)-2034年
 2026-2030年全球數據標註工具市場
 2026年全球模型檢驗平台市場報告2026年全球數據標註與標記市場報告