


 |
市場調查報告書
商品編碼
2119818
中國銅市場:市場佔有率分析、產業趨勢與統計及成長預測(2026-2031年)China Copper - Market Share Analysis, Industry Trends & Statistics, Growth Forecasts (2026 - 2031) |
||||||

※ 本網頁內容可能與最新版本有所差異。詳細情況請與我們聯繫。
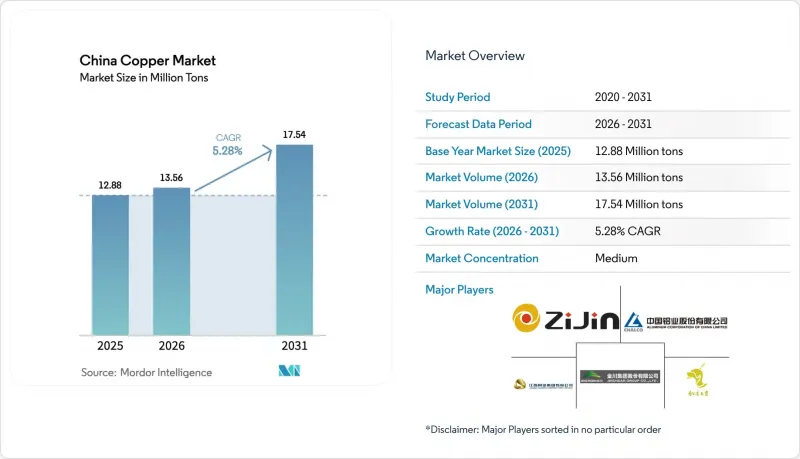
根據 Mordor Intelligence 估計,2026 年中國銅市場規模將達到 1,356 萬噸,高於 2025 年的 1,288 萬噸,預計到 2031 年將達到 1,754 萬噸,2026 年至 2031 年的複合年成長率為 5.28%。
本報告按原料(原生礦石和再生材料)和終端用戶行業(汽車和重型機械、建築、電氣和電子、工業以及其他終端用戶行業(消費品、醫療設備等))進行分類。市場預測以數量(噸)為單位。
中國銅市場趨勢與洞察
可再生能源和電網擴張導致需求激增
隨著全國範圍內向清潔能源發電轉型,銅在中國電力基礎設施建設中扮演核心角色。新建特高壓輸電線路每公里約需6噸精煉銅,截至2024年4月,已有38條連接可再生能源豐富的西部沙漠地區與沿海電力消耗中心的輸電線路投入運作。光是目前正在興建中的甘浙±800千伏輸電線路每年就將消耗超過1.4萬噸銅,輸送360億千瓦時的電力,其中超過一半來自風能和太陽能發電廠。到2030年,太陽能和陸上風電裝置容量總合將達到1200吉瓦,屆時所需的電纜、逆變器、變壓器和開關設備等設備所需的銅量將遠遠超過傳統需求模型的預測。國家多年規劃強制要求對電網進行投資,這有助於保護中國的銅市場免受短期建設低迷的影響,並支撐精煉銅的最低價格。
國內電動車和電池製造快速擴張
平均而言,一輛電池式電動車(BEV)需要使用近70公斤銅,其中包括線束、轉子和電池組連接器。儘管產業藍圖計畫透過提高設計效率,到2030年將銅的使用量減半至38公斤,但由於產量激增,銅的絕對使用量預計仍將增加。 2023年,中國生產了9.587億輛汽車,年增35.8%。此外,上海、廣州和常州的電動車專用組裝也持續擴張。充電網路的擴展進一步刺激了需求。充電容量每增加1兆瓦,導體、開關設備和溫度控管迴路中就需要使用20至40噸銅。汽車製造商供應鏈的垂直整合確保了大部分銅的採購和加工都在國內進行,這使得冶煉廠能夠獲得長期訂單的透明度。
對冶煉廠的二氧化硫和碳排放實施更嚴格的限制。
修訂後的環境標準將初級冶煉廠的二氧化硫(SO2)排放量限制在每小時6.3磅,並收緊了顆粒物和鉛的排放標準。這迫使營運商投入大量資金維修洗滌器和靜電除塵器。省級政府也對石油焦的燃燒進行了監管,每年減少1,200萬噸燃料進口,並強制改用更清潔的天然氣。兩年的合規期限使中型冶煉廠面臨短期減產的風險,可能導致國內陰極板供應在消費成長之際下降。政府對新增產能的配額制度要求申請者持有上游礦山的股份,這延緩了專案核准,並將市場力量集中在現有國有企業手中。
細分市場分析
2025年,得益於江西銅業和紫金礦業穩定的礦石供應,以及與智利和秘魯生產商簽訂的長期供應契約,提煉銅佔中國銅市場的84.19%。預計到2031年,中國原銅市場規模將以5.04%的複合年成長率成長,主要得益於特高壓電網專案和電動車電池箔材產能的擴張。儘管規模較小,但再生銅的市佔率預計將以6.35%的複合年成長率成長。這主要得益於2025年1月再生銅進口關稅降至0%,以及一項旨在2025年實現年產40萬噸再生銅的城市級廢銅回收試點計畫的支持。更嚴格的循環經濟法規和不斷上漲的加工成本促使冶煉廠使用廢銅而非精礦,這反過來又透過再生銅的供應分散了整體原料風險。回收公司正在投資自動化拆解生產線,以提高線束和空調管的回收率,並縮小與全新陰極板的品質差距。
其他好處:
- Excel格式的市場預測(ME)表
- 3個月的分析師支持
目錄
第1章:引言
- 研究假設和市場定義
- 調查範圍
第2章:調查方法
第3章執行摘要
第4章 市場狀況
- 市場概覽
- 市場促進因素
- 可再生能源發展和電網擴容導致需求激增。
- 日本電動車和電池製造業快速擴張
- 人工智慧資料中心的普及速度正在加快。
- 政府主導的西部地區基礎設施發展促進工作
- 沿海地區智慧工廠自動化的擴展
- 市場限制因素
- 加強冶煉廠二氧化硫和碳排放的限制
- 供不應求,TC/RC 值低。
- 由於鋁替代,1千伏電纜產業的競爭加劇。
- 價值鏈分析
- 波特五力模型
第5章 市場規模與成長預測
- 來源
- 初級原料(來自礦山)
- 再生原料(回收)
- 按最終用戶行業分類
- 汽車和重型機械
- 建造
- 電氣和電子設備
- 產業
- 其他終端用戶產業(消費品、醫療設備等)
第6章 競爭情勢
- 市場集中度
- 策略趨勢
- 市佔率和排名分析
- 公司簡介
- Aluminum Corporation of China Limited(CHALCO)
- China Daye Non-Ferrous Metals Mining Limited
- CMOC
- Jiangxi Copper Corporation
- Jinchuan Group Co., Ltd.
- MMG Australia Limited
- Tongling Non-ferrous Metals Group Holding Co., Ltd.
- Zijin Mining Group Co., Ltd.
第7章 市場機會與未來展望
According to Mordor Intelligence, China copper market size in 2026 is estimated at 13.56 Million tons, growing from 2025 value of 12.88 Million tons with 2031 projections showing 17.54 Million tons, growing at 5.28% CAGR over 2026-2031.
This report is Segmented by Source (Primary Mine-Derived and Secondary Recycled), End-User Industry (Automotive and Heavy Equipment, Construction, Electrical and Electronics, Industrial, and Other End-User Industries (Consumer Products, Medical Devices, Etc. )). The Market Forecasts are Provided in Terms of Volume (tons).
China Copper Market Trends and Insights
Surging Demand From Renewable Energy and Grid Expansion
A nationwide pivot toward clean-energy generation is placing copper at the heart of China's electrical-infrastructure rollout. Each kilometer of a new ultra high voltage (UHV) line embeds about 6 tons of refined copper, and 38 such lines were already in service by April 2024, linking renewable-rich western deserts to coastal load centers. The ongoing Gansu-Zhejiang +-800 kV link alone consumes over 14,000 tons of copper and transmits 36 Billion kWh annually, more than half stemming from wind and solar plants. Solar and onshore wind capacity, which together target 1,200 GW by 2030, require copper-heavy cabling, inverters, transformers, and switchgear that extend well beyond classical demand models. Because grid investments are locked in through multi-year state plans, they shelter the China Copper market from short-term construction slumps while anchoring floor prices for refined metal.
Rapid Build-out of Domestic EV and Battery Manufacturing
Battery-electric vehicles average close to 70 kg of copper per unit, covering wiring harnesses, rotors, and battery-pack connectors. Even if industry roadmaps halve intensity to 38 kg by 2030 through design efficiencies, absolute tonnage will still rise on surging output. China manufactured 958.7 Million vehicles in 2023, up 35.8% yearly, and continues to scale dedicated assembly lines in Shanghai, Guangzhou, and Changzhou. Charging networks amplify demand: every additional megawatt of charging capacity deploys 20 to 40 tons of copper in conductors, switchgear, and thermal-management loops. Vertical integration inside automakers' supply chains ensures that a large portion of copper sourcing and processing remains domestic, lending visibility to long-term offtake agreements for smelters.
Tightening Sulphur-dioxide and Carbon-emission Caps on Smelters
Updated environmental standards restrict SO2 to 6.3 lb/h and tighten particulate and lead limits for primary smelters, obliging operators to retrofit scrubbers and electrostatic precipitators at high capital cost . Provincial regulators have also curbed petroleum-coke firing, eliminating 12 Million tons of annual fuel imports and forcing a switch to cleaner natural gas. Compliance timelines of two years risk near-term output cuts among mid-tier smelters, lowering domestic cathode supply just as consumption scales. Government quotas on new capacity now require applicants to hold equity stakes in upstream mines, slowing project approvals and concentrating market power among existing state-owned incumbents.
Other drivers and restraints analyzed in the detailed report include:
- Accelerating Deployment of AI-ready Data-centres
- Government-backed Western Region Infrastructure Push
- Persistent Copper-concentrate Deficit and Low TC/RCs
For complete list of drivers and restraints, kindly check the Table Of Contents.
Segment Analysis
Primary copper commanded 84.19% of the China Copper market in 2025 as smelters leveraged consistent ore flows from Jiangxi Copper and Zijin Mining as well as long-term offtake agreements with Chilean and Peruvian producers. The China Copper market size for primary material is expected to track a 5.04% CAGR through 2031, supported by UHV grid projects and electric vehicle (EV) battery-foil expansions. Although smaller, secondary copper is set to gain share at a 6.35% CAGR, helped by a January 2025 tariff cut on recycled-copper imports to 0% and city-level scrap-collection pilots targeting 400,000 tons of annual recycled output by 2025 . Growing circular-economy mandates and rising treatment-charge stress encourage smelters to substitute concentrates with scrap, allowing secondary flows to dilute overall feedstock risk. Recyclers have invested in automated dismantling lines that lift recovery rates on wire harnesses and air-conditioner coils, narrowing the quality gap with virgin cathode.
Complete Report Scope:
- By Source
- Primary (Mine-derived)
- Secondary (Recycled)
- By End-user Industry
- Automotive and Heavy Equipment
- Construction
- Electrical and Electronics
- Industrial
- Other End-user Industries (Consumer Products, Medical Devices, etc.)
List of Companies Covered in this Report:
- Aluminum Corporation of China Limited (CHALCO)
- China Daye Non-Ferrous Metals Mining Limited
- CMOC
- Jiangxi Copper Corporation
- Jinchuan Group Co., Ltd.
- MMG Australia Limited
- Tongling Non-ferrous Metals Group Holding Co., Ltd.
- Zijin Mining Group Co., Ltd.
Additional Benefits:
- The market estimate (ME) sheet in Excel format
- 3 months of analyst support
TABLE OF CONTENTS
1 Introduction
- 1.1 Study Assumptions & Market Definition
- 1.2 Scope of the Study
2 Research Methodology
3 Executive Summary
4 Market Landscape
- 4.1 Market Overview
- 4.2 Market Drivers
- 4.2.1 Surging Demand From Renewable Energy and Grid Expansion
- 4.2.2 Rapid Build-out of Domestic EV and Battery Manufacturing
- 4.2.3 Accelerating Deployment of AI-ready Data-centres
- 4.2.4 Government-backed Western Region Infrastructure Push
- 4.2.5 Upscaling of Smart Factory Automation in Coastal Provinces
- 4.3 Market Restraints
- 4.3.1 Tightening Sulphur-dioxide and Carbon-emission Caps on Smelters
- 4.3.2 Persistent Copper-concentrate Deficit and Low TC/RCs
- 4.3.3 Rising Competition from Aluminium-substitution in 1 kV Cabling
- 4.4 Value Chain Analysis
- 4.5 Porter's Five Forces
- 4.5.1 Threat of New Entrants
- 4.5.2 Bargaining Power of Buyers
- 4.5.3 Bargaining Power of Suppliers
- 4.5.4 Threat of Substitutes
- 4.5.5 Degree of Competition
5 Market Size & Growth Forecasts (Volume)
- 5.1 By Source
- 5.1.1 Primary (Mine-derived)
- 5.1.2 Secondary (Recycled)
- 5.2 By End-user Industry
- 5.2.1 Automotive and Heavy Equipment
- 5.2.2 Construction
- 5.2.3 Electrical and Electronics
- 5.2.4 Industrial
- 5.2.5 Other End-user Industries (Consumer Products, Medical Devices, etc.)
6 Competitive Landscape
- 6.1 Market Concentration
- 6.2 Strategic Moves
- 6.3 Market Share(%)/Ranking Analysis
- 6.4 Company Profiles (includes Global level Overview, Market level overview, Core Segments, Financials as available, Strategic Information, Market Rank/Share, Products & Services, Recent Developments)
- 6.4.1 Aluminum Corporation of China Limited (CHALCO)
- 6.4.2 China Daye Non-Ferrous Metals Mining Limited
- 6.4.3 CMOC
- 6.4.4 Jiangxi Copper Corporation
- 6.4.5 Jinchuan Group Co., Ltd.
- 6.4.6 MMG Australia Limited
- 6.4.7 Tongling Non-ferrous Metals Group Holding Co., Ltd.
- 6.4.8 Zijin Mining Group Co., Ltd.
7 Market Opportunities & Future Outlook
- 7.1 White-space & Unmet-need Assessment
- 7.2 Rising Demand in High-End Applications

 2026-2030年全球銅製品市場
 吡硫翁銅市場:全球市場按產品類型、純度等級、應用和分銷管道分類的預測,2026-2032年
 2034年銅礦開採市場預測-按類型、技術、最終用戶和地區分類的全球分析
 2026-2030年全球銅市場
 銅版印刷紙市場:按類型、應用、包裝、文具、工藝美術、最終用途行業、紙張重量/厚度、價格範圍和地區分類。
 2026-2036年全球航太和國防工業銅需求:
 銅市場規模、佔有率和趨勢分析報告:按類型、產品類型、應用、地區和細分市場分類(2026-2033 年)銅礦開採市場規模、佔有率和趨勢分析報告:按最終用途、地區和細分市場預測(2026-2033 年)
 再生銅:市場佔有率分析、行業趨勢和統計數據、成長預測(2026-2031 年)銅提煉市場:依原料、製程、產品及最終用途分類-2026-2032年全球市場預測