


 |
市場調查報告書
商品編碼
2119767
資料整合:市場佔有率分析、產業趨勢與統計、成長預測(2026-2031)Data Integration - Market Share Analysis, Industry Trends & Statistics, Growth Forecasts (2026 - 2031) |
||||||

※ 本網頁內容可能與最新版本有所差異。詳細情況請與我們聯繫。
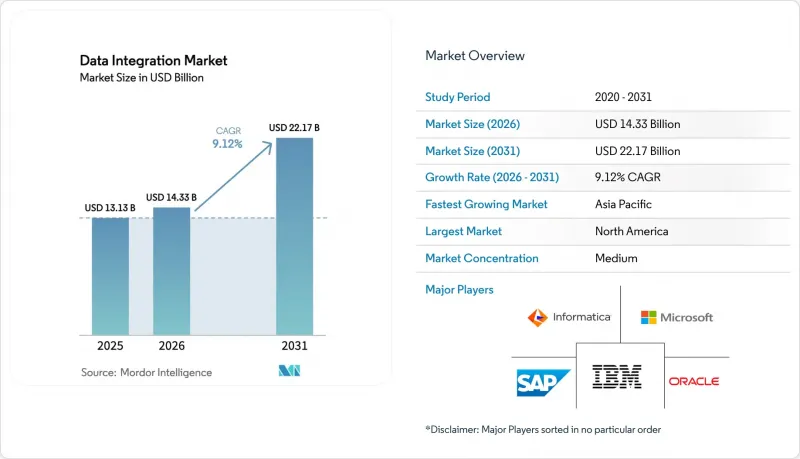
根據 Mordor Intelligence 預測,資料整合市場規模將從 2025 年的 131.3 億美元成長到 2026 年的 143.3 億美元,然後在 2031 年達到 221.7 億美元,2026 年至 2031 年的複合年成長率為 9.12%。
本報告按組件(工具、服務)、部署類型(雲端、本地部署)、企業規模(微企業(1-49名員工)、中小企業(50-249名員工)、其他)、應用(客戶和銷售分析、業務和供應鏈最佳化等)、最終用戶行業(IT和電信、銀行、金融服務和保險、醫療保健和生命科學等)以及地區進行細分。市場預測以美元(USD)為單位。
全球數據整合市場趨勢與洞察
採用「雲端優先」方法實現企業技術棧現代化。
到 2025 年,大多數財富 100 強企業已將其整合工作負載遷移到基於訂閱的雲端服務,從而降低了基礎設施成本並簡化了升級。超過 10 億美元的雲端研發投資推動了「零 ETL」模式的發展,該模式可按需讀取模式,使團隊擺脫了統一的預定義轉換的負擔。 HCLTech 與聯合利華的合作等案例研究表明,採用雲端原生整合可降低 30% 的基礎設施成本。供應商專注於整合資料倉儲和資料湖的「湖屋」設計,Iceberg 和 Delta 格式支援跨平台的開放式檔案儲存。託管式資料湖服務透過自動化 500 多個資料來源的表格維護和格式轉換,進一步加速了雲端原生整合的普及。
從批量 ETL 過渡到即時串流和 CDC
2024年發布的串流反向ETL工具可在數秒內將資料倉儲表與業務系統同步,從而支援即時客戶參與。金融機構整合了其CDC管道,將詐欺偵測時間從數小時縮短至數秒。製造業企業利用物聯網資料流預測機器故障,將意外停機時間減少了40%。 「零ETL」的概念應運而生,透過在門市之間直接傳輸原始資料並在查詢執行時應用轉換,顯著降低了延遲和營運成本。雲端平台透過「動態表」和「增量即時表」等聲明式串流服務簡化了編配。
先進整合架構人才短缺
到2025年,76%的公司表示人工智慧和資料工程人才嚴重短缺,導致實施延遲和諮詢成本增加。安全、人脈和資料相關技能的缺口均超過35%,迫使資訊長們投資於技能發展專案和託管服務合作夥伴關係。調查預測,到2026年,這種人才短缺將導致全球生產力損失5.5兆美元。歐洲製造商尤其指出自動化和綠色技術技能短缺,導致中型工廠的專案停滯不前。儘管即時流、語意層和邊緣管道具有明顯的投資回報率潛力,但這些限制減緩了這些技術的應用。
細分市場分析
隨著各組織尋求雲端遷移、串流架構和合規框架的專家指導,業務收益到2031年將以14.08%的複合年成長率成長。到了2025年,工具細分市場仍佔數據整合市場的63.85%,這反映了ETL、CDC和虛擬化平台的普及。隨著語義層和生成式人工智慧的採用,專業服務激增,其中客製化的管治和符合倫理的設計至關重要。由於全天候監控和多重雲端管道的自動化最佳化,託管服務廣受歡迎。
在工具領域,用於大量處理工作負載的 ETL/ELT 套件仍然是主要的投資目標,而用於即時分析的 CDC 引擎的應用也日益普及。串流媒體平台已成為物聯網場景中不可或缺的一部分,隨著將存取與儲存解耦的網狀架構的普及,資料虛擬化得到了擴展。人工智慧模型對可靠輸入的需求不斷成長,凸顯了資料品質和主資料管理工具的重要性。技能缺口的擴大進一步增加了對能夠將這些多樣化產品整合為整合解決方案的服務供應商的需求。
混合雲配置的複合年成長率 (CAGR) 為 16.62%,反映了影響資料策略決策的「主權」與「柔軟性」之間的權衡。公共雲端超大規模資料中心業者其彈性擴充性和豐富的原生服務生態系統,維持了最大的市場佔有率。同時,私有雲端在金融和醫療保健等高度監管的環境中繼續佔據主導地位,因為在這些環境中,硬體和網路配置的管理仍然至關重要。
本地部署環境規模雖有所縮小,但仍在持續存在,為傳統大型主機和對延遲敏感的工作負載提供支援。邊緣節點已成為微整合點,在本地處理感測器數據,然後將匯總結果傳輸到中央儲存。隨著越來越多的公司採用網狀架構連接各個領域團隊,同時保持集中式管治,混合雲端環境下的資料整合市場預計將穩定成長。將資料倉儲、資料湖和邊緣叢集整合到平台中,加速了這一趨勢。
區域分析
預計到2025年,北美將佔全球收入的38.35%,這得益於其對雲端運算的早期應用、強勁的創業融資以及密集的系統整合商生態系統。聯邦基礎設施項目,包括一項650億美元的電網現代化計劃,正在進一步推動對即時能源數據整合的需求。加拿大也呈現類似的趨勢,在投資醫療保健和金融服務現代化的同時,也正在推動其跨國合規工作。
亞太地區以17.78%的複合年成長率 (CAGR) 實現最高增速,這主要得益於超大規模資料中心的部署和大規模公共部門數位化專案的推進。中國累計4,420億美元用於智慧電網升級,而智慧電網升級需要流數據平台;印度則投入120億美元(約合120億印度盧比)用於建立具備核心分析能力的基礎設施。日本1550億美元的數位基礎設施預算進一步擴大了其在數據整合市場的潛在基本客群。然而,各國的數據在地化法律促使混合架構的出現,即先在國內處理數據,然後再進行選擇性聚合。
儘管存在隱私法規,歐洲的數據整合市場仍保持強勁成長動能。歐盟委員會計劃在2030年投資5,840億歐元(約6,698.7億美元)用於智慧電網建設,這將推動將可再生能源發電數據與消費者需量反應相結合的整合項目。銀行業為遵守DORA法規而增加的支出大幅成長,而符合GDPR標準的邊緣解決方案則使企業能夠在本地進行資料分析。總體而言,隨著主權雲端和開放標準緩解監管方面的阻力,該地區的資料整合市場規模預計將穩步擴大。
其他好處:
- Excel格式的市場預測(ME)表
- 3個月的分析師支持
目錄
第1章:引言
- 研究假設和市場定義
- 調查範圍
第2章:調查方法
第3章執行摘要
第4章 市場狀況
- 市場概覽
- 市場促進因素
- 採用「雲端優先」方法實現企業技術棧現代化。
- 從批量 ETL 過渡到即時串流和 CDC
- 面向公民開發者的自助式低程式碼資料管道
- 資料處理歷程和可審計性的監管進展(例如,DORA、HIPAA 21世紀改革)
- 生成式人工智慧賦能語意資料層的出現(媒體報道不足)
- 透過邊緣和感測器內分析創建微整合節點(媒體報告不足)
- 市場限制因素
- 先進整合架構人才短缺
- 從雲端發送和傳輸資料的成本不斷上升。
- 有關數據主權的法規正在擾亂多個地區的管道(這一點尚未得到充分報告)。
- 由於專有 iPaaS 生態系統(報告不足)而導致的供應商鎖定風險
- 價值供應鏈分析
- 監理情勢
- 技術展望
- 波特五力分析
- 影響市場的宏觀經濟因素
- 投資分析
第5章 市場規模與成長預測
- 按組件
- 工具
- ETL 和 ELT 平台
- 資料複製與美國疾病管制與預防中心
- 資料虛擬化
- 串流媒體整合
- 數據品質和主數據管理工具
- 服務
- 專業服務
- 託管服務
- 工具
- 不同的發展
- 雲
- 公共雲端
- 私有雲端
- 混合雲端
- 現場
- 雲
- 按公司規模
- 微企業(1-49名員工)
- 小規模企業(50-249名員工)
- 中型企業(250-999人)
- 大型公司(超過1000人)
- 透過使用
- 客戶和銷售分析
- 最佳化營運和供應鏈
- 市場分析
- 財務和風險管理
- 人力資源分析
- 產品與研發會議的整合
- 其他
- 按最終用戶行業分類
- IT/通訊
- BFSI
- 醫療保健和生命科學
- 製造業
- 零售與電子商務
- 政府/國防
- 能源公用事業
- 媒體與娛樂
- 其他
- 按地區
- 北美洲
- 美國
- 加拿大
- 墨西哥
- 南美洲
- 巴西
- 阿根廷
- 其他南美國家
- 歐洲
- 德國
- 英國
- 法國
- 義大利
- 西班牙
- 北歐的
- 比荷盧經濟聯盟
- 俄羅斯
- 其他歐洲國家
- 亞太地區
- 中國
- 印度
- 日本
- 韓國
- ASEAN
- 其他亞太國家
- 中東和非洲
- 中東
- GCC
- 土耳其
- 其他中東國家
- 非洲
- 南非
- 奈及利亞
- 埃及
- 其他非洲國家
- 中東
- 北美洲
第6章 競爭情勢
- 市場集中度
- 策略趨勢
- 市佔率分析
- 公司簡介
- Informatica Inc.
- IBM Corporation
- Microsoft Corporation
- SAP SE
- Oracle Corporation
- SAS Institute Inc.
- Denodo Technologies
- TIBCO Software Inc.
- QlikTech International AB
- Precisely
- Talend SA
- Fivetran Inc.
- Boomi LP
- SnapLogic Inc.
- MuleSoft LLC(Salesforce)
- Matillion Ltd
- Amazon Web Services, Inc.
- Google LLC
- HVR Software BV
- Airbyte Inc.
- Celigo Inc.
- Tray.io Inc.
- Alteryx Inc.
- SyncMatters Ltd.
- Hitachi Vantara LLC
第7章 市場機會與未來展望
According to Mordor Intelligence, the data integration market size is expected to grow from USD 13.13 billion in 2025 to USD 14.33 billion in 2026 and is forecast to reach USD 22.17 billion by 2031 at 9.12% CAGR over 2026-2031.
This report is Segmented Component (Tools, Services), Deployment (Cloud, On-Premise), Enterprise Size (Micro Enterprises (1-49), Small Enterprises (50-249), and More), Application (Customer and Sales Analytics, Operations and Supply-Chain Optimisation, and More), End-User Vertical (IT and Telecom, BFSI, Healthcare and Life Sciences, and More), and Geography. The Market Forecasts are Provided in Terms of Value (USD).
Global Data Integration Market Trends and Insights
Cloud-first modernisation of enterprise stacks
By 2025, most Fortune 100 firms had shifted integration workloads into subscription cloud services, cutting infrastructure costs and simplifying upgrades. Cloud R&D investments exceeding USD 1 billion spurred zero-ETL patterns that read schemas on demand, freeing teams from rigid pre-defined transformations. Case studies such as HCLTech's engagement with Unilever showed 30% infrastructure savings after embracing cloud-native integration. Vendors converged on lakehouse designs that unite warehouses and data lakes, with Iceberg and Delta formats enabling open file storage across platforms. Managed lake services further accelerated adoption by automating table maintenance and format conversion for more than 500 sources.
Shift from batch ETL to real-time streaming and CDC
Streaming reverse ETL tools launched in 2024 synchronised data warehouse tables to operational systems within seconds, supporting live customer engagement. Financial institutions integrated CDC pipelines that cut fraud detection windows from hours to seconds. Manufacturing firms applied IoT streams to predict machine failure, reducing unplanned downtime by 40%. Zero-ETL concepts emerged, moving raw data directly between stores while applying transformations at query time, slashing latency and operating cost. Cloud platforms simplified orchestration via declarative streaming services such as Dynamic Tables and Delta Live Tables.
Talent shortage in advanced integration architectures
In 2025, 76% of enterprises reported severe shortages in AI and data engineering talent, delaying deployments and inflating consulting spend. Security, networking, and data skills each showed gaps exceeding 35%, forcing CIOs to fund upskilling programs and managed services partnerships. Surveys projected the talent deficit could drain USD 5.5 trillion from global output by 2026. European manufacturers highlighted automation and green-tech skills as especially scarce, leading to project backlogs across mid-sized plants. These constraints slowed the rollout of real-time streaming, semantic layers, and edge pipelines despite clear ROI potential.
Other drivers and restraints analyzed in the detailed report include:
- Regulatory push for data lineage and auditability
- Emergence of generative-AI-ready semantic data layers
- Data-sovereignty restrictions splintering multi-region pipelines
For complete list of drivers and restraints, kindly check the Table Of Contents.
Segment Analysis
Services revenue expanded at a 14.08% CAGR through 2031 as organizations sought expert guidance on cloud migrations, streaming architectures, and compliance frameworks. The tools category still held 63.85% of the data integration market in 2025, reflecting entrenched ETL, CDC, and virtualisation platforms. Professional services surged around semantic layer rollouts and generative-AI integration, where tailored governance and ethical design were vital. Managed services gained popularity for 24/7 monitoring and automated optimisation of multi-cloud pipelines.
Within tools, ETL/ELT suites remained staple investments for batch workloads, while CDC engines gained momentum for instant analytics. Streaming platforms became critical in IoT scenarios, and data virtualisation rose alongside mesh architectures that decouple access from storage. Data quality and master data management tools found renewed relevance as AI models demanded trusted inputs. The widening skills gap further amplified demand for service providers who can orchestrate these diverse products into cohesive solutions.
Hybrid configurations recorded a 16.62% CAGR, reflecting the trade-off between sovereignty and flexibility that dominates data strategy decisions. Public cloud retained the largest overall share because hyperscalers offered elastic scale and a rich ecosystem of native services. Private clouds persisted in highly regulated environments such as finance and healthcare, where control over hardware and network configurations remained essential.
On-premise estates shrank but did not disappear, supporting legacy mainframes and latency-sensitive workloads. Edge nodes emerged as micro-integration points, processing sensor data locally before forwarding summaries to central stores. The data integration market size for hybrid-cloud deployments is forecast to expand steadily as more firms adopt mesh patterns that federate domain teams while sustaining centralized governance. Adoption accelerated as platforms introduced single control planes spanning warehouses, lakes, and edge clusters.
Complete Report Scope:
- By Component
- Tools
- ETL and ELT Platforms
- Data Replication and CDC
- Data Virtualisation
- Streaming Integration
- Data Quality and MDM Tools
- Services
- Professional Services
- Managed Services
- Tools
- By Deployment
- Cloud
- Public Cloud
- Private Cloud
- Hybrid Cloud
- On-Premise
- Cloud
- By Enterprise Size
- Micro Enterprises (1-49)
- Small Enterprises (50-249)
- Medium Enterprises (250-999)
- Large Enterprises (1,000+)
- By Application
- Customer and Sales Analytics
- Operations and Supply-chain Optimisation
- Marketing Analytics
- Finance and Risk Management
- Human Resources Analytics
- Product and RandD Data Integration
- Others
- By End-user Vertical
- IT and Telecom
- BFSI
- Healthcare and Life Sciences
- Manufacturing
- Retail and E-commerce
- Government and Defense
- Energy and Utilities
- Media and Entertainment
- Others
- By Geography
- North America
- United States
- Canada
- Mexico
- South America
- Brazil
- Argentina
- Rest of South America
- Europe
- Germany
- United Kingdom
- France
- Italy
- Spain
- Nordics
- Benelux
- Russia
- Rest of Europe
- Asia-Pacific
- China
- India
- Japan
- South Korea
- ASEAN
- Rest of Asia-Pacific
- Middle East and Africa
- Middle East
- GCC
- Turkey
- Rest of Middle East
- Africa
- South Africa
- Nigeria
- Egypt
- Rest of Africa
- Middle East
- North America
Geography Analysis
North America held 38.35% of global revenue in 2025 thanks to early cloud adoption, robust venture funding, and a dense ecosystem of system integrators. Federal infrastructure programs, including a USD 65 billion grid modernisation package, drove additional demand for real-time energy data integration. Canada mirrored these patterns, investing in healthcare and financial services modernization while navigating cross-border compliance.
Asia-Pacific delivered the fastest growth at an 17.78% CAGR, fuelled by hyperscale data-center rollouts and large public-sector digitalisation projects. China earmarked USD 442 billion for smart-grid upgrades that require streaming data platforms, while India allocated INR 3.03 trillion (USD 0.012 trillion) to infrastructure that embeds analytics at its core. Japan's USD 155 billion in digital infrastructure budgets further expanded the addressable base for the data integration market. Local data-localisation laws, however, encouraged hybrid architectures that process data in-country before selective aggregation.
Europe showed solid momentum despite privacy rules. The European Commission planned EUR 584 billion (USD 669.87 billion) in smart-grid investments by 2030, spurring integration projects that combine renewable generation data with consumer demand response. DORA compliance spending escalated within banking, while GDPR-aligned edge solutions let enterprises analyse data locally. Overall, the data integration market size for the region is projected to climb steadily as sovereign clouds and open standards mitigate regulatory headwinds.
- Informatica Inc.
- IBM Corporation
- Microsoft Corporation
- SAP SE
- Oracle Corporation
- SAS Institute Inc.
- Denodo Technologies
- TIBCO Software Inc.
- QlikTech International AB
- Precisely
- Talend S.A.
- Fivetran Inc.
- Boomi LP
- SnapLogic Inc.
- MuleSoft LLC (Salesforce)
- Matillion Ltd
- Amazon Web Services, Inc.
- Google LLC
- HVR Software BV
- Airbyte Inc.
- Celigo Inc.
- Tray.io Inc.
- Alteryx Inc.
- SyncMatters Ltd.
- Hitachi Vantara LLC
Additional Benefits:
- The market estimate (ME) sheet in Excel format
- 3 months of analyst support
TABLE OF CONTENTS
1 INTRODUCTION
- 1.1 Study Assumptions and Market Definition
- 1.2 Scope of the Study
2 RESEARCH METHODOLOGY
3 EXECUTIVE SUMMARY
4 MARKET LANDSCAPE
- 4.1 Market Overview
- 4.2 Market Drivers
- 4.2.1 Cloud-first modernisation of enterprise stacks
- 4.2.2 Shift from batch ETL to real-time streaming and CDC
- 4.2.3 Self-service, low-code data pipelines for citizen developers
- 4.2.4 Regulatory push for data lineage and auditability (e.g., DORA, HIPAA 21st Cures)
- 4.2.5 Emergence of generative-AI-ready semantic data layers (under-reported)
- 4.2.6 Edge and in-sensor analytics creating micro-integration nodes (under-reported)
- 4.3 Market Restraints
- 4.3.1 Talent shortage in advanced integration architectures
- 4.3.2 Escalating cloud egress and data-movement costs
- 4.3.3 Data-sovereignty restrictions splintering multi-region pipelines (under-reported)
- 4.3.4 Vendor lock-in risk from proprietary iPaaS ecosystems (under-reported)
- 4.4 Value / Supply-Chain Analysis
- 4.5 Regulatory Landscape
- 4.6 Technological Outlook
- 4.7 Porter's Five Forces Analysis
- 4.7.1 Bargaining Power of Buyers
- 4.7.2 Bargaining Power of Suppliers
- 4.7.3 Threat of New Entrants
- 4.7.4 Threat of Substitutes
- 4.7.5 Intensity of Competitive Rivalry
- 4.8 Macro-Economic Factors Impacting the Market
- 4.9 Investment Analysis
5 MARKET SIZE AND GROWTH FORECASTS (VALUE)
- 5.1 By Component
- 5.1.1 Tools
- 5.1.1.1 ETL and ELT Platforms
- 5.1.1.2 Data Replication and CDC
- 5.1.1.3 Data Virtualisation
- 5.1.1.4 Streaming Integration
- 5.1.1.5 Data Quality and MDM Tools
- 5.1.2 Services
- 5.1.2.1 Professional Services
- 5.1.2.2 Managed Services
- 5.1.1 Tools
- 5.2 By Deployment
- 5.2.1 Cloud
- 5.2.1.1 Public Cloud
- 5.2.1.2 Private Cloud
- 5.2.1.3 Hybrid Cloud
- 5.2.2 On-Premise
- 5.2.1 Cloud
- 5.3 By Enterprise Size
- 5.3.1 Micro Enterprises (1-49)
- 5.3.2 Small Enterprises (50-249)
- 5.3.3 Medium Enterprises (250-999)
- 5.3.4 Large Enterprises (1,000+)
- 5.4 By Application
- 5.4.1 Customer and Sales Analytics
- 5.4.2 Operations and Supply-chain Optimisation
- 5.4.3 Marketing Analytics
- 5.4.4 Finance and Risk Management
- 5.4.5 Human Resources Analytics
- 5.4.6 Product and RandD Data Integration
- 5.4.7 Others
- 5.5 By End-user Vertical
- 5.5.1 IT and Telecom
- 5.5.2 BFSI
- 5.5.3 Healthcare and Life Sciences
- 5.5.4 Manufacturing
- 5.5.5 Retail and E-commerce
- 5.5.6 Government and Defense
- 5.5.7 Energy and Utilities
- 5.5.8 Media and Entertainment
- 5.5.9 Others
- 5.6 By Geography
- 5.6.1 North America
- 5.6.1.1 United States
- 5.6.1.2 Canada
- 5.6.1.3 Mexico
- 5.6.2 South America
- 5.6.2.1 Brazil
- 5.6.2.2 Argentina
- 5.6.2.3 Rest of South America
- 5.6.3 Europe
- 5.6.3.1 Germany
- 5.6.3.2 United Kingdom
- 5.6.3.3 France
- 5.6.3.4 Italy
- 5.6.3.5 Spain
- 5.6.3.6 Nordics
- 5.6.3.7 Benelux
- 5.6.3.8 Russia
- 5.6.3.9 Rest of Europe
- 5.6.4 Asia-Pacific
- 5.6.4.1 China
- 5.6.4.2 India
- 5.6.4.3 Japan
- 5.6.4.4 South Korea
- 5.6.4.5 ASEAN
- 5.6.4.6 Rest of Asia-Pacific
- 5.6.5 Middle East and Africa
- 5.6.5.1 Middle East
- 5.6.5.1.1 GCC
- 5.6.5.1.2 Turkey
- 5.6.5.1.3 Rest of Middle East
- 5.6.5.2 Africa
- 5.6.5.2.1 South Africa
- 5.6.5.2.2 Nigeria
- 5.6.5.2.3 Egypt
- 5.6.5.2.4 Rest of Africa
- 5.6.5.1 Middle East
- 5.6.1 North America
6 COMPETITIVE LANDSCAPE
- 6.1 Market Concentration
- 6.2 Strategic Moves
- 6.3 Market Share Analysis
- 6.4 Company Profiles (includes Global level Overview, Market level overview, Core Segments, Financials as available, Strategic Information, Market Rank/Share, Products and Services, Recent Developments)
- 6.4.1 Informatica Inc.
- 6.4.2 IBM Corporation
- 6.4.3 Microsoft Corporation
- 6.4.4 SAP SE
- 6.4.5 Oracle Corporation
- 6.4.6 SAS Institute Inc.
- 6.4.7 Denodo Technologies
- 6.4.8 TIBCO Software Inc.
- 6.4.9 QlikTech International AB
- 6.4.10 Precisely
- 6.4.11 Talend S.A.
- 6.4.12 Fivetran Inc.
- 6.4.13 Boomi LP
- 6.4.14 SnapLogic Inc.
- 6.4.15 MuleSoft LLC (Salesforce)
- 6.4.16 Matillion Ltd
- 6.4.17 Amazon Web Services, Inc.
- 6.4.18 Google LLC
- 6.4.19 HVR Software BV
- 6.4.20 Airbyte Inc.
- 6.4.21 Celigo Inc.
- 6.4.22 Tray.io Inc.
- 6.4.23 Alteryx Inc.
- 6.4.24 SyncMatters Ltd.
- 6.4.25 Hitachi Vantara LLC
7 MARKET OPPORTUNITIES AND FUTURE OUTLOOK
- 7.1 White-space and Unmet-need Assessment

 企業資料完整性市場預測至2034年-按品質功能、資料類型、平台架構、組織規模、產業和地區分類的全球分析
 2026年全球人工智慧(AI)資料整合市場報告面向神經多樣性的社交融合工具市場預測至2034年—全球解決方案類型、技術、社交技能、神經多樣性類型、交付模式、最終用戶和區域分析
 數據整合市場-2026-2032年全球市場預測資料整合市場預測至2034年-按組件、部署模式、整合類型、技術、組織規模、應用、最終用戶和地區分類的全球分析超互聯資料智慧市場預測至2034年-按智慧平台、資料處理類型、連接方式、應用、最終使用者和地區分類的全球分析雲端原生資料整合工具市場預測-全球分析(按元件、產品類型、整合類型、雲端原生架構類型、功能、應用和地區分類)-2034年
 資料整合市場:按組件、部署模式、最終用戶產業和地區分類2026年全球客戶資料整合市場報告無人機(UAV)資料整合市場預測:至2034年-按組件、部署模式、無人機類型、應用、最終用戶和地區分類的全球分析