


 |
市場調查報告書
商品編碼
2119653
行動POS終端:市場佔有率分析、產業趨勢與統計、成長預測(2026-2031年)MPOS Terminals - Market Share Analysis, Industry Trends & Statistics, Growth Forecasts (2026 - 2031) |
||||||

※ 本網頁內容可能與最新版本有所差異。詳細情況請與我們聯繫。
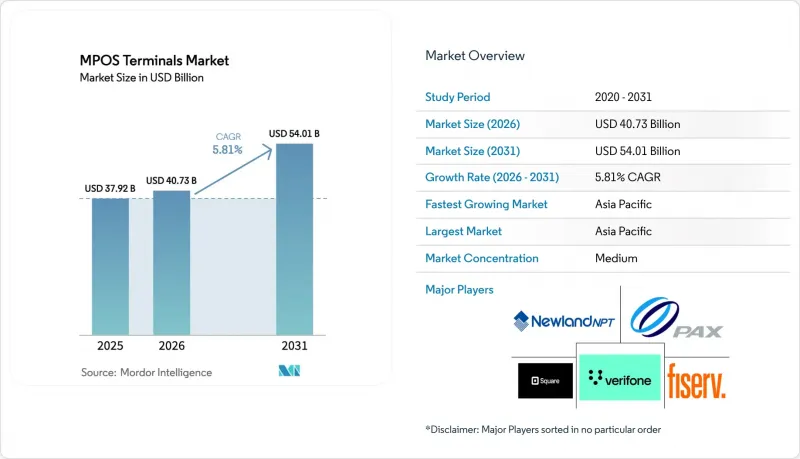
根據 Mordor Intelligence 預測,行動 POS 終端市場規模將從 2025 年的 379.2 億美元和 2026 年的 407.3 億美元成長到 2031 年的 540.1 億美元,2026 年至 2031 年的複合年成長率為 5.81%。
本報告依設備類型(IC晶片及PIN碼、IC晶片及簽名、非接觸式/NFC、僅磁條、支援生物識別)、支付方式(接觸式、非接觸式)、終端用戶產業(零售、飯店、醫療保健、運輸與物流、其他)、部署模式(本地部署、雲端/SaaS)及地區進行細分。市場預測以美元(USD)為單位。
全球行動POS終端市場趨勢及洞察
低成本卡片付款終端的普及
入門級讀卡機終端的出現,使得售價低於 50 美元的支付方式得以普及,此前只能使用現金的攤販小販、快閃零售商和零工經濟從業者也開始採用支付系統。 Square、SumUp 和 PayPal Zettle 等公司都提供售價低於 50 美元的加密狗終端,而亞太地區的契約製造製造商目前也以低於 30 美元的出廠價供應白牌終端,這加速了支付系統在印度二線城市和東南亞非正規零售領域的滲透。終端的商品化迫使供應商將業務重心轉向利潤更高的訂閱服務,例如分析儀錶板、忠誠度計畫整合和嵌入式金融,從而降低對硬體毛利的依賴。 ISO 20022通訊標準和 EMVCo 規範確保了互通性,消除了供應商鎖定,並加劇了價格競爭。
消費者加速轉向非接觸式支付和電子錢包
在愛爾蘭,行動錢包在2025年上半年佔銷售點(POS)交易的58.2%;在英國,2024年92%的卡片付款將採用非接觸式支付。對於商家而言,以30-45秒的PIN碼輸入取代15秒的非接觸式支付,可以縮短速食店的排隊時間並降低人事費用。在餐飲業,引進餐桌旁的NFC終端,顧客無需前往收銀台,從而使餐桌周轉率提高了10-15%。行動POS(mPOS)供應商的效益在於,非接觸式硬體的更換需求加速成長。然而,類似的消費者偏好也促使軟POS(SoftPOS)的實用化,對入門級終端的銷售量構成下行壓力。
手機非接觸式支付(Tap-on-Phone)類型的SoftPOS系統的興起正在削弱對專用mPOS硬體的需求。
Stripe 的純軟體 SDK、蘋果的 Tap to Pay 以及 Adyen 和 Worldline 提供的安卓 SoftPOS 解決方案,免除了小規模企業 50 至 150 美元的硬體購置成本,使他們能夠利用現有智慧型手機取代專用終端。這種零資本支出 (CAPEX) 的需求對每月交易量少於 100 筆的超小規模企業和季節性商家尤其具有吸引力。到 2027 年,SoftPOS 在歐洲的新商家帳戶中佔比可能達到 15% 至 20%,從而削弱入門級終端的需求。現有供應商正透過強調配備印表機、客戶顯示器和生物識別讀取器的固定終端來應對這項挑戰——這些功能智慧型手機無法複製——但在低利潤、高交易量的領域,向軟體的轉變已經開始。
細分市場分析
到2025年,IC晶片和PIN碼將佔據行動POS終端市場36.89%的佔有率,凸顯其在受法規環境中的穩固地位。同時,隨著PSD2認證標準的提升,預計到2031年,生物識別讀取器的複合年成長率將達到9.13%,從而推動歐洲對指紋和臉部認證終端的需求。因此,由於商家需要承擔30-40%的更高單位成本以減少扣回爭議帳款並遵守資料保護法規,與其他領域相比,配備生物識別設備的行動POS終端市場規模正在顯著擴大。功能有限的磁條卡和僅使用IC晶片的終端目前僅佔據一小部分市場,主要集中在EMV轉型落後的國家。隨著時間的推移,終端之間的競爭已從介面技術轉向高級認證技術,FIDO認證的感測器和隱私保護演算法正成為關鍵的差異化因素。
對高階服務日益成長的需求,使得Next Biometrics和PopID等專業供應商備受關注。 Next Biometrics在越南的終端中引入了指紋感測器,而PopID則在阿拉伯聯合大公國開展了臉部認證支付系統的試點計畫。現有供應商正在整合類似的模組以維持市場佔有率,同時軟體平台也將生物識別與年齡驗證、自助結帳系統等增值功能結合。在詐欺率較低的環境下,注重成本的商家仍然使用晶片和PIN碼系統,但處理高價值交易的行業正在轉向融合生物識別的模式,以平衡安全性和用戶體驗。
預計到2025年,接觸式交易將維持76.67%的市場佔有率,而非接觸式交易預計將以8.34%的複合年成長率成長,約為行動POS終端市場整體成長率的1.5倍。消費者對支持非接觸式支付的銀行卡和行動錢包的熟悉程度已達到一個轉折點,例如,2024年加拿大行動非接觸式交易量將達到34億筆,英國的非接觸式支付使用率高達92%。為了避免競爭,商家正在加速終端升級換代,轉向支援NFC功能的機型,並部署利用智慧型手機天線的SoftPOS系統。
速度和便利性是推動這項轉變的主要因素。非接觸式支付平均只需 15 秒即可完成,而輸入 PIN 碼則需要長達 45 秒,這顯著縮短了零售和餐飲行業的等待時間,並提高了處理能力。雖然出於合規性考慮,加油站和高價值票務銷售等銀行仍會繼續使用非接觸式支付,但隨著行動錢包生態系統的擴展,以及忠誠度計劃、優惠券和數位身分識別等功能的加入,用戶參與度不斷提高,非接觸式支付的成長優勢預計將進一步擴大。
區域分析
預計到2025年,亞太地區將佔全球銷售額的29.41%,並將在2031年之前維持6.02%的複合年成長率,成為所有地區中成長最快的地區。這一成長動能主要得益於印度的統一支付介面(UPI),該介面在2024年12月的交易量達到167.3億筆;以及中國的支付寶Plus,該服務使泰國、馬來西亞和印尼的商家無需安裝新硬體即可透過QR碼接受中國遊客的付款。在日本和韓國,磁條卡向近場通訊(NFC)的過渡正在推進,甚至早於市場放鬆管制;而在澳大利亞,非接觸式支付的普及率已超過95%。印度和印尼遍遠地區的寬頻普及率低於40%,而在孟加拉和越南,不穩定的電力供應限制了全天候網路連線的部署。
北美市場規模位居第二。由於該地區較早實施了基於EMV晶片的責任轉移機制,硬體升級已成為領先,目前的需求主要集中在用非接觸式和生物識別終端取代傳統終端。預計到2024年,加拿大將實現34億筆行動非接觸式支付,顯示消費者對該技術的接受度很高;而墨西哥金融科技主導的商家拓展也為市場成長創造了更多空間。儘管成長穩定,但仍落後於亞太地區,這反映出亞太地區的市場成熟度和現有較高的滲透率。
歐洲的趨勢主要受PSD2嚴格的客戶身份驗證機制驅動,儘管SoftPOS正在蠶食入門級市場,但PSD2仍然推動了高階硬體的升級。法國和德國等市場正在對終端進行改造,加裝指紋感應器以滿足豁免條件,而小規模商家則採用基於智慧型手機的支付方式以避免資本投入。南美洲的趨勢則由巴西的Pix即時支付系統推動,該系統預計到2024年將處理超過400億筆交易,並將QR碼支付直接整合到POS軟體中。中東受益於阿拉伯聯合大公國智慧城市建設和沙烏地阿拉伯「2030願景」的投資,而非洲由於電力供應限制,儘管擁有強大的行動支付生態系統,卻不得不採用以離線為主的混合模式。
其他好處:
- Excel格式的市場預測(ME)表
- 3個月的分析師支持
目錄
第1章:引言
- 研究假設和市場定義
- 調查範圍
第2章:調查方法
第3章執行摘要
第4章 市場狀況
- 市場概覽
- 市場促進因素
- 低成本卡片付款終端的普及
- 消費者正擴大轉向非接觸式支付和電子錢包支付。
- 設備內輕觸手機認證正在推動以智慧型手機為POS終端的解決方案的普及。
- 小規模企業增值分析的快速普及
- 強制推行基於 PSD2生物識別的強客戶認證 (SCA) 正在推動硬體升級。
- 門市實施先買後付需要升級行動韌體。
- 市場限制因素
- 地方市場寬頻與電力供應不均衡
- 持續存在的安全和詐欺問題
- 手機輕觸式軟體POS系統的興起正在削弱對專用行動POS硬體的需求。
- PCI MPoC 和 PCI v6 合規性的遷移成本很高。
- 產業價值鏈分析
- 監理情勢
- 技術展望
- 宏觀經濟因素對市場的影響
- 波特五力分析
第5章 市場規模與成長預測
- 依設備類型
- IC晶片和引腳
- 積體電路晶片及簽名
- 非接觸式/NFC
- 僅限磁條
- 支援生物識別
- 透過付款方式
- 聯繫類型
- 非接觸式
- 按最終用戶行業分類
- 零售
- 飯店業
- 醫療保健
- 運輸/物流
- 其他
- 按實現類型
- 現場
- 基於雲端的SaaS
- 按地區
- 北美洲
- 美國
- 加拿大
- 墨西哥
- 南美洲
- 巴西
- 阿根廷
- 其他南美國家
- 歐洲
- 德國
- 英國
- 法國
- 義大利
- 西班牙
- 其他歐洲國家
- 亞太地區
- 中國
- 日本
- 印度
- 韓國
- 東南亞
- 其他亞太國家
- 中東
- 沙烏地阿拉伯
- 阿拉伯聯合大公國
- 其他中東國家
- 非洲
- 南非
- 埃及
- 其他非洲國家
- 北美洲
第6章 競爭情勢
- 市場集中度
- 策略趨勢
- 市佔率分析
- 公司簡介
- Block Inc.(Square)
- Fiserv Inc.(Clover)
- VeriFone Inc.
- PAX Technology Ltd.
- Newland Payment Technology
- BBPOS Ltd.
- SumUp Payments Ltd.
- PayPal Zettle
- Adyen NV
- Lightspeed Commerce Inc.
- Shopify Inc.(Shop POS)
- Toast Inc.
- NCR Voyix Corp.
- HP Development Company LP
- NEC Corporation
- Panasonic Holdings Corp.
- Spectra Technologies India Pvt Ltd.
- Posiflex Technology Inc.
- Oracle Micros Systems
- North American Bancard(PayAnywhere)
- Yoco Technologies Pty Ltd.
- myPOS World Ltd.
第7章 市場機會與未來展望
According to Mordor Intelligence, the mPOS terminals market size is projected to expand from USD 37.92 billion in 2025 and USD 40.73 billion in 2026 to USD 54.01 billion by 2031, registering a 5.81% CAGR between 2026 to 2031.
This report is Segmented by Device Type (Chip and PIN, Chip and Signature, Contactless/NFC, Magnetic-Stripe-Only, and More), Mode of Payment (Contact-Based, and Contactless), End-User Industry (Retail, Hospitality, Healthcare, Transportation and Logistics, and More), Deployment Mode (On-Premise, and Cloud-Based and SaaS), and Geography. The Market Forecasts are Provided in Terms of Value (USD).
Global MPOS Terminals Market Trends and Insights
Ubiquity of Low-Cost Card Acceptance Hardware
Entry-level readers priced below USD 50 have unlocked acceptance for street vendors, pop-up retailers, and gig-economy workers that previously operated on cash alone. Square, SumUp, and PayPal Zettle all list sub-USD 50 dongles, and Asia-Pacific contract manufacturers now supply white-label units at under USD 30 ex-works, accelerating penetration into India's tier-2 cities and Southeast Asia's informal retail sector. Device commoditization is forcing vendors to pivot toward higher-margin subscriptions for analytics dashboards, loyalty integration, and embedded financing, reducing reliance on hardware gross profit. ISO 20022 messaging and EMVCo specifications guarantee interoperability, stripping away vendor lock-in and sharpening price competition.
Accelerating Consumer Shift to Contactless and E-Wallet Payments
Ireland logged mobile wallets at 58.2% of point-of-sale value during H1 2025, and 92% of U.K. card payments were tap-to-pay in 2024. For merchants, a 15-second tap replaces a 30-45-second PIN entry, shrinking queues and labor costs in quick-service restaurants. Hospitality venues report 10-15% faster table turns when tableside NFC terminals remove trips to a cashier station. The upside for MPOS vendors is an accelerated replacement wave for contactless-capable hardware, although the same consumer preference also makes SoftPOS viable, applying downward pressure on entry-level device sales.
Emerging Tap-on-Phone SoftPOS Cannibalizing Dedicated MPOS Hardware
Stripe's software-only SDK, Apple Tap to Pay, and Android SoftPOS from Adyen and Worldline eliminate the USD 50-150 hardware purchase for small merchants, substituting existing smartphones for separate terminals. Micro-merchants and seasonal vendors processing fewer than 100 transactions a month are particularly drawn to zero-capex onboarding. European SoftPOS adoption could reach 15-20% of new merchant accounts by 2027, eroding entry-level device demand. Incumbent vendors are countering by emphasizing countertop units with printers, customer displays, and biometric readers that smartphones cannot replicate, but the low-margin high-volume segment is already migrating toward software.
Other drivers and restraints analyzed in the detailed report include:
- On-Device Tap to Phone Certification Unlocking Smartphone-as-POS Solutions
- Rapid Rollout of Value-Add Analytics for Micro-Merchants
- Costly Migration to PCI MPoC and PCI v6 Compliance
For complete list of drivers and restraints, kindly check the Table Of Contents.
Segment Analysis
Chip-and-PIN held 36.89% of the MPOS terminals market share in 2025, underscoring its entrenchment in regulated environments. Biometric readers, however, are recording a 9.13% CAGR to 2031 after PSD2 raised authentication thresholds, fueling demand for fingerprint or facial recognition terminals across Europe. The MPOS terminals market size allocated to biometric devices therefore rises disproportionately as merchants absorb 30-40% higher unit prices to reduce chargebacks and align with data-protection rules. Low-feature magnetic-stripe and chip-only models now occupy a residual niche, mainly in countries with delayed EMV migration. Over time, device competition is shifting from interface technology toward authentication sophistication, with FIDO-certified sensors and privacy-preserving algorithms emerging as product differentiators.
The premium emphasis is attracting specialized suppliers such as Next Biometrics, which deployed fingerprint sensors in Vietnamese terminals, and PopID, which piloted facial-auth payment systems in the United Arab Emirates. Established vendors are integrating similar modules to defend share, while software platforms tie biometric readiness to value-add features like age verification and self-checkout. Cost-sensitive merchants in low-fraud environments stick with chip-and-PIN, while higher-ticket verticals migrate toward biometric-embedded models to balance security and user experience.
Contact-based transactions retained 76.67% share in 2025, yet contactless volume is expanding at an 8.34% CAGR, nearly 1.5 times the overall MPOS terminals market growth. Consumer familiarity with tap-to-pay cards and mobile wallets has reached a tipping point, exemplified by Canada's 3.4 billion mobile contactless transactions in 2024 and the United Kingdom's 92% tap rate. To remain competitive, merchants are accelerating terminal refresh cycles toward NFC-enabled models or adopting SoftPOS that leverages the built-in antenna on smartphones.
Speed and convenience drive this migration. Contactless swipes average 15 seconds versus up to 45 seconds for PIN entry, translating into shorter queues and higher throughput in retail and hospitality. While compliance-driven verticals such as fuel or high-value ticketing will sustain contact-based methods, the growth premium for contactless is expected to keep widening as mobile wallet ecosystems expand loyalty, coupon, and digital-identity features that deepen user engagement.
Complete Report Scope:
- By Device Type
- Chip and PIN
- Chip and Signature
- Contactless and NFC
- Magnetic-Stripe-Only
- Biometric-Enabled
- By Mode of Payment
- Contact-based
- Contactless
- By End-User Industry
- Retail
- Hospitality
- Healthcare
- Transportation and Logistics
- Other End-User Industries
- By Deployment Mode
- On-Premise
- Cloud-Based and SaaS
- By Geography
- North America
- United States
- Canada
- Mexico
- South America
- Brazil
- Argentina
- Rest of South America
- Europe
- Germany
- United Kingdom
- France
- Italy
- Spain
- Rest of Europe
- Asia-Pacific
- China
- Japan
- India
- South Korea
- Southeast Asia
- Rest of Asia-Pacific
- Middle East
- Saudi Arabia
- United Arab Emirates
- Rest of Middle East
- Africa
- South Africa
- Egypt
- Rest of Africa
- North America
Geography Analysis
Asia-Pacific contributed 29.41% of global revenue in 2025 and is forecast to post a 6.02% CAGR through 2031, the fastest of any region. Momentum stems from India's UPI, which recorded 16.73 billion transactions in December 2024, and China's Alipay Plus, which lets Thai, Malaysian, and Indonesian merchants accept payments from Chinese visitors via QR code without new hardware. Japan and South Korea are migrating from magnetic stripe to NFC ahead of regulatory sunsets, while Australia's tap-and-go penetration tops 95%. Rural broadband in India and Indonesia hovers below 40%, and inconsistent electricity in Bangladesh and Vietnam limits always-on deployment.
North America ranks second in size. The region's early EMV liability shift front-loaded hardware upgrades, so current demand revolves around replacing legacy units with contactless and biometric models. Canada's 3.4 billion mobile contactless payments in 2024 showcase the consumer uptake, and Mexico's fintech-driven merchant onboarding adds incremental headroom. Growth is steady but trails Asia-Pacific, reflecting market maturity and high existing penetration.
Europe's trajectory hinges on PSD2 Strong Customer Authentication, which is driving premium hardware refresh even as SoftPOS cannibalizes entry tiers. Markets such as France and Germany are retrofitting terminals with fingerprint sensors to meet exemption thresholds, while micro-merchants adopt smartphone-based acceptance to avoid capital outlays. South America is propelled by Brazil's Pix instant-payment system that exceeded 40 billion transfers in 2024, integrating QR acceptance directly into point-of-sale software. The Middle East benefits from smart-city investments in the United Arab Emirates and Saudi Arabia's Vision 2030, whereas Africa remains constrained by power availability, forcing hybrid offline-first deployments despite strong mobile-money ecosystems.
- Block Inc. (Square)
- Fiserv Inc. (Clover)
- VeriFone Inc.
- PAX Technology Ltd.
- Newland Payment Technology
- BBPOS Ltd.
- SumUp Payments Ltd.
- PayPal Zettle
- Adyen N.V.
- Lightspeed Commerce Inc.
- Shopify Inc. (Shop POS)
- Toast Inc.
- NCR Voyix Corp.
- HP Development Company L.P.
- NEC Corporation
- Panasonic Holdings Corp.
- Spectra Technologies India Pvt Ltd.
- Posiflex Technology Inc.
- Oracle Micros Systems
- North American Bancard (PayAnywhere)
- Yoco Technologies Pty Ltd.
- myPOS World Ltd.
Additional Benefits:
- The market estimate (ME) sheet in Excel format
- 3 months of analyst support
TABLE OF CONTENTS
1 INTRODUCTION
- 1.1 Study Assumptions and Market Definition
- 1.2 Scope of the Study
2 RESEARCH METHODOLOGY
3 EXECUTIVE SUMMARY
4 MARKET LANDSCAPE
- 4.1 Market Overview
- 4.2 Market Drivers
- 4.2.1 Ubiquity of Low-Cost Card Acceptance Hardware
- 4.2.2 Accelerating Consumer Shift to Contactless and E-Wallet Payments
- 4.2.3 On-Device Tap to Phone Certification Unlocking Smartphone-as-POS Solutions
- 4.2.4 Rapid Rollout of Value-Add Analytics for Micro-Merchants
- 4.2.5 Biometric SCA Mandates Under PSD2 Boosting Hardware Refresh
- 4.2.6 In-Store BNPL Enablement Requiring MPOS Firmware Upgrades
- 4.3 Market Restraints
- 4.3.1 Patchy Broadband and Power in Rural Markets
- 4.3.2 Persistent Security and Fraud Concerns
- 4.3.3 Emerging Tap-on-Phone SoftPOS Cannibalizing Dedicated MPOS Hardware
- 4.3.4 Costly Migration to PCI MPoC and PCI v6 Compliance
- 4.4 Industry Value Chain Analysis
- 4.5 Regulatory Landscape
- 4.6 Technological Outlook
- 4.7 Impact of Macroeconomic Factors on the Market
- 4.8 Porter's Five Forces Analysis
- 4.8.1 Bargaining Power of Buyers
- 4.8.2 Bargaining Power of Suppliers
- 4.8.3 Threat of New Entrants
- 4.8.4 Threat of Substitutes
- 4.8.5 Intensity of Competitive Rivalry
5 MARKET SIZE AND GROWTH FORECASTS (VALUE)
- 5.1 By Device Type
- 5.1.1 Chip and PIN
- 5.1.2 Chip and Signature
- 5.1.3 Contactless and NFC
- 5.1.4 Magnetic-Stripe-Only
- 5.1.5 Biometric-Enabled
- 5.2 By Mode of Payment
- 5.2.1 Contact-based
- 5.2.2 Contactless
- 5.3 By End-User Industry
- 5.3.1 Retail
- 5.3.2 Hospitality
- 5.3.3 Healthcare
- 5.3.4 Transportation and Logistics
- 5.3.5 Other End-User Industries
- 5.4 By Deployment Mode
- 5.4.1 On-Premise
- 5.4.2 Cloud-Based and SaaS
- 5.5 By Geography
- 5.5.1 North America
- 5.5.1.1 United States
- 5.5.1.2 Canada
- 5.5.1.3 Mexico
- 5.5.2 South America
- 5.5.2.1 Brazil
- 5.5.2.2 Argentina
- 5.5.2.3 Rest of South America
- 5.5.3 Europe
- 5.5.3.1 Germany
- 5.5.3.2 United Kingdom
- 5.5.3.3 France
- 5.5.3.4 Italy
- 5.5.3.5 Spain
- 5.5.3.6 Rest of Europe
- 5.5.4 Asia-Pacific
- 5.5.4.1 China
- 5.5.4.2 Japan
- 5.5.4.3 India
- 5.5.4.4 South Korea
- 5.5.4.5 Southeast Asia
- 5.5.4.6 Rest of Asia-Pacific
- 5.5.5 Middle East
- 5.5.5.1 Saudi Arabia
- 5.5.5.2 United Arab Emirates
- 5.5.5.3 Rest of Middle East
- 5.5.6 Africa
- 5.5.6.1 South Africa
- 5.5.6.2 Egypt
- 5.5.6.3 Rest of Africa
- 5.5.1 North America
6 COMPETITIVE LANDSCAPE
- 6.1 Market Concentration
- 6.2 Strategic Moves
- 6.3 Market Share Analysis
- 6.4 Company Profiles (includes Global Level Overview, Market Level Overview, Core Segments, Financials as available, Strategic Information, Market Rank/Share, Products and Services, Recent Developments)
- 6.4.1 Block Inc. (Square)
- 6.4.2 Fiserv Inc. (Clover)
- 6.4.3 VeriFone Inc.
- 6.4.4 PAX Technology Ltd.
- 6.4.5 Newland Payment Technology
- 6.4.6 BBPOS Ltd.
- 6.4.7 SumUp Payments Ltd.
- 6.4.8 PayPal Zettle
- 6.4.9 Adyen N.V.
- 6.4.10 Lightspeed Commerce Inc.
- 6.4.11 Shopify Inc. (Shop POS)
- 6.4.12 Toast Inc.
- 6.4.13 NCR Voyix Corp.
- 6.4.14 HP Development Company L.P.
- 6.4.15 NEC Corporation
- 6.4.16 Panasonic Holdings Corp.
- 6.4.17 Spectra Technologies India Pvt Ltd.
- 6.4.18 Posiflex Technology Inc.
- 6.4.19 Oracle Micros Systems
- 6.4.20 North American Bancard (PayAnywhere)
- 6.4.21 Yoco Technologies Pty Ltd.
- 6.4.22 myPOS World Ltd.
7 MARKET OPPORTUNITIES AND FUTURE OUTLOOK
- 7.1 White-Space and Unmet-Need Assessment

 mPOS終端市場-2026-2032年全球市場預測
 行動POS終端市場規模、佔有率和成長分析:按組件、部署模式、作業系統、連接方式、企業規模、最終用戶和地區分類-產業預測,2026-2033年
 行動POS終端市場規模、佔有率和趨勢分析報告:按組件、類型、應用、地區和細分市場預測(2026-2033年)
 2026-2030年全球行動POS終端市場
 行動POS終端市場分析及預測(至2035年):類型、產品類型、服務、技術、組件、應用、部署模式、最終用戶、功能
 2026年全球行動POS終端市場報告
 行動POS終端市場-全球產業規模、佔有率、趨勢、機會、預測:按組件、類型、應用、地區和競爭格局分類,2021-2031年
 MPOS 終端市場規模、佔有率及成長分析(按組件、解決方案、部署、應用和地區)-2025 年至 2032 年產業預測
 全球mPOS設備市場:實績與預測(2020-2031年)