

 |
市場調查報告書
商品編碼
2119639
綠色科技:市場佔有率分析、產業趨勢與統計、成長預測(2026-2031)Green Technology - Market Share Analysis, Industry Trends & Statistics, Growth Forecasts (2026 - 2031) |
||||||

※ 本網頁內容可能與最新版本有所差異。詳細情況請與我們聯繫。
根據 Mordor Intelligence 估計,綠色科技市場在 2026 年的價值為 362.4 億美元,高於 2025 年的 294.5 億美元,預計到 2031 年將達到 1022.6 億美元。
預計從 2026 年到 2031 年,其複合年成長率將達到 23.05%。
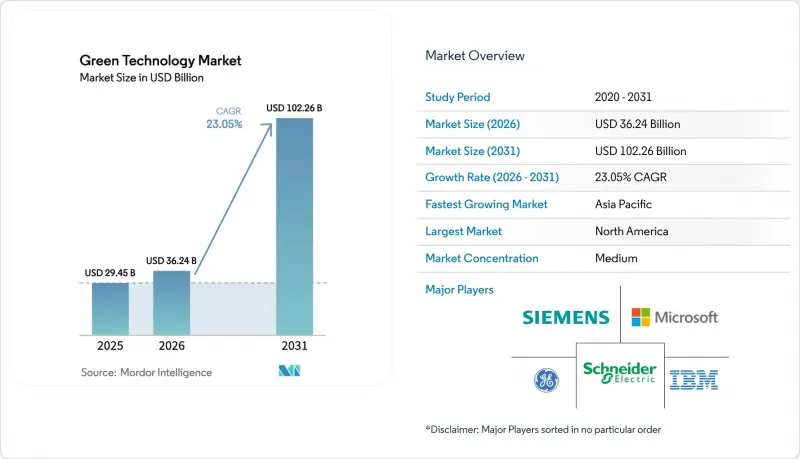
本報告按組件(解決方案、服務)、技術(物聯網 (IoT)、人工智慧和分析、數位孿生等)、應用(綠色建築、碳足跡管理等)以及最終用戶行業(能源和公共產業、製造業等)進行細分。市場預測以美元計價。
全球綠色科技市場趨勢與洞察
日益增強的環保意識和企業消除淨零排放的義務
強制性永續發展報告將高階主管薪酬與減排目標掛鉤,並鼓勵企業在工廠、辦公室和物流中心部署感測器網路。在中國,到2026年,將有超過300家上市公司被要求披露永續發展訊息,這將推動對持續監測工具的需求。Schneider Electric在設定了到2025年將客戶排放量減少8億噸的目標後,於2024年實現了創紀錄的利潤,這表明環境績效正在改變企業的競爭地位。隨著企業從年度審計轉向運作儀錶板,可預測的訂閱收入正在興起,採購團隊也越來越傾向於根據即時碳排放指標而非靜態證書來評估供應商。
嚴格的脫碳政策和碳定價
歐盟委員會的《永續產品生態設計條例》將於2025年前將環境要求擴展至幾乎所有實體產品,將自願升級轉變為法律義務。歐盟的碳邊境調節機制要求碳密集型出口商記錄其產品中包含的碳排放,加速亞太地區製造商採用數位監測技術。孟加拉、印尼和越南目前正在對紡織品生產線進行改造,加裝感測器陣列,以確保成品能夠順利通過歐洲海關。因此,跨國公司供應鏈中的共用資料模型正逐步標準化,從而擴大了綠色技術市場平台的潛在基本客群。
高昂的初始實施成本與生命週期成本
儘管硬體價格不斷下降,但整體擁有成本 (TCO) 仍然是中小企業 (SME) 面臨的一大障礙。如果將傳統工業系統和員工再培訓考慮在內,整合成本可能高達標價的三倍。許多製造商難以快速實現碳排放可見度所帶來的收益,以滿足其短期預算週期,導致採用率主要集中在擁有專項永續發展資金的大型企業。顧問公司和託管服務供應商正在填補能力缺口,但他們高昂的人事費用進一步擴大了可負擔性差距,從而減緩了低利潤行業中綠色技術市場的成長。
細分市場分析
到2025年,解決方案將佔據綠色技術市場77.35%的佔有率。這是因為企業更傾向於使用整合能源、廢棄物和排放儀錶板的統一套件。供應商透過將物聯網資料收集、分析和合規性報告打包到單一授權中,降低了採購摩擦和整合風險。服務部門以24.6%的複合年成長率成長,負責配置、資料清洗和員工能力建構。許多實施案例表明,實際實現的節能率超過20%,但這得益於諮詢顧問對感測器閾值和預測演算法的微調。服務團隊也會更新規則庫,以跟上監管變化並確保符合審計要求。
隨著企業從說明分析轉向指示性分析,專業服務收入將進一步成長。例如,整合人體感應器和暖通空調風門的智慧建築維修可以實現 20-30% 的節能,但需要持續的模型更新。碳核算諮詢服務將原始測量數據轉換為多個司法管轄區均可接受的範圍 3資訊披露,從而避免客戶陷入重複的報告週期。解決方案和服務之間能夠產生協同效應。平台部署會產生數據,從而揭示新的最佳化機會。反過來,這又會創造對服務的進一步需求,推動綠色科技市場的擴張。
到2025年,物聯網(IoT)將佔綠色技術市場32.55%的佔有率,這反映了電網、農場和工廠中部署的大量聯網計量設備。感測器數據支撐著性能基準,使人工智慧模組能夠識別異常情況。區塊鏈以25.4%的複合年成長率成長,支持可靠的排碳權追溯和供應鏈抵消機制,使品牌能夠在自身生態系統內抵消碳排放。人工智慧(AI)驅動的工作負載正在最佳化風力發電機的維護計劃,Aerones公司籌集6,200萬美元用於擴展其機器人檢測服務,就凸顯了這一點。
數位孿生技術如今能夠複製整個園區,使管理者能夠在實際改造資產之前,對維修方案進行虛擬測試。雲端超大規模資料中心業者提供彈性運算資源,用於處理高頻測量,而邊緣節點則負責處理電壓平衡等對延遲敏感的任務。可靠的帳本記錄經檢驗的減排量,形成閉迴路,並在目標難以達成時自動購買碳抵銷額度。這種感測、建模、最佳化和可追溯性的相互作用,鞏固了物聯網的主導地位,同時也為區塊鏈的快速崛起留下了空間,促進了綠色技術市場的多元化發展。
區域分析
在聯邦政府獎勵和充裕創業投資的支持下,北美預計在2025年以23.45%的市佔率引領綠色科技市場。由於《通膨控制法案》,數十億美元正投入清潔能源基礎建設,同時企業買家也確保多年永續發展預算。美國公司正在利用成熟的軟體生態系統,並將碳分析整合到其企業合約中。在加拿大,類似的平台正在擴展,用於追蹤跨境汽車和航太供應鏈;在墨西哥,排放監測正被納入加工出口區的合規運營,這反映了全部區域政策的一致性。
亞太地區預計將實現最高成長率,年複合成長率達23.8%,主要受工業擴張和日益嚴格的環境法規推動。中國證券交易所的新規(自2026年起強制要求提交永續發展報告)正在加速工廠感測器的應用。印度正增加對國內清潔技術智慧財產權的投資,以抵銷礦產進口風險;日本則加速智慧工廠的建設,以維持出口競爭力。韓國已撥款約1.01億美元用於其“戰略智慧城市計畫”,將物聯網節點整合到其交通和水利網路中。
其他好處:
- Excel格式的市場預測(ME)表
- 3個月的分析師支持
目錄
第1章:引言
- 研究假設和市場定義
- 調查範圍
第2章:調查方法
第3章執行摘要
第4章 市場狀況
- 市場概覽
- 市場促進因素
- 日益增強的環保意識和企業的淨零排放目標
- 嚴格的脫碳政策和碳定價
- 物聯網感測器和雲端平台的成本正在迅速下降。
- 整合到 ERP 系統中的 AI 驅動型碳計量平台
- 用於通用人工智慧(Gen-AI)工作負載的綠色資料中心的投資正在激增。
- 利用區塊鏈技術的自願性碳抵消市場。
- 市場限制因素
- 高昂的初始整合成本和生命週期成本
- 新興地區綠色技術人才短缺
- 數位基礎設施範圍 2 排放的審查
- 關鍵礦產供應鏈瓶頸
- 供應鏈分析
- 監理情勢
- 技術展望
- 波特五力分析
- 對影響市場的宏觀經濟因素進行評估
第5章 市場規模與成長預測
- 按組件
- 解決方案
- 服務
- 透過技術
- 物聯網 (IoT)
- 人工智慧與分析
- 數位孿生
- 雲端運算
- 區塊鏈
- 其他新興技術
- 透過使用
- 綠建築
- 碳足跡管理
- 空氣和水污染監測
- 氣象觀測與預報
- 作物監測
- 其他
- 按最終用戶行業分類
- 能源公用事業
- 製造業
- 運輸/物流
- 農業
- 建築和房地產
- 資訊科技/通訊
- 政府/公共部門
- 其他行業
- 按地區
- 北美洲
- 美國
- 加拿大
- 墨西哥
- 南美洲
- 巴西
- 阿根廷
- 其他南美國家
- 歐洲
- 德國
- 英國
- 法國
- 義大利
- 西班牙
- 其他歐洲國家
- 亞太地區
- 中國
- 印度
- 日本
- 韓國
- 澳洲和紐西蘭
- 其他亞太國家
- 中東和非洲
- 中東
- 沙烏地阿拉伯
- 阿拉伯聯合大公國
- 土耳其
- 其他中東國家
- 非洲
- 奈及利亞
- 南非
- 埃及
- 其他非洲國家
- 中東
- 北美洲
第6章 競爭情勢
- 市場集中度
- 策略趨勢
- 市佔率分析
- 公司簡介
- General Electric
- IBM Corporation
- Microsoft Corporation
- Siemens AG
- Schneider Electric SE
- Wolters Kluwer NV
- Oracle Corporation
- CropX Inc.
- Engie Impact
- Sensus(Xylem)
- Trace Genomics
- Accuvio(Diligent)
- Tesla Inc.
- Vestas Wind Systems
- ABB Ltd.
- Cority Software
- Schneider Electric
- Enel SpA
- Siemens Gamesa
- KBR Inc.
第7章 市場機會與未來展望
According to Mordor Intelligence, green technology market size in 2026 is estimated at USD 36.24 billion, growing from 2025 value of USD 29.45 billion with 2031 projections showing USD 102.26 billion, growing at 23.05% CAGR over 2026-2031.
This report is Segmented by Component (Solutions, Services), Technology (Internet of Things (IoT), Artificial Intelligence and Analytics, Digital Twin, and More), Application (Green Building, Carbon Footprint Management, and More), End User Industry (Energy and Utilities, Manufacturing, and More). The Market Forecasts are Provided in Terms of Value (USD).
Global Green Technology Market Trends and Insights
Rising Environmental Awareness and Corporate Net-Zero Mandates
Mandatory sustainability reporting now links executive compensation to emissions targets, prompting companies to embed sensor networks across factories, offices, and logistics nodes. Over 300 listed firms in China must file sustainability disclosures by 2026, reinforcing demand for continuous monitoring tools. Schneider Electric reported record 2024 profits after targeting 800 million tonnes of customer emissions savings by 2025, illustrating how environmental performance is reshaping competitive positioning. Predictable subscription revenues emerge as enterprises move from annual audits to always-on dashboards, and procurement teams increasingly score suppliers on real-time carbon metrics rather than static certificates.
Stringent Decarbonization Policies and Carbon Pricing
The European Commission's Ecodesign for Sustainable Products Regulation extends environmental requirements to nearly all physical goods by 2025, turning optional upgrades into legal obligations.The EU's Carbon Border Adjustment Mechanism forces carbon-intensive exporters to document embedded emissions, encouraging Asia-Pacific manufacturers to accelerate digital monitoring rollouts. Bangladesh, Indonesia, and Vietnam now retrofit textile lines with sensor arrays so finished goods can clear European customs. As a result, multinational supply chains standardize on shared data models, deepening the addressable base for green technology market platforms.
High Upfront Integration and Lifecycle Costs
Total cost of ownership still deters smaller firms even as hardware prices fall. Integration fees can triple list prices once legacy industrial systems and staff retraining enter the equation. Many manufacturers struggle to monetize carbon visibility quickly enough to satisfy short-term budget cycles, so adoption skews toward large enterprises with ring-fenced sustainability capital. Consultants and managed-service providers fill capability gaps, yet their labor premiums widen the affordability gulf, slowing the green technology market in lower-margin sectors.
Other drivers and restraints analyzed in the detailed report include:
- Rapid Cost Decline of IoT Sensors and Cloud Platforms
- AI-Driven Carbon Accounting Platforms Embedded in ERP Stacks
- Critical-Mineral Supply-Chain Bottlenecks
For complete list of drivers and restraints, kindly check the Table Of Contents.
Segment Analysis
Solutions accounted for 77.35% of green technology market share in 2025 because enterprises prefer unified suites that consolidate energy, waste, and emissions dashboards. Vendors package IoT ingestion, analytics, and compliance reporting in single licenses, reducing procurement friction and integration risk. The services segment, growing at a 24.6% CAGR, handles configuration, data cleansing, and staff enablement. Many deployments reveal that realized energy savings often exceed 20%, but only after consultants fine-tune sensor thresholds and predictive algorithms. Services teams also update rule libraries as regulations evolve, safeguarding audit readiness.
Professional-service revenue rises further once firms progress from descriptive to prescriptive analytics. For example, smart-building retrofits that link occupancy sensors to HVAC dampers deliver 20-30% energy savings but require continuous model retraining. Carbon-accounting advisory units translate raw readings into scope-3 disclosures accepted by multiple jurisdictions, sparing clients from duplicated reporting cycles. Together, solutions and services form a flywheel: platform rollouts generate data that exposes new optimization opportunities, which in turn demand additional service engagements, reinforcing the expansion of the green technology market.
IoT maintained 32.55% of the green technology market in 2025, reflecting the sheer volume of connected meters deployed across power grids, farms, and factories. Sensor data underpins performance baselines, enabling AI modules to target anomalies. Blockchain, rising at a 25.4% CAGR, supports trusted carbon-credit provenance and supply-chain insetting schemes where brands offset emissions inside their own ecosystems. Artificial-intelligence workloads refine wind-turbine maintenance schedules, a focus highlighted when Aerones secured USD 62 million to expand robotic inspection services.
Digital-twin engines now mirror entire campuses, letting managers test retrofits virtually before touching assets. Cloud hyperscalers supply elastic compute that crunches high-frequency readings, while edge nodes tackle latency-sensitive tasks such as voltage balancing. Trusted ledgers close the loop by recording verified reductions, allowing automated offset purchases when targets slip. This interplay among sensing, modeling, optimization, and traceability secures IoT's leadership yet leaves room for blockchain's rapid rise, fueling technology diversity inside the green technology market.
Complete Report Scope:
- By Component
- Solutions
- Services
- By Technology
- Internet of Things (IoT)
- Artificial Intelligence and Analytics
- Digital Twin
- Cloud Computing
- Blockchain
- Other Emerging Technologies
- By Application
- Green Building
- Carbon Footprint Management
- Air and Water Pollution Monitoring
- Weather Monitoring and Forecasting
- Crop Monitoring
- Others
- By End-user Industry
- Energy and Utilities
- Manufacturing
- Transportation and Logistics
- Agriculture
- Construction and Real-estate
- IT and Telecom
- Government and Public Sector
- Other Industries
- By Geography
- North America
- United States
- Canada
- Mexico
- South America
- Brazil
- Argentina
- Rest of South America
- Europe
- Germany
- United Kingdom
- France
- Italy
- Spain
- Rest of Europe
- Asia-Pacific
- China
- India
- Japan
- South Korea
- Australia and New Zealand
- Rest of Asia-Pacific
- Middle East and Africa
- Middle East
- Saudi Arabia
- United Arab Emirates
- Turkey
- Rest of Middle East
- Africa
- Nigeria
- South Africa
- Egypt
- Rest of Africa
- Middle East
- North America
Geography Analysis
North America led the green technology market with a 23.45% share in 2025 on the back of federal incentives and deep venture-capital pools. The Inflation Reduction Act funnels billions toward clean-energy infrastructure, while corporate buyers lock in multi-year sustainability budgets. United States firms bundle carbon analytics into enterprise contracts, leveraging mature software ecosystems. Canada scales similar platforms to track cross-border automotive and aerospace supply chains, and Mexico integrates emissions monitoring into maquiladora compliance workflows, reflecting region-wide policy alignment.
Asia-Pacific recorded the fastest projected growth at a 23.8% CAGR, powered by industrial expansion paired with tighter environmental mandates. China's stock-exchange rules, which require sustainability reports from 2026, catalyze factory sensor retrofits. India doubles down on domestic clean-tech IP to offset mineral import risks, and Japan accelerates smart-factory rollouts to maintain export competitiveness. South Korea allotted about USD 101 million to its Strategic Smart City Program, embedding IoT nodes in transport and water grids.
- General Electric
- IBM Corporation
- Microsoft Corporation
- Siemens AG
- Schneider Electric SE
- Wolters Kluwer N.V.
- Oracle Corporation
- CropX Inc.
- Engie Impact
- Sensus (Xylem)
- Trace Genomics
- Accuvio (Diligent)
- Tesla Inc.
- Vestas Wind Systems
- ABB Ltd.
- Cority Software
- Schneider Electric
- Enel S.p.A.
- Siemens Gamesa
- KBR Inc.
Additional Benefits:
- The market estimate (ME) sheet in Excel format
- 3 months of analyst support
TABLE OF CONTENTS
1 INTRODUCTION
- 1.1 Study Assumptions and Market Definition
- 1.2 Scope of the Study
2 RESEARCH METHODOLOGY
3 EXECUTIVE SUMMARY
4 MARKET LANDSCAPE
- 4.1 Market Overview
- 4.2 Market Drivers
- 4.2.1 Rising environmental awareness and corporate net-zero mandates
- 4.2.2 Stringent decarbonization policies and carbon pricing
- 4.2.3 Rapid cost decline of IoT sensors and cloud platforms
- 4.2.4 AI-driven carbon-accounting platforms embedded in ERP stacks
- 4.2.5 Surge in green data-centre investments for Gen-AI workloads
- 4.2.6 Blockchain-based voluntary carbon insetting marketplaces
- 4.3 Market Restraints
- 4.3.1 High upfront integration and lifecycle costs
- 4.3.2 Shortage of green-tech talent in emerging regions
- 4.3.3 Scrutiny of digital-infrastructure Scope-2 emissions
- 4.3.4 Critical-mineral supply-chain bottlenecks
- 4.4 Supply-Chain Analysis
- 4.5 Regulatory Landscape
- 4.6 Technological Outlook
- 4.7 Porter's Five Forces Analysis
- 4.7.1 Bargaining Power of Buyers
- 4.7.2 Bargaining Power of Suppliers
- 4.7.3 Threat of New Entrants
- 4.7.4 Threat of Substitutes
- 4.7.5 Intensity of Competitive Rivalry
- 4.8 Assesment of Macroeconomic Factors on the market
5 MARKET SIZE AND GROWTH FORECASTS (VALUE)
- 5.1 By Component
- 5.1.1 Solutions
- 5.1.2 Services
- 5.2 By Technology
- 5.2.1 Internet of Things (IoT)
- 5.2.2 Artificial Intelligence and Analytics
- 5.2.3 Digital Twin
- 5.2.4 Cloud Computing
- 5.2.5 Blockchain
- 5.2.6 Other Emerging Technologies
- 5.3 By Application
- 5.3.1 Green Building
- 5.3.2 Carbon Footprint Management
- 5.3.3 Air and Water Pollution Monitoring
- 5.3.4 Weather Monitoring and Forecasting
- 5.3.5 Crop Monitoring
- 5.3.6 Others
- 5.4 By End-user Industry
- 5.4.1 Energy and Utilities
- 5.4.2 Manufacturing
- 5.4.3 Transportation and Logistics
- 5.4.4 Agriculture
- 5.4.5 Construction and Real-estate
- 5.4.6 IT and Telecom
- 5.4.7 Government and Public Sector
- 5.4.8 Other Industries
- 5.5 By Geography
- 5.5.1 North America
- 5.5.1.1 United States
- 5.5.1.2 Canada
- 5.5.1.3 Mexico
- 5.5.2 South America
- 5.5.2.1 Brazil
- 5.5.2.2 Argentina
- 5.5.2.3 Rest of South America
- 5.5.3 Europe
- 5.5.3.1 Germany
- 5.5.3.2 United Kingdom
- 5.5.3.3 France
- 5.5.3.4 Italy
- 5.5.3.5 Spain
- 5.5.3.6 Rest of Europe
- 5.5.4 Asia-Pacific
- 5.5.4.1 China
- 5.5.4.2 India
- 5.5.4.3 Japan
- 5.5.4.4 South Korea
- 5.5.4.5 Australia and New Zealand
- 5.5.4.6 Rest of Asia-Pacific
- 5.5.5 Middle East and Africa
- 5.5.5.1 Middle East
- 5.5.5.1.1 Saudi Arabia
- 5.5.5.1.2 United Arab Emirates
- 5.5.5.1.3 Turkey
- 5.5.5.1.4 Rest of Middle East
- 5.5.5.2 Africa
- 5.5.5.2.1 Nigeria
- 5.5.5.2.2 South Africa
- 5.5.5.2.3 Egypt
- 5.5.5.2.4 Rest of Africa
- 5.5.5.1 Middle East
- 5.5.1 North America
6 COMPETITIVE LANDSCAPE
- 6.1 Market Concentration
- 6.2 Strategic Moves
- 6.3 Market Share Analysis
- 6.4 Company Profiles (includes Global-level Overview, Market-level Overview, Core Segments, Financials as available, Strategic Information, Market Rank/Share, Products and Services, Recent Developments)
- 6.4.1 General Electric
- 6.4.2 IBM Corporation
- 6.4.3 Microsoft Corporation
- 6.4.4 Siemens AG
- 6.4.5 Schneider Electric SE
- 6.4.6 Wolters Kluwer N.V.
- 6.4.7 Oracle Corporation
- 6.4.8 CropX Inc.
- 6.4.9 Engie Impact
- 6.4.10 Sensus (Xylem)
- 6.4.11 Trace Genomics
- 6.4.12 Accuvio (Diligent)
- 6.4.13 Tesla Inc.
- 6.4.14 Vestas Wind Systems
- 6.4.15 ABB Ltd.
- 6.4.16 Cority Software
- 6.4.17 Schneider Electric
- 6.4.18 Enel S.p.A.
- 6.4.19 Siemens Gamesa
- 6.4.20 KBR Inc.
7 MARKET OPPORTUNITIES AND FUTURE OUTLOOK
- 7.1 White-Space and Unmet-Need Assessment

 全球綠色製造設備市場規模、佔有率、趨勢和成長分析報告(2026-2034年)
 綠色科技與永續發展市場-2026-2032年全球市場預測
 綠色科技永續性市場-全球產業規模、佔有率、趨勢、機會、預測:按組件、部署、公司類型、應用、地區和競爭格局分類,2021-2031年
 2026年全球保險公司綠色資訊科技(IT)市場報告
 綠色航太技術市場規模、佔有率和趨勢分析報告:按技術類型、平台、系統整合、最終用途、地區和細分市場預測(2026-2033 年)
 綠色科技與永續發展市場報告:按組件、技術、應用和地區分類(2026-2034年)
 綠色科技與永續發展市場:按技術、應用和地區分類2026年全球綠色技術市場報告綠色技術與永續發展市場規模、佔有率、成長及全球產業分析:按類型、應用和地區分類的洞察,2026-2034年預測
 綠色技術與永續發展市場分析及預測(至2035年):按類型、產品類型、服務、技術、組件、應用、部署狀態、最終用戶和解決方案分類