


 |
市場調查報告書
商品編碼
2119622
處理器:市場佔有率分析、行業趨勢和統計數據、成長預測(2026-2031 年)Processor - Market Share Analysis, Industry Trends & Statistics, Growth Forecasts (2026 - 2031) |
||||||

※ 本網頁內容可能與最新版本有所差異。詳細情況請與我們聯繫。
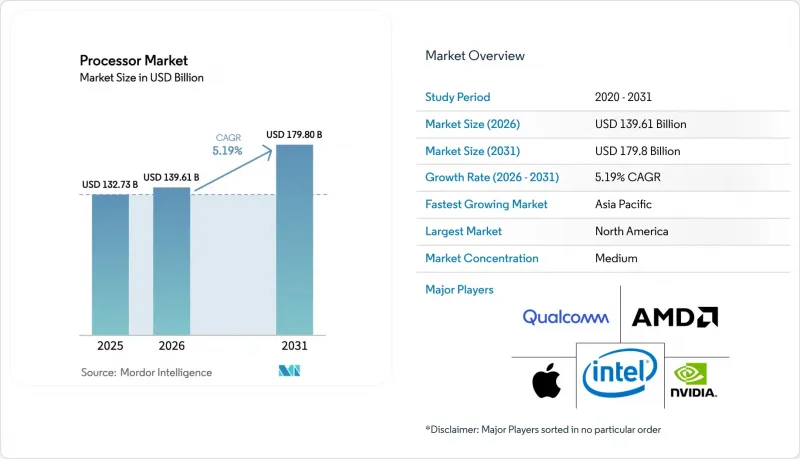
據 Mordor Intelligence 稱,2025 年處理器市值為 1327.3 億美元,預計將從 2026 年的 1396.1 億美元成長到 2031 年的 1798 億美元。
預測期(2026-2031 年)的複合年成長率預計為 5.19%。
本報告按產品類型(CPU、客戶端、伺服器、APU、智慧型手機、平板電腦、智慧電視等)、微架構(x86、Arm、RISC-V、Power)、製造流程(10奈米以上、7-10奈米及其他)、最終用途(家用電子電器、資料中心和雲端、工業和物聯網邊緣等)以及地區進行細分。市場預測以美元(USD)為單位。
全球處理器市場趨勢與洞察
雲端運算、人工智慧和巨量資料工作負載的日益普及
超大規模資料中心業者正在設計和部署客製化晶片,與市售半導體相比,這些晶片具有更高的成本績效。 AWS 的 Trainium2 晶片與 GPU 實例相比,可將 AI 訓練的成本效益提高 30% 至 40%,而Google的 Ironwood TPU 晶片單顆效能可達 4,614 TFLOPS,每個 pod 可擴充至 42.5 exaflops。因此,一個價值 450 億美元的客製化晶片市場已經形成。隨著雲端服務供應商開發自己的晶片設計,傳統 CPU 供應商的利潤空間正受到擠壓。此外,歐洲和亞洲部分地區的資料主權法規正在加劇區域性處理器偏好,並進一步加劇需求格局的片段化。
智慧型手機的廣泛普及
隨著行動電話廠商大力推動設備內人工智慧技術,應用處理器如今都配備了專用的神經網路處理單元(NPU)。蘋果的A18 Pro整合了矩陣式協處理器,而高通驍龍8第四代處理器則透過NPU的改進,力求達到40%的效能提升。 5G調變解調器的單晶片整合降低了15-20%的組件成本,並提高了電池效率。由於更換週期延長,持續的效率提升變得至關重要,而5奈米及以下的尖端製程技術正被大規模應用於高階市場。
先進節點設計人員短缺
晶片製造商正努力招募能夠勝任3奈米以下製程製程的合格工程師。英特爾報告稱,儘管起薪高達20萬美元,但仍有3,000個職缺。台積電已將1,000名台灣員工調往亞利桑那州,以培訓當地新員工。由於學術課程更新速度緩慢,導致技能人才缺口長達5-7年,尤其是在晶片數量激增的關鍵檢驗領域。再加上美國簽證配額限制進一步加劇了人才供應緊張,一些公司開始將設計中心遷往印度和東南亞。
細分市場分析
預計到2025年,CPU將維持63.70%的處理器市場佔有率,而APU預計將以6.32%的複合年成長率成長,這反映出市場對整合CPU-GPU架構(用於本地處理AI推理)的需求不斷成長。隨著需要片上圖形加速的內容創作工作負載增加,APU處理器市場預計將進一步擴張。智慧型手機SoC正逐步拓展至汽車和物聯網領域,進而提升其生命週期價值。同時,智慧電視處理器正受益於8K內容和AI驅動的影像放大技術的發展。在平板電腦市場,由於智慧型手機級半導體的出現,效能差距正在縮小,因此商品化壓力仍然存在。
蘋果的M系列處理器體現了向共用記憶體架構的轉變,消除了PCIe瓶頸;而英特爾的酷睿Ultra處理器整合了48 TOPS的NPU,鞏固了x86架構在人工智慧PC領域的重要性。智慧型手錶、AR/VR和汽車等專業領域正因安全和駕駛輔助法規的日益嚴格而不斷擴大市場佔有率。 ISO 26262等認證流程會將開發週期延長至多24個月,但卻能帶來高價位和高利潤率。
儘管 x86 架構仍主導著處理器市場,預計到 2025 年將佔據 54.10% 的市場佔有率,但 ARM 和 RISC-V 架構正憑藉其高效和柔軟性的授權方式而蓬勃發展。 ARM 核心處理器市場正受益於超大規模資料中心業者營運商的採用。 AWS Graviton 4 和 Google Axion 的能源效率比同等 x86 執行個體高出 60%。英特爾的 AMX 擴展旨在縮小這一差距,但這需要兩年的軟體支援期。
RISC-V 6.47% 的複合年成長率主要得益於其開放性。 SiFive 和 GlobalFoundries 提供車規級設計,滿足高可靠性系統電源架構此細分市場的需求。然而,工具的匱乏預計將使 RISC-V 在主流工作負載中的應用延遲 3 至 5 年。有利於豁免出口管制智慧財產權的監管政策變化正在加速試點部署,預示著 RISC-V 的市場滲透率將在 2028 年後進一步提升。
區域分析
北美地區在《晶片技術創新法案》(CHIPS Act)的資金支持和超大規模資料中心業者的集中佈局的推動下,預計到2025年將佔據41.75%的處理器市場佔有率。台積電位於亞利桑那州的4奈米生產線預計2025年初開始量產,為蘋果和英偉達等公司供貨。同時,英特爾承諾在2029年投資1,000億美元用於晶圓代工產能的擴張。然而,人才短缺和簽證限制仍然是結構性障礙,迫使企業從亞洲引進專業技術。
亞太地區以8.25%的複合年成長率領先,這主要得益於中國的自主設計以及印度100億美元的激勵計劃,這些舉措都在促進區域自主發展。全球生產正進一步東移,這主要受日本台積電-JASM晶圓廠和韓國「系統半導體2030願景」的推動。出口限制導致高階EDA工具對華人企業的供應受限,加速了RISC-V在國內設計的應用。
在歐洲,430億歐元的「晶片法案」支撐著經濟成長,該法案推動了GlobalFoundries德勒斯登工廠的擴建以及英特爾計劃在馬德堡建設新工廠。汽車處理器是歐洲大陸的主要需求來源,這與強大的Tier 1供應鏈密切相關。儘管人事費用較高,但環境法規和GDPR的要求促使OEM廠商優先考慮在區域位置建廠。
雖然中東和非洲正透過政府支持的投資基金進入組裝和測試領域,但先進製造技術仍處於起步階段。
其他好處:
- Excel格式的市場預測(ME)表
- 3個月的分析師支持
目錄
第1章:引言
- 研究假設和市場定義
- 調查範圍
第2章:調查方法
第3章執行摘要
第4章 市場狀況
- 市場概覽
- 市場促進因素
- 智慧型手機普及率不斷上升
- 雲端運算、人工智慧和巨量資料工作負載的日益普及。
- 邊緣運算的日益普及
- 政府對半導體生產能力的激勵措施
- 針對人工智慧最佳化的指令集擴充(例如,AMX、SVE2 等)
- 透過基於晶片組的異質整合降低成本
- 市場限制因素
- 先進節點設計人員短缺
- 對EDA/IP的地緣政治出口管制
- 3nm 下列節點的熱設計約束
- 供應鏈中遵守排放法規的成本
- 宏觀經濟因素的影響
- 監理情勢
- 科技趨勢
- 產業供應鏈分析
- 波特五力分析
第5章 市場規模與成長預測
- 依產品類型
- CPU
- 客戶端(桌上型電腦和筆記型電腦)
- 伺服器
- APU
- 智慧型手機
- 藥片
- 智慧電視
- 智慧音箱
- 其他(智慧型手錶、筆記型電腦、AR/VR、汽車)
- 透過微架構
- x86
- Arm
- RISC-V
- Power
- 透過製造製程節點
- >10 奈米
- 7~10 nm
- 5~6 nm
- 4奈米或更小
- 按最終用途
- 家用電子產品
- 資料中心和雲
- 工業和物聯網邊緣
- 汽車和高級駕駛輔助系統
- 航太/國防
- 按地區
- 北美洲
- 美國
- 加拿大
- 墨西哥
- 南美洲
- 巴西
- 阿根廷
- 其他南美國家
- 歐洲
- 德國
- 英國
- 法國
- 義大利
- 西班牙
- 俄羅斯
- 其他歐洲國家
- 亞太地區
- 中國
- 日本
- 印度
- 韓國
- 東南亞
- 其他亞太國家
- 中東和非洲
- 中東
- 沙烏地阿拉伯
- 阿拉伯聯合大公國
- 土耳其
- 其他中東國家
- 非洲
- 南非
- 奈及利亞
- 其他非洲國家
- 中東
- 北美洲
第6章 競爭情勢
- 市場集中度
- 策略趨勢
- 市佔率分析
- 公司簡介
- Advanced Micro Devices Inc.(AMD)
- Intel Corporation
- Qualcomm Technologies Inc.
- Apple Inc.
- NVIDIA Corporation
- MediaTek Inc.
- Samsung Electronics Co. Ltd.
- Huawei Technologies Co. Ltd.(HiSilicon)
- Broadcom Inc.
- Marvell Technology Group Ltd.
- UNISOC(Shanghai)Technologies Co. Ltd.
- Texas Instruments Inc.
- Renesas Electronics Corporation
- NXP Semiconductors NV
- STMicroelectronics NV
- VIA Technologies Inc.
- SiFive Inc.
- Ampere Computing LLC
- Alibaba Pingtouge(T-Head)
- Esperanto Technologies Inc.
第7章 市場機會與未來展望
According to Mordor Intelligence, the processor market size was valued at USD 132.73 billion in 2025 and estimated to grow from USD 139.61 billion in 2026 to reach USD 179.8 billion by 2031, at a CAGR of 5.19% during the forecast period (2026-2031).
This report is Segmented by Product Type (CPU, Client, Server, APU, Smartphone, Tablet, Smart Television, and More), Micro-Architecture (x86, Arm, RISC-V, and Power), Fabrication Node (More Than 10 Nm, 7-10 Nm, and More), End-Use Application (Consumer Electronics, Data Center and Cloud, Industrial and IoT Edge, and More), and Geography. The Market Forecasts are Provided in Terms of Value (USD).
Global Processor Market Trends and Insights
Growing adoption of cloud, AI and big-data workloads
Hyperscalers now design and deploy custom chips that lift performance-per-dollar versus merchant silicon. AWS Trainium2 improves AI training cost efficiency by 30-40% compared with GPU instances, while Google's Ironwood TPU hits 4,614 TFLOPS per chip and scales to 42.5 exaflops per pod. The resulting USD 45 billion custom-chip opportunity is eroding margins for traditional CPU vendors as cloud operators internalize silicon design. Data-sovereignty mandates in Europe and parts of Asia are reinforcing regional processor preferences, further segmenting demand patterns.
Rising penetration of smartphones
Application processors now ship with dedicated NPUs as handset makers push on-device AI. Apple's A18 Pro integrates matrix coprocessors, and Qualcomm's Snapdragon 8 Gen 4 targets a 40% performance uplift through NPU advancements. The monolithic integration of 5G modems has cut the bill-of-materials cost by 15-20% and lifted battery efficiency. Slower replacement cycles shift emphasis to sustained efficiency, pushing leading-edge nodes below 5 nm into volume for premium tiers.
Talent shortage in advanced node design
Chipmakers face difficulty hiring engineers qualified for 3 nm and below. Intel reported 3,000 open roles despite USD 200,000 starting packages, and TSMC moved 1,000 Taiwanese staff to Arizona to train local hires. Academia's slower curriculum cycles add a 5-7 year skills lag, especially in verification, critical as chiplet counts soar. Visa caps in the U.S. further tighten supply, prompting companies to relocate design centers to India and Southeast Asia.
Other drivers and restraints analyzed in the detailed report include:
- Expanding edge-computing deployments
- Government incentives for semiconductor capacity
- Geopolitical export controls on EDA/IP
For complete list of drivers and restraints, kindly check the Table Of Contents.
Segment Analysis
CPUs retained 63.70% of the processor market share in 2025, yet APUs' 6.32% CAGR underscores demand for unified CPU-GPU fabrics that handle AI inference locally. The processor market size for APUs is projected to increase in tandem with rising creator workloads that need on-chip graphics acceleration. Smartphone SoCs branch into automotive and IoT, extending their lifetime value, while smart-TV processors ride 8 K content and AI upscaling tailwinds. Commodity pressure on tablets persists as phone-class silicon narrows the performance delta.
Apple's M-series exemplifies a shift toward shared-memory architectures that erase PCIe bottlenecks, while Intel's Core Ultra integrates a 48 TOPS NPU to preserve x86 relevance in AI PCs. Specialty categories, smartwatch, AR/VR, and automotive, gain share from regulatory pushes on safety and assisted driving. Certification paths such as ISO 26262 lengthen development by up to 24 months but allow premium pricing and higher margin retention.
x86 still dominates the processor market, holding 54.10% in 2025, but ARM and RISC-V architectures thrive on efficiency and licensing flexibility. Processor market size for ARM cores benefits from hyperscaler adoption: AWS Graviton4 and Google Axion yield up to 60% better energy efficiency over equivalent x86 instances. Intel's AMX extensions aim to offset the gap but hinge on a two-year software-enablement curve.
RISC-V's 6.47% CAGR rests on openness; SiFive and GlobalFoundries bring automotive-grade designs that challenge Power architecture's niche in high-reliability systems. However, tooling gaps delay mainstream workloads by three to five years. Regulatory shifts that favor export-control-free IP accelerate pilot deployments, hinting at deeper market penetration after 2028.
Complete Report Scope:
- By Product Type
- CPU
- Client (Desktop and Laptop)
- Server
- APU
- Smartphone
- Tablet
- Smart Television
- Smart Speakers
- Other (Smartwatch, Notebook, AR/VR, Automotive)
- By Micro-Architecture
- x86
- Arm
- RISC-V
- Power
- By Fabrication Node
- More than 10 nm
- 7-10 nm
- 5-6 nm
- Equal to and less than 4 nm
- By End-Use Application
- Consumer Electronics
- Data Center and Cloud
- Industrial and IoT Edge
- Automotive and ADAS
- Aerospace and Defense
- By Geography
- North America
- United States
- Canada
- Mexico
- South America
- Brazil
- Argentina
- Rest of South America
- Europe
- Germany
- United Kingdom
- France
- Italy
- Spain
- Russia
- Rest of Europe
- Asia-Pacific
- China
- Japan
- India
- South Korea
- South-East Asia
- Rest of Asia-Pacific
- Middle East and Africa
- Middle East
- Saudi Arabia
- United Arab Emirates
- Turkey
- Rest of Middle East
- Africa
- South Africa
- Nigeria
- Rest of Africa
- Middle East
- North America
Geography Analysis
North America controlled 41.75% of the processor market share in 2025, thanks to the CHIPS Act funding and hyperscaler concentration. Volume ramped at TSMC Arizona's 4 nm line in early 2025, supplying Apple and NVIDIA, while Intel pledged USD 100 billion through 2029 for foundry expansion. Talent gaps and visa limits remain structural impediments, forcing companies to import expertise from Asia.
Asia-Pacific posts the fastest 8.25% CAGR as China's indigenous designs and India's USD 10 billion incentives build regional self-reliance. Japan's TSMC-JASM fab and South Korea's System Semiconductor Vision 2030 further tilt global output eastward. Export controls restrict high-end EDA flows to Chinese firms, spurring RISC-V adoption in domestic designs.
Europe sustains growth via the EUR 43 billion Chips Act that backs GlobalFoundries' Dresden expansion and Intel's prospective Magdeburg fab. Automotive processors form the continent's core demand, aligning with a robust Tier-1 supply chain. Environmental and GDPR rules steer OEMs toward regionally located fabs despite higher labor costs.
The Middle East and Africa enter assembly-and-test segments using sovereign investment funds, but advanced fabrication remains nascent.
- Advanced Micro Devices Inc. (AMD)
- Intel Corporation
- Qualcomm Technologies Inc.
- Apple Inc.
- NVIDIA Corporation
- MediaTek Inc.
- Samsung Electronics Co. Ltd.
- Huawei Technologies Co. Ltd. (HiSilicon)
- Broadcom Inc.
- Marvell Technology Group Ltd.
- UNISOC (Shanghai) Technologies Co. Ltd.
- Texas Instruments Inc.
- Renesas Electronics Corporation
- NXP Semiconductors N.V.
- STMicroelectronics N.V.
- VIA Technologies Inc.
- SiFive Inc.
- Ampere Computing LLC
- Alibaba Pingtouge (T-Head)
- Esperanto Technologies Inc.
Additional Benefits:
- The market estimate (ME) sheet in Excel format
- 3 months of analyst support
TABLE OF CONTENTS
1 INTRODUCTION
- 1.1 Study Assumptions and Market Definition
- 1.2 Scope of the Study
2 RESEARCH METHODOLOGY
3 EXECUTIVE SUMMARY
4 MARKET LANDSCAPE
- 4.1 Market Overview
- 4.2 Market Drivers
- 4.2.1 Rising penetration of smartphones
- 4.2.2 Growing adoption of cloud, AI and big-data workloads
- 4.2.3 Expanding edge-computing deployments
- 4.2.4 Government incentives for semiconductor capacity
- 4.2.5 AI-optimized instruction-set extensions (e.g., AMX, SVE2)
- 4.2.6 Chiplet-based heterogeneous integration cost savings
- 4.3 Market Restraints
- 4.3.1 Talent shortage in advanced node design
- 4.3.2 Geopolitical export controls on EDA/IP
- 4.3.3 Thermal design limits in sub-3 nm nodes
- 4.3.4 Supply-chain emissions compliance costs
- 4.4 Impact of Macroeconomic Factors
- 4.5 Regulatory Landscape
- 4.6 Technology Outlook
- 4.7 Industry Supply Chain Analysis
- 4.8 Porter's Five Forces Analysis
- 4.8.1 Bargaining Power of Suppliers
- 4.8.2 Bargaining Power of Consumers
- 4.8.3 Threat of New Entrants
- 4.8.4 Threat of Substitutes
- 4.8.5 Intensity of Competitive Rivalry
5 MARKET SIZE AND GROWTH FORECASTS (VALUE)
- 5.1 By Product Type
- 5.1.1 CPU
- 5.1.2 Client (Desktop and Laptop)
- 5.1.3 Server
- 5.1.4 APU
- 5.1.5 Smartphone
- 5.1.6 Tablet
- 5.1.7 Smart Television
- 5.1.8 Smart Speakers
- 5.1.9 Other (Smartwatch, Notebook, AR/VR, Automotive)
- 5.2 By Micro-Architecture
- 5.2.1 x86
- 5.2.2 Arm
- 5.2.3 RISC-V
- 5.2.4 Power
- 5.3 By Fabrication Node
- 5.3.1 More than 10 nm
- 5.3.2 7-10 nm
- 5.3.3 5-6 nm
- 5.3.4 Equal to and less than 4 nm
- 5.4 By End-Use Application
- 5.4.1 Consumer Electronics
- 5.4.2 Data Center and Cloud
- 5.4.3 Industrial and IoT Edge
- 5.4.4 Automotive and ADAS
- 5.4.5 Aerospace and Defense
- 5.5 By Geography
- 5.5.1 North America
- 5.5.1.1 United States
- 5.5.1.2 Canada
- 5.5.1.3 Mexico
- 5.5.2 South America
- 5.5.2.1 Brazil
- 5.5.2.2 Argentina
- 5.5.2.3 Rest of South America
- 5.5.3 Europe
- 5.5.3.1 Germany
- 5.5.3.2 United Kingdom
- 5.5.3.3 France
- 5.5.3.4 Italy
- 5.5.3.5 Spain
- 5.5.3.6 Russia
- 5.5.3.7 Rest of Europe
- 5.5.4 Asia-Pacific
- 5.5.4.1 China
- 5.5.4.2 Japan
- 5.5.4.3 India
- 5.5.4.4 South Korea
- 5.5.4.5 South-East Asia
- 5.5.4.6 Rest of Asia-Pacific
- 5.5.5 Middle East and Africa
- 5.5.5.1 Middle East
- 5.5.5.1.1 Saudi Arabia
- 5.5.5.1.2 United Arab Emirates
- 5.5.5.1.3 Turkey
- 5.5.5.1.4 Rest of Middle East
- 5.5.5.2 Africa
- 5.5.5.2.1 South Africa
- 5.5.5.2.2 Nigeria
- 5.5.5.2.3 Rest of Africa
- 5.5.5.1 Middle East
- 5.5.1 North America
6 COMPETITIVE LANDSCAPE
- 6.1 Market Concentration
- 6.2 Strategic Moves
- 6.3 Market Share Analysis
- 6.4 Company Profiles (includes Global level Overview, Market level overview, Core Segments, Financials as available, Strategic Information, Market Rank/Share for key companies, Products and Services, and Recent Developments)
- 6.4.1 Advanced Micro Devices Inc. (AMD)
- 6.4.2 Intel Corporation
- 6.4.3 Qualcomm Technologies Inc.
- 6.4.4 Apple Inc.
- 6.4.5 NVIDIA Corporation
- 6.4.6 MediaTek Inc.
- 6.4.7 Samsung Electronics Co. Ltd.
- 6.4.8 Huawei Technologies Co. Ltd. (HiSilicon)
- 6.4.9 Broadcom Inc.
- 6.4.10 Marvell Technology Group Ltd.
- 6.4.11 UNISOC (Shanghai) Technologies Co. Ltd.
- 6.4.12 Texas Instruments Inc.
- 6.4.13 Renesas Electronics Corporation
- 6.4.14 NXP Semiconductors N.V.
- 6.4.15 STMicroelectronics N.V.
- 6.4.16 VIA Technologies Inc.
- 6.4.17 SiFive Inc.
- 6.4.18 Ampere Computing LLC
- 6.4.19 Alibaba Pingtouge (T-Head)
- 6.4.20 Esperanto Technologies Inc.
7 MARKET OPPORTUNITIES AND FUTURE OUTLOOK
- 7.1 White-space and Unmet-need Assessment

 超低功耗人工智慧語音處理器市場:全球市場預測(2026-2032年)多核心MCU市場:全球市場預測,2026-2032年影像訊號處理器 (ISP) 市場:全球市場預測,2026-2032 年多核心處理器市場:以核心數量、處理器架構、應用、通路分類,全球預測(2026-2032年)
 多核心光處理器市場分析及預測(至2035年):依類型、產品類型、服務、技術、組件、應用、材料類型、設備、最終用戶、功能分類
 2026年全球多核心處理器市場報告
 多核心處理器市場 - 全球產業規模、佔有率、趨勢、機會、預測:按類型、最終用戶、地區和競爭格局分類,2021-2031年影像訊號處理設備市場-全球產業規模、佔有率、趨勢、機會與預測:按組件、影像處理方法、影像類型、技術、應用、地區和競爭格局分類,2021-2031年影像訊號處理設備市場(按組件、製程節點、整合類型、解析度支援、應用和分銷管道分類),全球預測,2026-2032年相機影像訊號處理器市場按產品類型、應用、最終用戶和分銷管道分類 - 全球預測 2026-2032