

 |
市場調查報告書
商品編碼
2119570
北美大樓自動化系統:市場佔有率分析、產業趨勢與統計及成長預測(2026-2031 年)North America Building Automation Systems - Market Share Analysis, Industry Trends & Statistics, Growth Forecasts (2026 - 2031) |
||||||

※ 本網頁內容可能與最新版本有所差異。詳細情況請與我們聯繫。
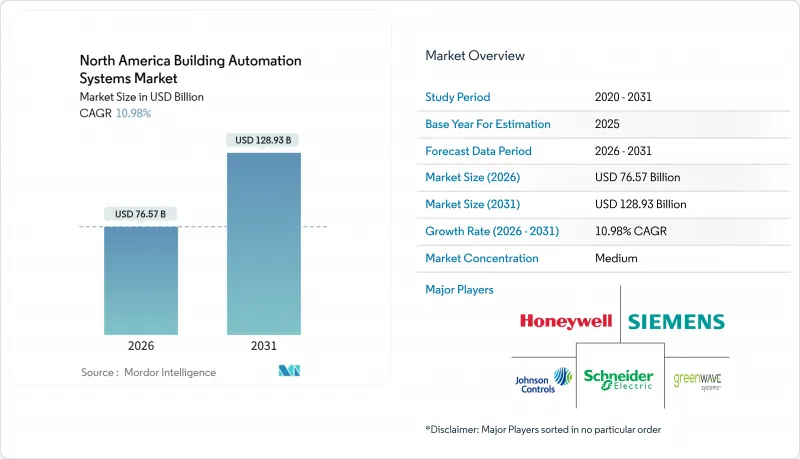
根據 Mordor Intelligence 預測,北美大樓自動化系統市場規模預計將在 2026 年達到 765.7 億美元,到 2031 年將擴大到 1,289.3 億美元,複合年成長率為 10.98%。
本報告按組件(硬體、軟體、服務)、系統類型(暖通空調控制系統、照明控制系統、安防和門禁系統等)、通訊技術(有線、無線)、最終用戶(住宅、商業等)和國家進行細分。以上所有細分市場的規模和預測均以美元計價。
北美大樓自動化系統市場趨勢與洞察
引入人工智慧驅動的預測性維護和分析
機器學習模型將來自感測器的原始數據轉化為早期預警診斷訊息,能夠提前三天預測設備劣化,準確率高達 85%。這可以將緊急維修減少 40%,並將資產壽命延長 15%。基於訂閱的分析平台使供應商能夠保證運作,並將收入來源從一次性零件銷售轉向按績效付費的合約。在 2025 年涵蓋 1200 棟建築的部署專案中,聚合的雲端資料展示了該平台如何幫助營運商對其整個資產組合中的異常情況進行基準測試——這是單站點分析無法實現的。整合推理引擎的邊緣控制器現在可以在本地運行演算法,將延遲降低至 50 毫秒,並降低了對雲端頻寬的需求。
聯邦和州政府獎勵加速建築脫碳進程
《通貨膨脹控制法案》將節能減排50%項目的179D條款扣除額提高至每平方英尺5美元,使簡單投資回收期從8年縮短至4年。紐約市第97號地區法案規定,每噸二氧化碳當量排放量超過排放上限將被處以268美元的罰款,這使得自動化成為合規工具,而非可選項。加州2025年第24號法案修正案強制要求大規模暖通空調系統配備故障偵測功能,實際上使90%的新建商業設施實現了自動化標準化。這種胡蘿蔔加大棒的策略已將採購週期從18個月縮短至9個月,因為業主們都在爭相在2032年逐步淘汰之前獲得獎勵。
維修現有建築物會產生大量的初期成本。
全面維修的成本從每平方英尺2.50美元到6美元不等,一個10萬平方英尺的專案總成本約為25萬至60萬美元。對於小規模業主而言,如果沒有補貼,需要7到10年才能收回投資,遠遠超過任何支出通常需要5年才能收回成本的期限。雖然無線套件可以降低高達40%的人事費用,但硬體成本仍會對現金流造成壓力。在西雅圖的一個試點計畫中,92%的參與者獲得了添加到水電費帳單中的無息貸款,但要擴大規模,需要獲得監管部門的批准,而這一過程可能需要長達兩年的時間。
細分市場分析
預計到2031年,軟體市場將以每年11.55%的速度成長,並在2025年超過硬體在北美大樓自動化系統市場46.84%的佔有率,因為雲端平台可以將設備數據轉化為經常性收入。預計到2025年,光是江森自控一家公司在大樓自動化系統軟體市場的規模就將達到12億美元,年增34%。業主傾向於選擇營運支出合約(OPEX),這種合約允許他們在擴展業務規模的同時避免資產折舊免稅額。由於商品化導致控制器價格每年下降8%至12%,硬體利潤率正在萎縮,促使製造商將設備與分析服務訂閱捆綁銷售。
邊緣運算正在模糊不同類別之間的界限。新型控制器可在本地執行機器學習推理,將延遲從 500 毫秒降低到 50 毫秒,同時減少出站流量。業務收益正從故障修復轉向效能保證,如果供應商共用成本節約,則可獲得 25% 的溢價。這些變化表明,競爭優勢正從專有設備轉向數據生態系統,隨著每增加一棟建築,演算法的準確性都會提升。
能源管理和分析平台正以每年 11.74% 的速度以最快的速度擴張,成為所有系統類型中成長最快的。這些平台能夠提前一天以 92% 的準確率預測負荷,並實現預冷以避免尖峰時段時段的高額費用,從而降低高達 25% 的公用事業成本。到 2025 年,暖通空調 (HVAC) 控制系統將佔據北美大樓自動化系統市場 39.42% 的佔有率,但隨著 A 級辦公室市場日益飽和,其成長速度正在放緩。照明系統正受益於無線性能驗證工具,這些工具可將安裝時間縮短 40%,並提高維修的可行性。
整合式控制面板現已將門禁系統與暖通空調分區系統連接起來,從而消除了無人區域的能源浪費。消防和生命安全升級改造正按照監管要求進行。 2025 年版 NFPA 72 擴大了連網偵測器的要求,使適用的維修專案數量增加了 18%。由於公用事業公司重視柔軟性,PJM 在 2025 年為需量反應支付了每千瓦時 85 美元的費用。該能源平台正在開拓新的收入來源,並將利潤率提高了 300 個基點。
其他好處:
- Excel格式的市場預測(ME)表
- 3個月的分析師支持
目錄
第1章:引言
- 研究假設和市場定義
- 調查範圍
第2章:調查方法
第3章執行摘要
第4章 市場狀況
- 市場概覽
- 市場促進因素
- 引入人工智慧驅動的預測性維護和分析
- 聯邦和州政府獎勵加速建築脫碳進程
- 互聯式暖通空調維修專案的快速擴張
- 企業ESG舉措正在推動對智慧建築的投資。
- 遷移到開放且可互通的 BACnet/IP 和 MQTT 協議
- 疫情後對室內空氣品質監測的需求增加
- 市場限制因素
- 現有建築維修初期成本高昂
- 建築自動化系統整合和網路安全領域技術純熟勞工短缺
- 網路安全合規成本不斷上升
- 半導體供應鏈的波動正在影響控制器的供應。
- 產業價值鏈分析
- 監理情勢
- 技術展望
- 波特五力分析
- 宏觀經濟因素對市場的影響
- 投資分析
第5章 市場規模與成長預測
- 按組件
- 硬體
- 軟體
- 服務
- 依系統類型
- 暖通空調控制系統
- 照明控制系統
- 安全和存取控制系統
- 能源管理與分析平台
- 消防和災害預防系統
- 透過通訊技術
- 有線
- 無線的
- 最終用戶
- 住宅
- 商業
- 產業
- 機構/政府
- 國家
- 美國
- 加拿大
- 墨西哥
第6章 競爭情勢
- 市場集中度
- 策略趨勢
- 市佔率分析
- 公司簡介
- Johnson Controls International PLC
- Honeywell International Inc.
- Siemens AG
- Schneider Electric SE
- Greenwave Systems Inc.
- Uplight Inc.
- Panasonic Holdings Corporation
- ABB Ltd.
- Carrier Global Corporation
- Trane Technologies plc
- Rockwell Automation Inc.
- Legrand SA
- Lutron Electronics Co. Inc.
- Cisco Systems Inc.
- Delta Controls Inc.
- Distech Controls Inc.
- Emerson Electric Co.
- Crestron Electronics Inc.
- Hubbell Incorporated
第7章 市場機會與未來展望
According to Mordor Intelligence, the North America building automation systems market size reached USD 76.57 billion in 2026 and is forecast to climb to USD 128.93 billion by 2031, reflecting a 10.98% CAGR.
This report is Segmented by Component (Hardware, Software, and Services), System Type (HVAC Control Systems, Lighting Control Systems, Security and Access Control Systems, and More), Communication Technology (Wired, and Wireless), End-User (Residential, Commercial, and More), and Country. The Market Sizes and Forecasts are Provided in Terms of Value in USD for all the Above Segments.
North America Building Automation Systems Market Trends and Insights
Adoption Of AI Enabled Predictive Maintenance And Analytics
Machine-learning models convert raw sensor feeds into early-warning diagnostics that predict equipment degradation three days ahead with 85% accuracy, cutting emergency repairs by 40% and lengthening asset life by 15%. Subscription-based analytics platforms allow vendors to guarantee uptime, shifting revenue from one-time parts sales to performance contracts. A 2025 deployment across 1,200 buildings demonstrated that aggregated cloud data helps operators benchmark anomalies portfolio-wide, a task single-site analysis cannot match. Edge controllers embedding inference engines now execute algorithms locally, trimming latency to 50 milliseconds and reducing cloud bandwidth needs.
Federal And State Incentives Accelerating Building Decarbonization
The Inflation Reduction Act increased the Section 179D deduction to USD 5.00 per square foot for projects hitting 50% energy savings, halving simple payback from eight to four years. New York City's Local Law 97 fines USD 268 per tonne of CO2-equivalent emissions above caps, converting automation into a compliance tool rather than a discretionary upgrade. California's 2025 Title 24 update mandates fault detection on large HVAC systems, effectively making automation standard in 90% of new commercial installs. Combined carrots and sticks have compressed procurement cycles from 18 months to nine as owners race to secure incentives before the 2032 phase-down.
High Upfront Retrofit Costs For Legacy Buildings
Comprehensive retrofits cost USD 2.50-USD 6.00 per square foot, pushing a 100,000 square-foot project to USD 250,000-USD 600,000. Smaller landlords face 7-10 year paybacks without rebates, exceeding the five-year hurdle typical of discretionary spending. Wireless kits trim labor by up to 40% but hardware still strains cash flow. On-bill, zero-interest utility financing reached 92% participation in a Seattle pilot, yet scaling needs regulatory approval that can take two years.
Other drivers and restraints analyzed in the detailed report include:
- Rapid Growth Of Connected HVAC Retrofit Projects
- Corporate ESG Commitments Driving Smart Building Investments
- Skilled Labor Shortage For BAS Integration And Cybersecurity
For complete list of drivers and restraints, kindly check the Table Of Contents.
Segment Analysis
Software grew 11.55% annually through 2031, outpacing hardware's 46.84% of North America building automation systems market share in 2025 as cloud platforms convert device data into recurring fees. The building automation systems market size for software reached USD 1.2 billion at Johnson Controls alone in 2025, up 34% year over year. Owners favor opex contracts that avoid capital depreciation while scaling across portfolios. Hardware margins are tightening as commoditization pushes controller prices down by 8%-12% annually, prompting manufacturers to bundle devices with analytics subscriptions.
Edge computing blurs category lines. New controllers perform machine-learning inference locally, cutting latency from 500 milliseconds to 50 milliseconds and reducing outbound traffic. Service revenue pivots from break-fix calls to performance guarantees, commanding a 25% premium when vendors share savings. These shifts indicate that competitive advantage is migrating away from proprietary devices toward data ecosystems that improve algorithm accuracy with every additional building.
Energy management and analytics platforms are expanding at 11.74% a year, the fastest pace among system types. They forecast load a day ahead with 92% accuracy, enabling pre-cooling that avoids peak tariffs and trims utility bills by up to 25%. HVAC control retained 39.42% of the 2025 revenue share in the North America building automation systems market, yet its growth moderates as saturation rises in Class A offices. Lighting systems benefit from wireless commissioning tools that reduce installation time by 40% and lift retrofit viability.
Unified dashboards now link access control with HVAC zoning, eliminating energy waste from unoccupied areas. Fire and life-safety upgrades follow code mandates; the 2025 edition of NFPA 72 broadened networked detector requirements, growing the addressable retrofit pool by 18%. As utilities reward flexibility, PJM paid USD 85 per kilowatt-hour for demand response in 2025. Energy platforms unlock a new revenue stream, boosting returns by 300 basis points.
Complete Report Scope:
- By Component
- Hardware
- Software
- Services
- By System Type
- HVAC Control Systems
- Lighting Control Systems
- Security and Access Control Systems
- Energy Management and Analytics Platforms
- Fire and Life Safety Systems
- By Communication Technology
- Wired
- Wireless
- By End-User
- Residential
- Commercial
- Industrial
- Institutional / Government
- By Country
- United States
- Canada
- Mexico
List of Companies Covered in this Report:
- Johnson Controls International PLC
- Honeywell International Inc.
- Siemens AG
- Schneider Electric SE
- Greenwave Systems Inc.
- Uplight Inc.
- Panasonic Holdings Corporation
- ABB Ltd.
- Carrier Global Corporation
- Trane Technologies plc
- Rockwell Automation Inc.
- Legrand SA
- Lutron Electronics Co. Inc.
- Cisco Systems Inc.
- Delta Controls Inc.
- Distech Controls Inc.
- Emerson Electric Co.
- Crestron Electronics Inc.
- Hubbell Incorporated
Additional Benefits:
- The market estimate (ME) sheet in Excel format
- 3 months of analyst support
TABLE OF CONTENTS
1 INTRODUCTION
- 1.1 Study Assumptions and Market Definition
- 1.2 Scope of the Study
2 RESEARCH METHODOLOGY
3 EXECUTIVE SUMMARY
4 MARKET LANDSCAPE
- 4.1 Market Overview
- 4.2 Market Drivers
- 4.2.1 Adoption of AI-Enabled Predictive Maintenance and Analytics
- 4.2.2 Federal and State Incentives Accelerating Building Decarbonization
- 4.2.3 Rapid Growth of Connected HVAC Retrofit Projects
- 4.2.4 Corporate ESG Commitments Driving Smart Building Investments
- 4.2.5 Move Toward Open Interoperable BACnet/IP and MQTT Protocols
- 4.2.6 Emerging Demand for Indoor Air Quality Monitoring Post-Pandemic
- 4.3 Market Restraints
- 4.3.1 High Upfront Retrofit Costs for Legacy Buildings
- 4.3.2 Skilled Labor Shortage for BAS Integration and Cybersecurity
- 4.3.3 Rising Cyber-Security Compliance Costs
- 4.3.4 Semiconductor Supply Chain Volatility Impacting Controller Availability
- 4.4 Industry Value-Chain Analysis
- 4.5 Regulatory Landscape
- 4.6 Technological Outlook
- 4.7 Porter's Five Forces Analysis
- 4.7.1 Bargaining Power of Suppliers
- 4.7.2 Bargaining Power of Consumers
- 4.7.3 Threat of New Entrants
- 4.7.4 Threat of Substitutes
- 4.7.5 Intensity of Competitive Rivalry
- 4.8 Impact of Macroeconomic Factors on the Market
- 4.9 Investment Analysis
5 MARKET SIZE AND GROWTH FORECASTS (VALUE)
- 5.1 By Component
- 5.1.1 Hardware
- 5.1.2 Software
- 5.1.3 Services
- 5.2 By System Type
- 5.2.1 HVAC Control Systems
- 5.2.2 Lighting Control Systems
- 5.2.3 Security and Access Control Systems
- 5.2.4 Energy Management and Analytics Platforms
- 5.2.5 Fire and Life Safety Systems
- 5.3 By Communication Technology
- 5.3.1 Wired
- 5.3.2 Wireless
- 5.4 By End-User
- 5.4.1 Residential
- 5.4.2 Commercial
- 5.4.3 Industrial
- 5.4.4 Institutional / Government
- 5.5 By Country
- 5.5.1 United States
- 5.5.2 Canada
- 5.5.3 Mexico
6 COMPETITIVE LANDSCAPE
- 6.1 Market Concentration
- 6.2 Strategic Moves
- 6.3 Market Share Analysis
- 6.4 Company Profiles (includes Global Level Overview, Market Level Overview, Core Segments, Financials as available, Strategic Information, Market Rank/Share, Products and Services, Recent Developments)
- 6.4.1 Johnson Controls International PLC
- 6.4.2 Honeywell International Inc.
- 6.4.3 Siemens AG
- 6.4.4 Schneider Electric SE
- 6.4.5 Greenwave Systems Inc.
- 6.4.6 Uplight Inc.
- 6.4.7 Panasonic Holdings Corporation
- 6.4.8 ABB Ltd.
- 6.4.9 Carrier Global Corporation
- 6.4.10 Trane Technologies plc
- 6.4.11 Rockwell Automation Inc.
- 6.4.12 Legrand SA
- 6.4.13 Lutron Electronics Co. Inc.
- 6.4.14 Cisco Systems Inc.
- 6.4.15 Delta Controls Inc.
- 6.4.16 Distech Controls Inc.
- 6.4.17 Emerson Electric Co.
- 6.4.18 Crestron Electronics Inc.
- 6.4.19 Hubbell Incorporated
7 MARKET OPPORTUNITIES AND FUTURE OUTLOOK
- 7.1 White-Space and Unmet-Need Assessment

 大樓自動化系統市場-2026-2032年全球市場預測
 全球建築自動化與控制系統市場:機會與策略展望(至2035年)
 大樓自動化系統市場:依系統、應用和地區分類2026年全球商業建築市場報告2026年全球大樓自動化系統市場報告2026年全球建築自動化與控制系統市場報告商業建築市場:2026-2032年全球市場預測(依類型、建築風格、建築系統、建築規模及所有權狀況分類)
 KNX產品全球市場規模、佔有率、趨勢和成長分析報告(2026-2034年)建築自動化軟體市場:按組件類型、最終用戶類型、應用和部署模式分類-2026-2032年全球市場預測智慧建築自動化技術市場:按組件、連接方式、應用和最終用戶分類-2026-2032年全球預測