


 |
市場調查報告書
商品編碼
2119325
通訊業資本支出(Capex)優先追蹤工具:市場佔有率分析、產業趨勢與統計、成長預測(2026-2031 年)Telecom Capex Prioritization Tracker - Market Share Analysis, Industry Trends & Statistics, Growth Forecasts (2026 - 2031) |
||||||

※ 本網頁內容可能與最新版本有所差異。詳細情況請與我們聯繫。
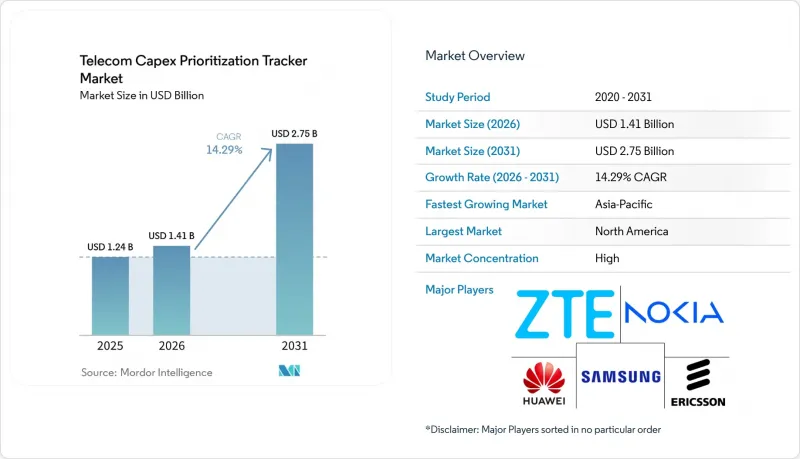
據 Mordor Intelligence 稱,2025 年通訊業支出 (Capex) 優先追蹤工具的市場價值為 12.4 億美元,預計到 2031 年將從 2026 年的 14.1 億美元成長至 27.5 億美元,預測期(2026-2031 年)的複合年成長率為 14.29%。
本報告依投資類別(安裝與維護、無線接取網路設備等)、技術(5G網路基礎設施、4G LTE網路維護等)、網路資產類型(有線接取、無線接取等)、資金來源(行動網路業者等)及地區進行分類。市場預測以美元計價。
全球通訊業資本支出 (Capex) 優先追蹤工具市場趨勢與洞察
5G獨立組網和網路密度
從5G非獨立組網(NSA)架構到獨立組網(SA)架構的過渡是通訊業資本支出(Capex)優先追蹤工具市場中衡量資本配置的關鍵指標。截至2026年3月,已有95家業者推出商用5G獨立網路服務,較2025年第一季成長42%。根據同一資訊來源,已有35家業者投資5G-Advanced,其中11家已推出商用服務。這些項目需要對封包核心網路、編配系統、傳輸鏈路和無線網路進行升級,而不僅僅是購買單一無線設備。在中國,截至2025年底,已部署483.8萬個5G基地台,5G-Advanced覆蓋範圍擴展至330多個城市。儘管無線層已不斷擴展,但這仍然催生了對跨鏈路傳輸(X-Haul)和核心網路容量的需求。因此,部署狀態、軟體準備情況和傳輸限制是決定投資優先順序的關鍵因素。
光纖寬頻和固定無線存取的擴展
光纖業務在通訊業的資本支出(Capex)優先追蹤工具市場中佔據越來越重要的地位,因為它支撐著住宅寬頻、行動回程和企業連接。 2026年3月,AT&T宣布了一項為期五年、總額超過2500億美元的美國投資計劃,目標是在2026年底前將其光纖網路擴展到4000萬個地點,並在2030年之前擴展到6000萬個地點。 2026年4月,T-Mobile宣布向兩家光纖合資企業投資27億美元,目標在2026年底前新增180萬個光纖安裝點。固定無線存取也日益被視為不僅是遍遠地區的替代方案,更是光纖的補充連結。由於光纖資產不僅服務於寬頻用戶,還作為行動通訊和資料中心的流量路徑,因此其分配比單一接取網路專案的分配更為複雜。這些綜合應用支撐著通訊業資本支出 (Capex) 優先追蹤工具的市場,因為電信業者可以協調其固定線路和無線資本計畫。
成熟市場資本密集度正常化
在一些已開發市場,5G網路初期建設已達頂峰,電信業者目前正專注於部分升級和維護工作。中國移動計畫在2026年投入1,366億元人民幣(約189億美元)用於資本支出,較去年同期下降9.5%。儘管其在運算能力方面的投資成長了62.4%,達到378億元人民幣(約56億美元),但對電信網路的投資卻下降了20.3%。德國電信計劃在2025年投資169億歐元(約183億美元)用於網路基礎建設。這顯示其持續投入,但也暗示著維護和升級的趨勢正在趨於成熟。由於運算和雲端運算相關項目與傳統電信網路預算密切相關,這種轉變使得支出項目之間的比較變得困難。在通訊業資本支出 (Capex) 優先追蹤工具市場中,有必要明確區分這些用途,而不能假設資本支出總額的減少反映了所有網路資產需求的下降。
細分市場分析
到2025年,無線接取網路設備將佔通訊業支出(Capex)優先追蹤工具市場佔有率的38.24%。這反映了中頻段5G的持續應用,以確保都市區、郊區和通訊業。核心網路基礎設施也發揮重要作用,因為向5G獨立組網的過渡除了無線相關工作外,還需要對封包核心網路和編配進行升級。隨著營運商逐步淘汰3G和銅纜資產並更換不再運作的設備,安裝和維護工作將持續產生需求。
預計2026年至2031年間,光纖和固定寬頻基礎設施的複合年成長率將達到15.47%,成為該領域成長最快的產業。 「光纖到府 (FTTP)」計畫正在北美、亞太和歐洲的本地及農村地區擴展。寬頻光纖線路也可用作資料中心客戶的暗光纖線路,從而利用同一套實體資產創造另一項收入來源。諾基亞參與了北達科他州一條人工智慧最佳化的光纖傳輸線路項目,該線路設計處理能力高達400 Tbps,連接了重要的資料中心開發區和大芝加哥大都會圈。 「其他」類別包括開放式無線接取網路 (Open RAN) 軟體、衛星回程傳輸整合和專用5G設備,這些項目可能需要在部署過程中進行單獨追蹤。
至2025年,5G網路基礎設施將佔技術支出的42.13%。這一比例反映了新興國家電信網路發展尚不完善,以及已開發國家向5G獨立組網(SA)升級的週期。儘管兩種應用情境下的投資動機有所不同,但5G仍是一項重要的預算項目。電信業者需要無線、核心網路和傳輸組件才能有效提供SA服務。 5G-Advanced的發展進一步增加了通訊業資本支出(Capex)優先追蹤工具市場對軟體和網路控制的需求。
預計從2026年到2031年,光纖到府(FTTP)將以16.27%的複合年成長率成長。 T-Mobile在合資企業中投資27億美元,以及AT&T計畫建置光纖網路,都體現了美國目前在光纖領域的投資規模。在5G覆蓋不足的地區以及需要穩定可靠性的專用網路應用中,4G LTE仍然必不可少。 425億美元的BEAD計畫支持寬頻設備的公私合作採購。其他技術包括衛星回程傳輸和開放式無線存取網(Open RAN),預計到2031年,技術格局將取決於商業部署的速度。
區域分析
到2025年,北美將佔據通訊業資本支出(Capex)優先追蹤工具31.24%的市場佔有率。 AT&T的五年美國投資計畫超過2500億美元,涵蓋光纖、5G家庭網路、FirstNet和衛星通訊。隨著Verizon完成對Frontier的收購,該公司的光纖業務已從15個州擴展到31個州和華盛頓特區。 BEAD計畫為商業性部署計畫新增了425億美元的公共寬頻資金。
預計亞太地區將成為所有地區中複合年成長率最高的地區,2026年至2031年將達15.83%。中國移動計畫在2026年投入1,366億元人民幣(189億美元)的資本支出,並將運算能力網路預算增加至378億元人民幣(56億美元)。中國聯通計劃在2026會計年度投入500億元人民幣(69億美元)的資本支出,其中超過35%將用於運算能力建置。 Reliance Jio在2026會計年度投資152億美元,固定寬頻用戶達2,710萬人。 NTT Docomo維持其2025會計年度的資本支出在8,575億元人民幣(57億美元)不變,並將資金用於5G網路擴展和人工智慧驅動的網路管理。
預計到2025年,歐洲網路基礎設施總投資將達到169億歐元(183億美元),其中德國電信在德國的投資額為59億歐元(64億美元)。 Virgin Media O2決定在2026年投資7億英鎊(8.95億美元)用於行動通訊業務。中東地區是資本密集型地區,Mobilly報告稱,其2025會計年度的資本支出為58.3億沙烏地里亞爾(15.5億美元),並在61個城市部署了超過7600個5G基地台。非洲的成長主要由光纖和行動通訊領域的投資所驅動,例如南非電信公司 Telkom 在 2026 會計年度的資本支出高達 64.3 億蘭特(約 3.5 億美元)。在南美洲,固定寬頻和光纖通訊軟體的投資發揮著更為主導的作用,例如 Cirion 與 Ciena 和 Carma 合作開發的「網路即服務 (NaaS)」專案。
其他好處:
- Excel格式的市場預測(ME)表
- 3個月的分析師支持
目錄
第1章:引言
- 研究假設和市場定義
- 調查範圍
第2章:調查方法
第3章執行摘要
第4章 市場狀況
- 市場概覽
- 市場促進因素
- 5G獨立組網和網路密度
- 光纖寬頻和固定無線存取的擴展
- 人工智慧資料中心之間的互聯互通以及對雲端原生網路的投資
- 公共部門互聯互通和數位主權計劃
- 與 6G 研究和商業化前基礎設施開發相關的措施。
- 節能電網的現代化與自動化
- 市場限制因素
- 成熟市場資本密集度正常化
- 供應商庫存調整與 5G 貨幣化之間的不平衡。
- 透過多年合約固定採購流程會降低追蹤器的回應能力。
- 電力供應不足、安裝空間不足以及回程傳輸準備不足,導致部署延遲。
- 宏觀經濟因素對市場的影響
- 產業價值鏈分析
- 科技趨勢
- 監理情勢
- 波特五力分析
第5章 市場規模與成長預測
- 按投資類別
- 安裝和維護
- 無線接取網路設備
- 核心網路基礎設施
- 光纖和固定寬頻基礎設施
- 其他投資類別
- 透過技術
- 5G網路基礎設施
- 4G LTE網路維護
- Fiber-to-the-Premises
- 其他技術
- 依網路資產類型
- 有線接入
- 無線存取
- 無線 X-Haul 和封包核心網路
- 交通網路
- 其他網路資產類型
- 資本投資的資金來源
- 行動網路營運商
- 固定寬頻服務供應商
- 基礎設施公司和鐵塔公司
- 其他資本投資來源
- 按地區
- 北美洲
- 美國
- 加拿大
- 墨西哥
- 南美洲
- 巴西
- 阿根廷
- 智利
- 其他南美國家
- 歐洲
- 德國
- 英國
- 法國
- 義大利
- 西班牙
- 其他歐洲國家
- 亞太地區
- 中國
- 日本
- 印度
- 韓國
- 澳洲
- 其他亞太國家
- 中東
- 阿拉伯聯合大公國
- 沙烏地阿拉伯
- 卡達
- 其他中東國家
- 非洲
- 南非
- 埃及
- 奈及利亞
- 其他非洲國家
- 北美洲
第6章 競爭情勢
- 市場集中度
- 策略趨勢
- 市佔率分析
- 公司簡介
- Huawei Technologies Co., Ltd.
- Nokia Corporation
- Telefonaktiebolaget LM Ericsson
- ZTE Corporation
- Cisco Systems, Inc.
- Ciena Corporation
- Juniper Networks, Inc.
- CommScope Holding Company, Inc.
- ADTRAN Holdings, Inc.
- Fujitsu Limited
- NEC Corporation
- Samsung Electronics Co., Ltd.
- Mavenir Systems, Inc.
- Airspan Networks Holdings Inc.
- Parallel Wireless, Inc.
- Calix, Inc.
- Cambium Networks Corporation
- Ubiquiti Inc.
- Tejas Networks Limited
- HFCL Limited
- Ceragon Networks Ltd.
- Aviat Networks, Inc.
- Ekinops SA
- Ribbon Communications Inc.
第7章 市場機會與未來展望
According to Mordor Intelligence, the telecom capex prioritization tracker market size was valued at USD 1.24 billion in 2025 and estimated to grow from USD 1.41 billion in 2026 to reach USD 2.75 billion by 2031, at a CAGR of 14.29% during the forecast period (2026-2031).
This report is Segmented by Investment Category (Installation and Maintenance, Radio Access Network Equipment, and More), Technology (5G Network Infrastructure, 4G LTE Network Maintenance, and More), Network Asset Type (Wireline Access, Wireless Access, and More), Capex Source (Mobile Network Operators, and More), and Geography. The Market Forecasts are Provided in Terms of Value (USD).
Global Telecom Capex Prioritization Tracker Market Trends and Insights
5G Standalone and Network Densification
The transition from 5G Non-Standalone to Standalone architecture is a central capital allocation signal for the Telecom Capex Prioritization Tracker Market. By March 2026, 95 operators had commercially launched 5G Standalone services, 42% more than in the first quarter of 2025. The same source reported that 35 operators were investing in 5G-Advanced and 11 had launched commercial services. These projects require upgrades to packet cores, orchestration systems, transport links, and radio networks rather than isolated radio equipment purchases. China had 4.838 million 5G base stations at the end of 2025, and 5G-Advanced coverage had expanded to more than 330 cities, creating a need for X-Haul and core capacity, even as the radio layer has already grown. This makes deployment status, software readiness, and transport constraints important inputs for spending priorities.
Fiber Broadband and Fixed Wireless Access Expansion
Fiber programs are becoming a larger part of the Telecom Capex Prioritization Tracker Market because they support residential broadband, mobile backhaul, and enterprise connectivity. AT&T announced a five-year U.S. investment plan exceeding USD 250 billion in March 2026, with fiber expansion toward 40 million locations by the end of 2026 and 60 million by 2030. T-Mobile committed USD 2.7 billion to 2 fiber joint ventures in April 2026, targeting 1.8 million additional fiber passings by the end of 2026. Fixed wireless access is also becoming a coordinated complement to fiber rather than only a rural alternative. Fiber assets can serve broadband customers and provide routes for mobile and data-center traffic, which makes their allocation more complex than a single access-network line item. These combined uses sustain the Telecom Capex Prioritization Tracker Market as operators coordinate fixed and wireless capital plans.
Mature-Market Capital-Intensity Normalization
Initial 5G buildouts have passed their peak in several advanced markets, leaving operators to focus on selected upgrades and maintenance. China Mobile planned CNY 136.6 billion (USD 18.9 billion) in capital expenditure for 2026, 9.5% lower than the prior year. Its computing power investment grew 62.4% to CNY 37.8 billion (USD 5.6 billion), while communications network investment declined by 20.3%. Deutsche Telekom invested EUR 16.9 billion (USD 18.3 billion) in network infrastructure in 2025, indicating an ongoing commitment but a mature maintenance and upgrade profile. This shift makes it harder to compare spending categories because compute and cloud projects sit close to conventional telecommunications network budgets. The Telecom Capex Prioritization Tracker Market needs to separate these uses without assuming that lower total equipment spending reflects lower demand for every network asset.
Other drivers and restraints analyzed in the detailed report include:
- AI Data-Center Interconnect and Cloud-Native Network Investment
- Public-Sector Connectivity and Digital-Sovereignty Programs
- Vendor Inventory Correction and Uneven 5G Monetization
For complete list of drivers and restraints, kindly check the Table Of Contents.
Segment Analysis
Radio access network equipment held 38.24% of the Telecom Capex Prioritization Tracker Market share in 2025. Its position reflects the continued use of mid-band 5G for coverage depth and capacity in urban, suburban, and enterprise locations. These purchases commonly include radio units, site integration, spectrum-specific optimization software, and multi-year vendor commitments within the Telecom Capex Prioritization Tracker Market. Core network infrastructure is also important because a 5G Standalone transition needs packet-core and orchestration upgrades alongside radio work. Installation and maintenance create a recurring demand stream as operators retire 3G and copper assets and replace equipment that cannot remain in service.
Fiber and fixed broadband infrastructure are forecast to register a 15.47% CAGR from 2026 to 2031, the highest rate in this segmentation. Fiber-to-the-premises programs are extending into secondary cities and rural areas across North America, Asia-Pacific, and Europe. A broadband fiber route can also serve as a dark-fiber path for data-center customers, creating separate revenue uses for the same physical asset. Nokia participated in an AI-optimized optical transport route in North Dakota designed for up to 400 Tbps, linking a major data-center development with the Chicago metropolitan area. The others category includes Open RAN software, satellite backhaul integration, and private 5G equipment, which may require separate tracking as adoption increases.
5G network infrastructure accounted for 42.13% of spending by technology in 2025. The share reflects incomplete coverage programs in emerging economies and the 5G Standalone upgrade cycle in advanced economies. Both use cases maintain 5G as the leading budget line, although their underlying investment reasons differ. Operators need radio, core, and transport components to deliver Standalone services effectively. The development of 5G-Advanced adds another layer of software and network-control requirements for the Telecom Capex Prioritization Tracker Market.
Fiber-to-the-premises is projected to expand at a 16.27% CAGR from 2026 to 2031. T-Mobile's USD 2.7 billion joint-venture commitment and AT&T's planned fiber build show the scale of current fiber investment in the United States. 4G LTE maintenance remains necessary where 5G coverage is incomplete and in private-network applications that favor established reliability. The USD 42.5 billion BEAD program supports a public and private procurement pipeline for broadband equipment. Other technologies include satellite backhaul and Open RAN, with the pace of commercial deployment shaping the technology mix through 2031.
Complete Report Scope:
- By Investment Category
- Installation and Maintenance
- Radio Access Network Equipment
- Core Network Infrastructure
- Fiber and Fixed Broadband Infrastructure
- Other Investment Categories
- By Technology
- 5G Network Infrastructure
- 4G LTE Network Maintenance
- Fiber-to-the-Premises
- Other Technologies
- By Network Asset Type
- Wireline Access
- Wireless Access
- Wireless X-Haul and Packet Core
- Transport Networks
- Other Network Asset Types
- By Capex Source
- Mobile Network Operators
- Fixed Broadband Operators
- Infracos and Tower Companies
- Other Capex Sources
- By Geography
- North America
- United States
- Canada
- Mexico
- South America
- Brazil
- Argentina
- Chile
- Rest of South America
- Europe
- Germany
- United Kingdom
- France
- Italy
- Spain
- Rest of Europe
- Asia-Pacific
- China
- Japan
- India
- South Korea
- Australia
- Rest of Asia-Pacific
- Middle East
- United Arab Emirates
- Saudi Arabia
- Qatar
- Rest of Middle East
- Africa
- South Africa
- Egypt
- Nigeria
- Rest of Africa
- North America
Geography Analysis
North America held 31.24% of the Telecom Capex Prioritization Tracker Market share in 2025. AT&T's five-year U.S. investment plan exceeded USD 250 billion and covered fiber, 5G home internet, FirstNet, and satellite connectivity. Verizon's completed acquisition of Frontier expanded its fiber operations from 15 to 31 states and Washington, D.C. The BEAD program adds USD 42.5 billion in public broadband funding to commercial build schedules.
Asia-Pacific is forecast to achieve the fastest regional CAGR, at 15.83%, from 2026 to 2031. China Mobile planned CNY 136.6 billion (USD 18.9 billion) in capital expenditure for 2026 and increased its computing-power network budget to CNY 37.8 billion (USD 5.6 billion). China Unicom planned CNY 50 billion (USD 6.9 billion) in capital expenditure for 2026, with more than 35% allocated to computing power. Reliance Jio invested USD 15.2 billion in fiscal year 2026 and had 27.1 million fixed broadband subscribers. NTT DOCOMO maintained JPY 857.5 billion (USD 5.7 billion) in fiscal year 2025 capital expenditure for 5G expansion and AI-enabled network management.
Europe's 2025 network infrastructure investment totaled EUR 16.9 billion (USD 18.3 billion), with Deutsche Telekom contributing EUR 5.9 billion (USD 6.4 billion) in Germany. Virgin Media O2 committed GBP 700 million (USD 895 million) to mobile investment in 2026. The Middle East is a capital-intensive region, with Mobily reporting SAR 5.83 billion (USD 1.55 billion) in 2025 capital expenditure and more than 7,600 5G sites across 61 cities. Africa's growth is supported by fiber and mobile investment, including Telkom South Africa's ZAR 6.43 billion, equivalent to USD 350 million, capital expenditure in fiscal year 2026. South America is led more by fixed broadband and optical software investment, including Cirion's network-as-a-service deployment with Ciena and Carma.
- Huawei Technologies Co., Ltd.
- Nokia Corporation
- Telefonaktiebolaget LM Ericsson
- ZTE Corporation
- Cisco Systems, Inc.
- Ciena Corporation
- Juniper Networks, Inc.
- CommScope Holding Company, Inc.
- ADTRAN Holdings, Inc.
- Fujitsu Limited
- NEC Corporation
- Samsung Electronics Co., Ltd.
- Mavenir Systems, Inc.
- Airspan Networks Holdings Inc.
- Parallel Wireless, Inc.
- Calix, Inc.
- Cambium Networks Corporation
- Ubiquiti Inc.
- Tejas Networks Limited
- HFCL Limited
- Ceragon Networks Ltd.
- Aviat Networks, Inc.
- Ekinops S.A.
- Ribbon Communications Inc.
Additional Benefits:
- The market estimate (ME) sheet in Excel format
- 3 months of analyst support
TABLE OF CONTENTS
1 INTRODUCTION
- 1.1 Study Assumptions and Market Definition
- 1.2 Scope of the Study
2 RESEARCH METHODOLOGY
3 EXECUTIVE SUMMARY
4 MARKET LANDSCAPE
- 4.1 Market Overview
- 4.2 Market Drivers
- 4.2.1 5G Standalone and Network Densification
- 4.2.2 Fiber Broadband and Fixed Wireless Access Expansion
- 4.2.3 AI Data-Center Interconnect and Cloud-Native Network Investment
- 4.2.4 Public-Sector Connectivity and Digital-Sovereignty Programs
- 4.2.5 6G Research and Pre-Commercial Infrastructure Commitments
- 4.2.6 Energy-Efficient Network Modernization and Automation
- 4.3 Market Restraints
- 4.3.1 Mature-Market Capital-Intensity Normalization
- 4.3.2 Vendor Inventory Correction and Uneven 5G Monetization
- 4.3.3 Multi-Year Procurement Locks Reduce Tracker Responsiveness
- 4.3.4 Power, Site, and Backhaul Readiness Gaps Delay Deployment
- 4.4 Impact of Macroeconomic Factors on the Market
- 4.5 Industry Value-Chain Analysis
- 4.6 Technology Outlook
- 4.7 Regulatory Landscape
- 4.8 Porter's Five Forces Analysis
- 4.8.1 Threat of New Entrants
- 4.8.2 Bargaining Power of Suppliers
- 4.8.3 Bargaining Power of Buyers
- 4.8.4 Threat of Substitutes
- 4.8.5 Intensity of Competitive Rivalry
5 MARKET SIZE AND GROWTH FORECASTS (VALUE)
- 5.1 By Investment Category
- 5.1.1 Installation and Maintenance
- 5.1.2 Radio Access Network Equipment
- 5.1.3 Core Network Infrastructure
- 5.1.4 Fiber and Fixed Broadband Infrastructure
- 5.1.5 Other Investment Categories
- 5.2 By Technology
- 5.2.1 5G Network Infrastructure
- 5.2.2 4G LTE Network Maintenance
- 5.2.3 Fiber-to-the-Premises
- 5.2.4 Other Technologies
- 5.3 By Network Asset Type
- 5.3.1 Wireline Access
- 5.3.2 Wireless Access
- 5.3.3 Wireless X-Haul and Packet Core
- 5.3.4 Transport Networks
- 5.3.5 Other Network Asset Types
- 5.4 By Capex Source
- 5.4.1 Mobile Network Operators
- 5.4.2 Fixed Broadband Operators
- 5.4.3 Infracos and Tower Companies
- 5.4.4 Other Capex Sources
- 5.5 By Geography
- 5.5.1 North America
- 5.5.1.1 United States
- 5.5.1.2 Canada
- 5.5.1.3 Mexico
- 5.5.2 South America
- 5.5.2.1 Brazil
- 5.5.2.2 Argentina
- 5.5.2.3 Chile
- 5.5.2.4 Rest of South America
- 5.5.3 Europe
- 5.5.3.1 Germany
- 5.5.3.2 United Kingdom
- 5.5.3.3 France
- 5.5.3.4 Italy
- 5.5.3.5 Spain
- 5.5.3.6 Rest of Europe
- 5.5.4 Asia-Pacific
- 5.5.4.1 China
- 5.5.4.2 Japan
- 5.5.4.3 India
- 5.5.4.4 South Korea
- 5.5.4.5 Australia
- 5.5.4.6 Rest of Asia-Pacific
- 5.5.5 Middle East
- 5.5.5.1 United Arab Emirates
- 5.5.5.2 Saudi Arabia
- 5.5.5.3 Qatar
- 5.5.5.4 Rest of Middle East
- 5.5.6 Africa
- 5.5.6.1 South Africa
- 5.5.6.2 Egypt
- 5.5.6.3 Nigeria
- 5.5.6.4 Rest of Africa
- 5.5.1 North America
6 COMPETITIVE LANDSCAPE
- 6.1 Market Concentration
- 6.2 Strategic Moves
- 6.3 Market Share Analysis
- 6.4 Company Profiles (includes Global Level Overview, Market Level Overview, Core Segments, Financials as available, Strategic Information, Market Rank/Share, Products and Services, Recent Developments)
- 6.4.1 Huawei Technologies Co., Ltd.
- 6.4.2 Nokia Corporation
- 6.4.3 Telefonaktiebolaget LM Ericsson
- 6.4.4 ZTE Corporation
- 6.4.5 Cisco Systems, Inc.
- 6.4.6 Ciena Corporation
- 6.4.7 Juniper Networks, Inc.
- 6.4.8 CommScope Holding Company, Inc.
- 6.4.9 ADTRAN Holdings, Inc.
- 6.4.10 Fujitsu Limited
- 6.4.11 NEC Corporation
- 6.4.12 Samsung Electronics Co., Ltd.
- 6.4.13 Mavenir Systems, Inc.
- 6.4.14 Airspan Networks Holdings Inc.
- 6.4.15 Parallel Wireless, Inc.
- 6.4.16 Calix, Inc.
- 6.4.17 Cambium Networks Corporation
- 6.4.18 Ubiquiti Inc.
- 6.4.19 Tejas Networks Limited
- 6.4.20 HFCL Limited
- 6.4.21 Ceragon Networks Ltd.
- 6.4.22 Aviat Networks, Inc.
- 6.4.23 Ekinops S.A.
- 6.4.24 Ribbon Communications Inc.
7 MARKET OPPORTUNITIES AND FUTURE OUTLOOK
- 7.1 White-Space and Unmet-Need Assessment
