

 |
市場調查報告書
商品編碼
2119316
通訊詐騙管理軟體:市場佔有率分析、產業趨勢與統計、成長預測(2026-2031)Telecom Fraud Management Software - Market Share Analysis, Industry Trends & Statistics, Growth Forecasts (2026 - 2031) |
||||||

※ 本網頁內容可能與最新版本有所差異。詳細情況請與我們聯繫。
根據 Mordor Intelligence 預測,通訊詐騙管理軟體的市場規模預計將從 2025 年的 4.5111 億美元和 2026 年的 5.0065 億美元成長到 2031 年的 8.0234 億美元,2026 年至 2031 年的年複合成長率(CAGR)率為 9.89%。
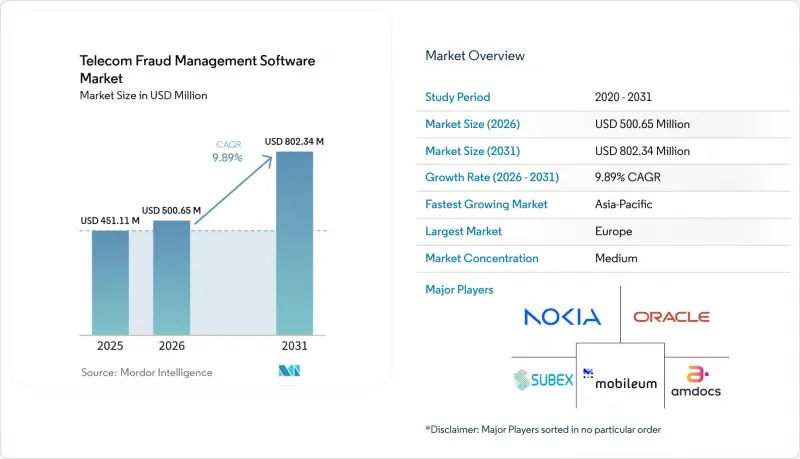
本報告按元件(軟體和服務)、部署模式(雲端、本地部署、混合部署和邊緣部署)、解決方案類型(詐欺分析和偵測等)、詐欺類型(國際收益分成詐欺、SIM卡盒和繞過詐欺等)、組織規模(大型企業和中小企業)以及地區進行細分。市場預測以美元計價。
全球通訊欺詐管理軟體市場趨勢與洞察
利用人工智慧和機器學習進行即時詐欺檢測
通訊欺詐管理軟體市場正受益於人工智慧驅動的攻擊與傳統基於規則的防禦之間日益擴大的差距。根據TNS 2025年的一項調查,75%的電信業者將使用機器學習或人工智慧進行詐欺偵測,高於2023年的38%。然而,53%的業者認為其人工智慧應用水準處於「初級」階段。這表明,儘管人工智慧的應用範圍很廣,但仍不成熟,從小規模自動化專案起步的營運商未來可能需要更高級的模型、編配和分析師支援。 2025年發表在PLOS ONE上的一項研究報告稱,一種使用通訊詐欺數據評估的圖注意力方法準確率達到93.28%,F1分數達到92.08%,AUC達到94.53%。這些結果支持採用能夠從通話記錄和網路活動關係中學習的平台,而不是僅僅依賴靜態閾值。
擴展 5G、VoLTE、物聯網和 eSIM 連接
通訊欺詐管理軟體市場正受到網路變化的影響,這些網路會產生更多即時事件,並引入新的身份驗證和信令風險。根據 GLF 發布的《2025 年詐欺報告》,95% 的受訪業者表示,傳統語音詐欺正在趨於穩定或下降,但預計到 2028 年,物聯網相關風險將導致高達 80 億美元的數據漫遊損失。 VoLTE 需要 SIP 訊號和 IP 多媒體子系統 (IMS) 元件之間的協調,這使得配置漏洞成為攔截和服務中斷的潛在途徑。 2025 年 4 月,ITU-T 批准了 X.1456建議,為使用 USSD 和 SIM 工具包機制的數位金融服務應用提供安全指導。 eSIM、物聯網和數位支付方面的規範制定工作進一步增加了對能夠全面檢查網路、身分和交易訊號的控制能力的需求。
資料隱私、資料本地化和跨境傳輸限制
資料主權問題可能會延緩電信詐騙管理軟體的普及,因為詳細的元資料對於有效偵測詐欺行為至關重要。在提交給歐洲資料保護委員會 (EDPB) 的 2024 年意見書中,Connect Europe 指出,歐盟電子隱私框架在詐騙預防處理方面提供的法律確定性有限,而且歐盟各成員國的做法也存在差異。這種不確定性使得跨境互聯案例以及透過外部供應商處理用戶通話記錄的雲端部署變得更加複雜。歐盟的電子證據法規將於 2026 年生效,該法規規定資料保留請求的最長回應時間為八小時。印度、印尼和韓國也制定了可能限制用戶資訊流動的國家法規。供應商必須提供區域處理選項和控制措施,以確保合規性,同時避免遺漏關鍵的詐欺訊號。
細分市場分析
預計到2025年,通訊欺詐管理軟體市場中,軟體將佔74.22%的佔有率。這反映了市場對集分析、案例管理、工作流程自動化和即時規則於一體的平台的需求。軟體層也包括通用IT服務所缺乏的專用訊號解碼器和訓練模型。由於營運商會根據歷史通話記錄和區域營運模式自訂模型,長期部署可能會產生轉換成本。 Subex已將生成式人工智慧整合到HyperSense中,展示了供應商如何為其現有軟體平台添加推理功能。這些功能使團隊能夠根據通訊業的具體情況評估警報。
預計到2031年,服務市場將以11.54%的複合年成長率成長。託管式偵測、分類和補救服務能夠有效解決反詐欺專家嚴重短缺的問題,尤其是在本地電信業者中。根據TNS引述CFCA的一項調查顯示,所有電信業者的專門詐騙團隊平均規模為40.5人,而小規模業者的團隊規模僅15人。這種短缺導致電信詐騙管理軟體市場對「詐欺即服務」(FaaS)合約的興趣日益濃厚,尤其是在營運商無法維持完整的內部團隊的情況下。 NIS2正在加強其對安全事件的管理責任,並積極尋求專業的服務合作夥伴。
預計到2025年,本地部署系統將佔通訊欺詐管理軟體市場規模的47.88%。當需要直接存取訊號平面、收費系統和敏感的用戶元資料時,電信業者仍然傾向於選擇這些系統。歐洲一級營運商通常更傾向於本地基礎設施,因為它可以降低跨境資料傳輸的複雜性。對現有基礎設施的投資也推動了本地部署平台的持續使用。電信業者可以根據其實際網路營運和既定的安全保障流程來客製化這些系統。
預計到2031年,雲端原生技術的應用將以11.47%的複合年成長率成長。基於使用量的收費模式有望降低中小型電信業者的部署成本,這些業者難以投資大規模的本地基礎設施。 2025年的一項學術期刊研究報告指出,雲端原生微服務可以支援通訊詐騙防制工作負載中的橫向擴展和即時異常檢測。隨著混合環境和邊緣環境的興起,電信業者除了需要集中式分析外,還需要低延遲的網路分析。通訊詐騙管理軟體市場的服務供應商可以透過提供連接收費系統和雲端分析的連接器來減輕遷移的負擔。
區域分析
預計到2025年,歐洲將佔據通訊欺詐管理軟體市場27.89%的佔有率。該地區面臨與國內營運商高密度網路漫遊和互聯相關的重大風險。 NIS2將通訊產業列為關鍵產業,強制要求進行風險管理、事件通報和課責。預計2025年9月,英國營運商BT/EE、Three、Virgin Media O2和Vodafone將在GSMA開放式閘道下推出「KYC Match」和「Age Verify」API。未來的投資預計將集中在分析、託管服務和合規性整合方面。
預計到2031年,亞太地區將以11.02%的複合年成長率成長。該地區電信詐騙管理軟體市場的成長主要得益於大規模的用戶群體,以及5G的快速部署、行動支付和eSIM的普及,以及營運商收費的興起。預計GSMA將於2025年發布關於印尼、斯里蘭卡和澳洲開放式閘道器活動的報告。澳洲業者預計將利用「詐騙訊號」(Scam Signal)進行即時攔截。同時,印尼業者預計將實施「號碼驗證」(Number Verify)、「SIM卡交換」(SIM Swap)和「設備定位」(Device Location)介面,作為打擊金融詐騙的措施。印度面臨與交易和SIM卡認證相關的高風險,而韓國的5G和行動支付普及率正在不斷提高。這些因素正在推動對身份驗證、信令和即時分析平台的需求。
北美地區需求依然穩定,這得益於基於美國聯邦通訊委員會 (FCC) STIR/SHAKEN 框架的來電認證要求。根據美國聯邦貿易委員會 (FTC) 的報告,預計到 2024 年,消費者詐騙損失將達到 125 億美元,比 2023 年成長 25%。南美洲地區持續面臨 SIM 卡盒和繞過安全措施的風險,但考慮到電信業者預算有限,託管服務可能是可行的選擇。非洲地區由於行動支付的活躍使用以及大規模繞過安全措施的風險,被視為長期機會。
其他好處:
- Excel格式的市場預測(ME)表
- 3個月的分析師支持
目錄
第1章:引言
- 研究假設和市場定義
- 調查範圍
第2章:調查方法
第3章執行摘要
第4章 市場狀況
- 市場概覽
- 市場促進因素
- 將人工智慧和機器學習引入即時詐欺偵測
- 透過 5G、VoLTE、物聯網和 eSIM 擴展連接性
- IRSF、一響即掛斷電話、繞過詐騙和通訊詐騙激增。
- 數位身分、行動支付和營運商計費的擴展
- 雲端原生和託管式詐欺預防運營
- 跨網路互聯互通與漫遊風險情報
- 市場限制因素
- 資料隱私、國內資料儲存以及跨境資料傳輸限制。
- 整合複雜性與傳統OSS/BSS的依賴
- 對抗性適應和模型漂移在新型詐欺方法的應用
- 詐欺預防、誤報和客戶體驗風險所涉及的工作
- 宏觀經濟因素對市場的影響
- 產業價值鏈分析
- 監理情勢
- 技術展望
- 人工智慧、機器學習和可解釋人工智慧
- 生成式人工智慧驅動的研究代理與副駕駛
- 圖表分析、行為分析和連結分析
- 對 SS7、Diameter、SIP、GTP 和 HTTP/2 的訊號層進行分析
- 邊緣分析和低延遲對抗措施
- 聯邦學習與隱私權保護分析
- 波特五力分析
第5章 市場規模與成長預測
- 按組件
- 軟體
- 服務
- 部署模式
- 雲
- 現場
- 混合和邊緣
- 按解決方案類型
- 詐欺分析與檢測
- 身分識別、身分驗證和訂閱相關風險
- 收益分成、互聯互通和漫遊保護
- 訊號和語音安全
- 案件管理、調查、工作流程
- 收入保障和詐欺防制編配
- 按詐欺類型分類
- 國際利潤分享詐騙
- 響一聲就掛斷和未接來電詐騙
- SIM卡盒和繞過詐騙
- 漫遊詐騙和SIM卡克隆
- 訂閱詐騙、身分驗證詐騙、帳號劫持詐騙
- 其他類型的詐欺
- 按組織規模
- 大公司
- 小型企業
- 按地區
- 北美洲
- 美國
- 加拿大
- 墨西哥
- 南美洲
- 巴西
- 阿根廷
- 其他南美國家
- 歐洲
- 英國
- 德國
- 法國
- 義大利
- 其他歐洲國家
- 亞太地區
- 中國
- 印度
- 日本
- 韓國
- 其他亞太國家
- 中東
- 沙烏地阿拉伯
- 阿拉伯聯合大公國
- 其他中東國家
- 非洲
- 南非
- 奈及利亞
- 其他非洲國家
- 北美洲
第6章 競爭情勢
- 市場集中度
- 策略趨勢
- 市佔率分析
- 公司簡介
- Amdocs Limited
- Subex Limited
- Mobileum Inc.
- Nokia Corporation
- Telefonaktiebolaget LM Ericsson
- Oracle Corporation
- IBM Corporation
- SAS Institute Inc.
- Fair Isaac Corporation
- Tata Consultancy Services Limited
- Tech Mahindra Limited
- HCL Technologies Limited
- Huawei Technologies Co., Ltd.
- Syniverse Technologies, LLC
- Enea AB
- Araxxe SA
- TEOCO Corporation
- Neural Technologies Limited
第7章 市場機會與未來展望
According to Mordor Intelligence, the telecom fraud management software market size is projected to expand from USD 451.11 million in 2025 and USD 500.65 million in 2026 to USD 802.34 million by 2031, registering a CAGR of 9.89% between 2026 to 2031.
This report is Segmented by Component (Software, and Services), Deployment Mode (Cloud, On-Premises, and Hybrid and Edge), Solution Type (Fraud Analytics and Detection, and More), Fraud Type (International Revenue Share Fraud, SIM Box and Bypass Fraud, and More), Organization Size (Large Enterprises, and SMEs), and Geography. The Market Forecasts are Provided in Terms of Value (USD).
Global Telecom Fraud Management Software Market Trends and Insights
AI and Machine Learning Adoption for Real-Time Fraud Detection
The telecom fraud management software market is benefiting from the widening gap between AI-enabled attacks and legacy rules-based defenses. A 2025 survey by TNS found that 75% of telecom operators used machine learning or AI for fraud detection, up from 38% in 2023, while 53% described themselves as AI beginners. This indicates broad but immature adoption, so operators that begin with narrow automation projects can later require more capable models, orchestration, and analyst support. A 2025 PLOS ONE study reported 93.28% accuracy, 92.08% F1 score, and 94.53% AUC for a graph-attention approach evaluated on telecom fraud data. These results support procuring platforms that learn from relationships across call records and network activity rather than relying solely on static thresholds.
Growth of 5G, VoLTE, IoT, and eSIM Connectivity
The telecom fraud management software market is being shaped by networks that generate more real-time events and introduce new identity and signaling risks. The GLF Fraud Report 2025 stated that 95% of surveyed carriers reported stable or declining traditional voice fraud volumes, but projected up to USD 8 billion in data roaming losses by 2028 due to IoT-related risks. VoLTE requires coordination between SIP signaling and IP Multimedia Subsystem components so that configuration weaknesses can create pathways for interception and service disruption. The ITU-T approved Recommendation X.1456 in April 2025 to provide security guidance for digital financial service applications that use USSD and SIM toolkit mechanisms. The specification work around eSIM, IoT, and digital payments reinforces demand for controls that inspect network, identity, and transaction signals together.
Data Privacy, Data Localization, and Cross-Border Transfer Restrictions
Data sovereignty can delay deployments of telecom fraud management software because effective detection often depends on detailed metadata. Connect Europe stated in its 2024 submission to the European Data Protection Board that the ePrivacy framework provides limited legal certainty regarding fraud-prevention processing and that practices differ across EU member states. This uncertainty complicates cross-border interconnect cases and cloud deployments that process subscriber call records through external providers. The EU e-Evidence Regulation takes effect in 2026 and establishes preservation-request response times of up to 8 hours. India, Indonesia, and South Korea also have domestic requirements that may restrict the movement of subscriber information. Vendors must offer regional processing options and controls that support compliance without leaving critical fraud signals unexamined.
Other drivers and restraints analyzed in the detailed report include:
- Escalating IRSF, Wangiri, Bypass, and Messaging Fraud
- Expansion of Digital Identity, Mobile Money, and Carrier Billing
- Integration Complexity and Legacy OSS/BSS Dependence
For complete list of drivers and restraints, kindly check the Table Of Contents.
Segment Analysis
Software is expected to hold 74.22% of the 2025 telecom fraud management software market share, reflecting demand for platforms that combine analytics, case management, workflow automation, and real-time rules. The software layer also includes specialized signaling decoders and trained models that generic IT services lack. Long-running deployments can create switching costs, as operators tune models using historical call-detail records and local operating patterns. Subex has integrated generative AI into HyperSense, demonstrating how suppliers are adding reasoning capabilities to established software platforms. These features help teams assess alerts using telecom-specific context.
Services are projected to expand at an 11.54% CAGR through 2031. Managed detection, triage, and remediation services address shortages of fraud specialists, particularly among regional carriers. The CFCA survey cited by TNS reported an average dedicated fraud team size of 40.5 employees across carriers and 15 employees among smaller providers. This staffing gap makes Fraud-as-a-Service arrangements relevant in the Telecom Fraud Management Software Market, especially where operators cannot sustain full in-house teams. NIS2 increases management responsibility for security incidents and supports interest in specialist service partners.
On-premises systems are expected to account for 47.88% of the telecom fraud management software market size in 2025. Operators continue to prefer these systems when they need direct access to signaling planes, charging systems, and sensitive subscriber metadata. Tier 1 carriers in Europe often favor local infrastructure because it reduces cross-border data-transfer complexity. Existing infrastructure investments also support the continued use of on-premises platforms. Operators can tailor these systems to live network operations and established assurance processes.
Cloud-native deployments are projected to expand at an 11.47% CAGR through 2031. Consumption-based pricing can lower entry costs for small and medium-sized operators that cannot fund extensive local infrastructure. A 2025 journal study reported that cloud-native microservices can support horizontal scaling and real-time anomaly detection for telecom fraud workloads. Hybrid and edge arrangements are emerging, in which operators require low-latency network analysis alongside centralized analytics. Providers serving the Telecom Fraud Management Software Market can reduce transition burdens by offering connectors across charging systems and cloud analytics.
Complete Report Scope:
- By Component
- Software
- Services
- By Deployment Mode
- Cloud
- On-Premises
- Hybrid and Edge
- By Solution Type
- Fraud Analytics and Detection
- Identity, Authentication, and Subscription Risk
- Revenue Share, Interconnect, and Roaming Protection
- Signaling and Voice Security
- Case Management, Investigation, and Workflow
- Revenue Assurance and Fraud Orchestration
- By Fraud Type
- International Revenue Share Fraud
- Wangiri and Missed-Call Fraud
- SIM Box and Bypass Fraud
- Roaming Fraud and SIM Cloning
- Subscription, Identity, and Account-Takeover Fraud
- Other Frauds Type
- By Organization Size
- Large Enterprises
- Small and Medium-Sized Enterprises
- By Geography
- North America
- United States
- Canada
- Mexico
- South America
- Brazil
- Argentina
- Rest of South America
- Europe
- United Kingdom
- Germany
- France
- Italy
- Rest of Europe
- Asia-Pacific
- China
- India
- Japan
- South Korea
- Rest of Asia-Pacific
- Middle East
- Saudi Arabia
- United Arab Emirates
- Rest of Middle East
- Africa
- South Africa
- Nigeria
- Rest of Africa
- North America
Geography Analysis
Europe is expected to hold 27.89% of the telecom fraud management software market share in 2025. The region faces substantial roaming and interconnect exposure across dense networks of national operators. NIS2 classifies telecommunications as an essential sector and mandates risk management, incident reporting, and accountability. In September 2025, UK operators BT/EE, Three, Virgin Media O2, and Vodafone are expected to launch KYC Match and Age Verify APIs under GSMA Open Gateway. Future spending is likely to focus on analytics, managed services, and compliance integration.
Asia-Pacific is projected to expand at an 11.02% CAGR through 2031. This part of the Telecom Fraud Management Software Market combines large subscriber bases with rapid 5G rollout, mobile money adoption, eSIM adoption, and carrier billing. In 2025, GSMA is expected to document Open Gateway activity in Indonesia, Sri Lanka, and Australia. Australian operators are expected to use Scam Signal for real-time blocking, while Indonesian operators are expected to deploy Number Verify, SIM Swap, and Device Location interfaces for financial-fraud controls. India has high transaction and SIM-authentication exposure, while South Korea has advanced 5G and mobile-payment activity. These conditions are increasing demand for identity, signaling, and real-time analytics platforms.
North America remains a stable demand area, supported by caller-authentication requirements under the Federal Communications Commission's STIR/SHAKEN framework. The U.S. Federal Trade Commission reported USD 12.5 billion in consumer fraud losses during 2024, up 25% from 2023. South America continues to face SIM-box and bypass exposure, while managed services can offer a practical option where operator budgets are constrained. Africa remains a longer-term opportunity due to high mobile money activity and the risk of wholesale bypass.
- Amdocs Limited
- Subex Limited
- Mobileum Inc.
- Nokia Corporation
- Telefonaktiebolaget LM Ericsson
- Oracle Corporation
- IBM Corporation
- SAS Institute Inc.
- Fair Isaac Corporation
- Tata Consultancy Services Limited
- Tech Mahindra Limited
- HCL Technologies Limited
- Huawei Technologies Co., Ltd.
- Syniverse Technologies, LLC
- Enea AB
- Araxxe S.A.
- TEOCO Corporation
- Neural Technologies Limited
Additional Benefits:
- The market estimate (ME) sheet in Excel format
- 3 months of analyst support
TABLE OF CONTENTS
1 INTRODUCTION
- 1.1 Study Assumptions and Market Definition
- 1.2 Scope of the Study
2 RESEARCH METHODOLOGY
3 EXECUTIVE SUMMARY
4 MARKET LANDSCAPE
- 4.1 Market Overview
- 4.2 Market Drivers
- 4.2.1 AI and Machine Learning Adoption for Real-Time Fraud Detection
- 4.2.2 Growth of 5G, VoLTE, IoT, and eSIM Connectivity
- 4.2.3 Escalating IRSF, Wangiri, Bypass, and Messaging Fraud
- 4.2.4 Expansion of Digital Identity, Mobile Money, and Carrier Billing
- 4.2.5 Cloud-Native and Managed Fraud Operations
- 4.2.6 Cross-Network Intelligence for Interconnect and Roaming Risk
- 4.3 Market Restraints
- 4.3.1 Data Privacy, Data Localization, and Cross-Border Transfer Restrictions
- 4.3.2 Integration Complexity and Legacy OSS/BSS Dependence
- 4.3.3 Adversarial Adaptation and Model Drift Across New Fraud Vectors
- 4.3.4 Fraud-Prevention Friction, False Positives, and Customer Experience Risk
- 4.4 Impact of Macroeconomic Factors on the Market
- 4.5 Industry Value Chain Analysis
- 4.6 Regulatory Landscape
- 4.7 Technological Outlook
- 4.7.1 AI, Machine Learning, and Explainable AI
- 4.7.2 Generative AI Investigation Agents and Copilots
- 4.7.3 Graph Analytics, Behavioral Analytics, and Link Analysis
- 4.7.4 Signaling-Layer Analytics Across SS7, Diameter, SIP, GTP, and HTTP/2
- 4.7.5 Edge Analytics and Low-Latency Mitigation
- 4.7.6 Federated Learning and Privacy-Preserving Analytics
- 4.8 Porter's Five Forces Analysis
- 4.8.1 Competitive Rivalry
- 4.8.2 Threat of New Entrants
- 4.8.3 Bargaining Power of Suppliers
- 4.8.4 Bargaining Power of Buyers
- 4.8.5 Threat of Substitutes
5 MARKET SIZE AND GROWTH FORECASTS (VALUE)
- 5.1 By Component
- 5.1.1 Software
- 5.1.2 Services
- 5.2 By Deployment Mode
- 5.2.1 Cloud
- 5.2.2 On-Premises
- 5.2.3 Hybrid and Edge
- 5.3 By Solution Type
- 5.3.1 Fraud Analytics and Detection
- 5.3.2 Identity, Authentication, and Subscription Risk
- 5.3.3 Revenue Share, Interconnect, and Roaming Protection
- 5.3.4 Signaling and Voice Security
- 5.3.5 Case Management, Investigation, and Workflow
- 5.3.6 Revenue Assurance and Fraud Orchestration
- 5.4 By Fraud Type
- 5.4.1 International Revenue Share Fraud
- 5.4.2 Wangiri and Missed-Call Fraud
- 5.4.3 SIM Box and Bypass Fraud
- 5.4.4 Roaming Fraud and SIM Cloning
- 5.4.5 Subscription, Identity, and Account-Takeover Fraud
- 5.4.6 Other Frauds Type
- 5.5 By Organization Size
- 5.5.1 Large Enterprises
- 5.5.2 Small and Medium-Sized Enterprises
- 5.6 By Geography
- 5.6.1 North America
- 5.6.1.1 United States
- 5.6.1.2 Canada
- 5.6.1.3 Mexico
- 5.6.2 South America
- 5.6.2.1 Brazil
- 5.6.2.2 Argentina
- 5.6.2.3 Rest of South America
- 5.6.3 Europe
- 5.6.3.1 United Kingdom
- 5.6.3.2 Germany
- 5.6.3.3 France
- 5.6.3.4 Italy
- 5.6.3.5 Rest of Europe
- 5.6.4 Asia-Pacific
- 5.6.4.1 China
- 5.6.4.2 India
- 5.6.4.3 Japan
- 5.6.4.4 South Korea
- 5.6.4.5 Rest of Asia-Pacific
- 5.6.5 Middle East
- 5.6.5.1 Saudi Arabia
- 5.6.5.2 United Arab Emirates
- 5.6.5.3 Rest of Middle East
- 5.6.6 Africa
- 5.6.6.1 South Africa
- 5.6.6.2 Nigeria
- 5.6.6.3 Rest of Africa
- 5.6.1 North America
6 COMPETITIVE LANDSCAPE
- 6.1 Market Concentration
- 6.2 Strategic Moves
- 6.3 Market Share Analysis
- 6.4 Company Profiles (includes Global Level Overview, Market Level Overview, Core Segments, Financials as available, Strategic Information, Market Rank/Share, Products and Services, Recent Developments)
- 6.4.1 Amdocs Limited
- 6.4.2 Subex Limited
- 6.4.3 Mobileum Inc.
- 6.4.4 Nokia Corporation
- 6.4.5 Telefonaktiebolaget LM Ericsson
- 6.4.6 Oracle Corporation
- 6.4.7 IBM Corporation
- 6.4.8 SAS Institute Inc.
- 6.4.9 Fair Isaac Corporation
- 6.4.10 Tata Consultancy Services Limited
- 6.4.11 Tech Mahindra Limited
- 6.4.12 HCL Technologies Limited
- 6.4.13 Huawei Technologies Co., Ltd.
- 6.4.14 Syniverse Technologies, LLC
- 6.4.15 Enea AB
- 6.4.16 Araxxe S.A.
- 6.4.17 TEOCO Corporation
- 6.4.18 Neural Technologies Limited
7 MARKET OPPORTUNITIES AND FUTURE OUTLOOK
- 7.1 White-Space and Unmet-Need Assessment


