


 |
市場調查報告書
商品編碼
2118940
效果行銷服務:市場佔有率分析、產業趨勢與統計、成長預測(2026-2031)Performance Marketing Services - Market Share Analysis, Industry Trends & Statistics, Growth Forecasts (2026 - 2031) |
||||||

※ 本網頁內容可能與最新版本有所差異。詳細情況請與我們聯繫。
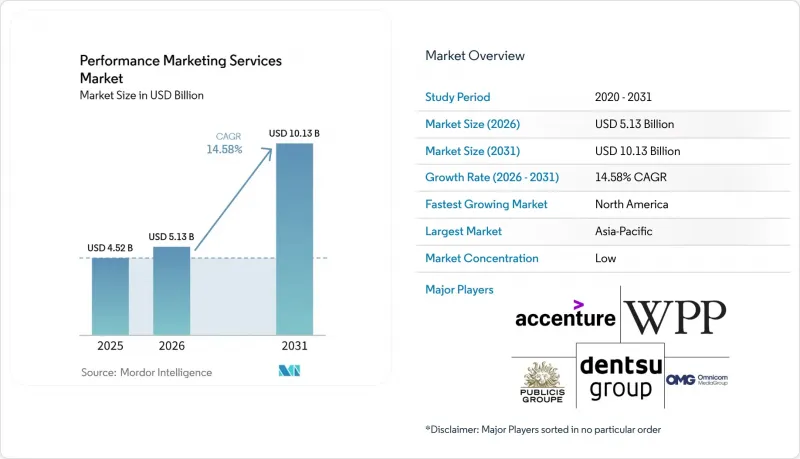
效果行銷服務市場預計將從 2025 年的 45.2 億美元和 2026 年的 51.3 億美元成長到 2031 年的 101.3 億美元,2026 年至 2031 年的年複合成長率(CAGR)為 14.58%。
本報告按服務類型(例如,付費搜尋和購物管理、付費社交廣告服務)、公司規模(大型企業、中小企業)、最終用戶行業(例如,零售和電子商務、IT和電信、媒體和娛樂、銀行、金融服務和保險、醫療保健和生命科學)以及地區進行細分。市場預測以價值(美元)表示。
全球績效行銷服務市場趨勢與洞察
對可衡量的投資報酬率和收入課責的需求
隨著企業對營收貢獻的貢獻要求越來越高,財務人員也開始更嚴格地審查行銷預算。當廣告主需要比平台儀錶板更詳盡的分析結果時,效果行銷服務市場便從中受益。增量測試和媒體組合建模有助於確定廣告是否創造了新的需求,而不僅僅是為現有購買買單。 2025年,Google利用貝葉斯方法將某些增量實驗的最低預算從10萬美元降至5000美元,使規模小規模的廣告主更容易進行受控測試。廣告代理商可以利用這個較低的進入門檻,將實驗和歸因報告結合起來,從財務角度解釋結果。這種能力透過提供整合的付費媒體管理、測試設計和結果解讀,有助於與客戶建立長期合作關係。
社群電商和效果主導付費社群廣告的擴張。
社交平臺正從單純的品牌推廣和受眾拓展管道,演變為直接的電商平台。這一趨勢為效果行銷服務市場創造了更多機遇,使其能夠在一個統一的平台上集中管理付費社交廣告、內容創作者合作、產品資訊流和轉換率衡量。由於自動化宣傳活動工具需要源源不絕的新圖片、影片和文案,品牌方已將創新的數量視為一項實際需求。 TikTok Shop 的國內上線、Meta 對 WhatsApp Shops 的整合以及 Pinterest 的產品發現工具,都強化了社交平臺在產品發現領域的作用。隨著自動化宣傳活動架構減少了人工設定工作,這種轉變促使代理商將人員重新分配到創新測試和效果衡量方面。此外,隨著越來越多的電商活動透過社群管道進行,監控聯盟佣金和轉換品質的重要性也日益凸顯。
由於隱私法規和跨平台歸因方面的差距,導致訊號遺失。
隱私法規使得不完整的客戶訊號成為廣告商持續面臨的營運挑戰。蘋果的「應用追蹤透明度」政策限制了對行動標識符的訪問,迫使 iOS 報告依賴於延遲的、聚合的、保護隱私的方法。隨著客戶建構第一方資料收集、使用者許可管理和伺服器端衡量機制,效果行銷服務市場對實施的需求日益成長。隨著Google使用者授權模式 v2 和區域隱私要求的訂定,合規的資料管理不再是獨立的技術難題,而是宣傳活動投放的關鍵要素。能夠整合使用者許可管理、資料收集和報告功能的代理商可以更可靠地跨平台呈現宣傳活動結果。同時,那些仍僅依賴瀏覽器像素的公司則面臨轉換可見度降低和最佳化決策信心不足的問題。
細分市場分析
至2025年,付費搜尋和購物管理將佔效果行銷服務市場的33.42%。由於搜尋查詢和購物清單更接近購買決策階段,這一細分市場依然十分重要。透過利用Google和亞馬遜的廣告資源,廣告主可以觸及那些正在比較產品或搜尋服務的消費者。搜尋管理還需要持續最佳化競標定價、產品資訊流、登陸頁面和轉換報告。人工智慧驅動的搜尋體驗正在改變搜尋結果的格式,這可能會降低某些現有宣傳活動系列結構的流量。新型付費廣告資源的出現也可能促使廣告代理商調整其搜尋規劃和報告流程。
預計到2031年,行動應用用戶獲取服務將以17.12%的複合年成長率成長,在所有列出的服務類別中增速最高。在效果行銷服務產業,應用程式廣告主的關注點正從安裝量轉向長期活躍且能創造價值的用戶。 AppsFlyer已將隱私、人工智慧和更精準的衡量指標列為其2026年行動成長計畫的核心考量。隨著社群電商和零售媒體擴大採用基於效果的佣金結構,聯盟行銷和合作夥伴行銷服務也不斷擴展。程序化展示廣告和再行銷廣告服務正面臨來自平台廣告資源集中化和追蹤可見度降低的壓力。隨著獲客成本的上升,廣告主需要從流量中挖掘更多價值,因此轉換率最佳化和落地頁服務越來越受到重視。
區域分析
到2025年,北美將佔據40.12%的效果行銷服務市場。該地區擁有強大的數位廣告基礎設施、大規模的零售媒體覆蓋率和成熟的代理商體系。與其他許多地區相比,美國廣告商更早採用了增量測試、媒體組合建模和第一方資料利用等方法。這些經驗支撐了對能夠將宣傳活動活動與業務成果掛鉤的代理商的需求。雖然加拿大和墨西哥也是該地區生態系統的一部分,但就平台支出和廣告代理商的能力而言,美國仍然是核心參與者。
預計到2031年,亞太地區將以15.04%的複合年成長率成長。隨著廣告進一步向數位化管道和電商主導型模式轉型,印度是推動區域成長的關鍵力量。根據電通和exchange4media的報告,到2025年,印度數位廣告市場規模將達到71,621印度盧比,佔該國廣告支出的59%。在中國,隨著品牌優先考慮直接回應活動,可衡量的效果型廣告形式也越來越受到重視。日本、韓國和澳洲的市場則更為成熟,廣告主正在採用人工智慧驅動的定向投放和零售媒體工具。儘管全部區域的效果行銷服務市場都蘊藏著機遇,但廣告代理商的策略必須充分考慮當地的平台、語言和購買行為。
歐洲在效果行銷服務市場中扮演著重要角色,但隱私法規使得效果衡量變得困難。根據IAB Europe的報告,到2025年,歐洲數位廣告支出將達到1,311億歐元,其中影片廣告和零售媒體將佔據新增投資的大部分。 SRI France和法國電子廣告觀察站(Observatoire de l'ePub)的數據顯示,到2025年,法國數位廣告市場規模將達到124億歐元。 GDPR和ePrivacy的合規性對宣傳活動管理提出了更高的要求,這使得那些擁有強大的用戶許可獲取和伺服器端追蹤能力的公司更具優勢。在南美洲,巴西的社交電商和行動應用活動正在推動市場發展,而阿根廷和智利的市場機會仍然相對小規模。在中東,尤其是在阿拉伯聯合大公國和沙烏地阿拉伯,零售和金融服務業的需求日益成長。非洲仍處於引進週期的早期階段,但行動商務和金融科技正在推動南非、埃及和奈及利亞的需求成長。
其他好處:
- Excel格式的市場預測(ME)表
- 3個月的分析師支持
目錄
第1章:引言
- 研究假設和市場定義
- 調查範圍
第2章:調查方法
第3章執行摘要
第4章 市場狀況
- 市場概覽
- 市場促進因素
- 對可衡量的投資報酬率和收入課責的需求日益成長
- 社群商務與效果型社群廣告的擴張
- 零售媒體網路支出與異地商務媒體成長。
- 利用人工智慧進行大規模創新測試和個人化客製化
- 拓展人工智慧搜尋體驗中的廣告空間
- 引入以財務主導的增量效應測量
- 市場限制因素
- 由於隱私法規和跨平台歸因方面的不一致,導致訊號遺失。
- 由於競標拍賣和封閉式競標。
- 人工智慧驅動的點擊壓縮:降低搜尋宣傳活動的點擊率
- 聯盟詐騙、優惠券洩漏和轉換率品質方面的風險。
- 宏觀經濟因素對市場的影響
- 產業價值鏈分析
- 科技趨勢
- 監理情勢
- 波特五力分析
第5章 市場規模與成長預測
- 按服務類型
- 付費搜尋和購物管理
- 付費社群廣告服務
- 聯盟行銷和合作夥伴行銷服務
- 程序化展示和重定向服務
- 行動應用用戶獲取服務
- 轉換率最佳化和著陸頁服務
- 其他服務類型
- 按公司規模
- 大公司
- 小型企業
- 按最終用戶行業分類
- 零售與電子商務
- 資訊科技/通訊
- BFSI
- 醫療保健和生命科學
- 媒體與娛樂
- 旅遊與飯店
- 製造業和工業部門
- 其他終端使用者產業(汽車、公部門等)
- 按地區
- 北美洲
- 美國
- 加拿大
- 墨西哥
- 南美洲
- 巴西
- 阿根廷
- 智利
- 其他南美國家
- 歐洲
- 德國
- 英國
- 法國
- 義大利
- 西班牙
- 其他歐洲國家
- 亞太地區
- 中國
- 日本
- 印度
- 韓國
- 澳洲
- 其他亞太國家
- 中東
- 阿拉伯聯合大公國
- 沙烏地阿拉伯
- 卡達
- 其他中東國家
- 非洲
- 南非
- 埃及
- 奈及利亞
- 其他非洲國家
- 北美洲
第6章 競爭情勢
- 市場集中度
- 策略趨勢
- 市佔率分析
- 公司簡介
- Accenture plc
- Omnicom Group Inc.
- Publicis Groupe SA
- WPP plc
- Dentsu Group Inc.
- Havas NV
- Stagwell Inc.
- S4 Capital plc
- Hakuhodo DY Holdings Inc.
- BlueFocus Intelligent Communications Group Co., Ltd.
- DEKUPLE SA
- ad pepper media International NV
- Mobvista Inc.
- Jellyfish Group Limited
- Brainlabs Digital Limited
- Tinuiti, Inc.
- NP Digital, LLC
- Power Digital Marketing, Inc.
- Acceleration Partners LLC
- Gen3 Marketing, LLC
- PartnerCentric, Inc.
- Rise Interactive Holdings, LLC
第7章 市場機會與未來展望
According to Mordor Intelligence, the performance marketing services market size is projected to expand from USD 4.52 billion in 2025 and USD 5.13 billion in 2026 to USD 10.13 billion by 2031, registering a CAGR of 14.58% between 2026 and 2031.
This report is Segmented by Service Type (Paid Search and Shopping Management, Paid Social Advertising Services, and More), Enterprise Size (Large Enterprises, and Small and Medium Enterprises), End-User Industry (Retail and E-Commerce, IT and Telecom, Media and Entertainment, BFSI, Healthcare and Life Sciences, and More), and Geography. The Market Forecasts are Provided in Terms of Value (USD).
Global Performance Marketing Services Market Trends and Insights
Demand for Measurable ROI and Revenue Accountability
Finance leaders have placed greater scrutiny on marketing budgets as businesses seek clearer proof of revenue contribution. The Performance marketing services market benefits when advertisers need results that can be explained beyond a platform dashboard. Incrementality testing and media mix modeling help determine whether advertising created new demand rather than simply receiving credit for an existing purchase. Google lowered the minimum budget for certain incrementality experiments from USD 100,000 to USD 5,000 in 2025 through Bayesian methods, making controlled testing more accessible to smaller advertisers. Agencies can use that lower entry point to combine experiments with attribution reporting and communicate results in financial terms. This capability supports longer client relationships by delivering paid media management, testing design, and interpretation together.
Social Commerce and Performance-Led Paid Social Expansion
Social platforms are becoming direct commerce environments rather than only channels for awareness and audience building. This development provides the Performance marketing services market with more opportunities to manage paid social, creator partnerships, product feeds, and conversion measurement within a single program. Brands are treating creative volume as a practical operating need because automated campaign tools require a steady supply of new images, video, and copy. TikTok Shop's domestic expansion, Meta's integration of WhatsApp Shops, and Pinterest's product discovery tools have strengthened social platforms' role in product discovery. The change shifts agency staffing toward creative testing and measurement because automated campaign structures reduce the manual setup required. It also raises the importance of monitoring affiliate commissions and conversion quality as commerce activity moves through social channels.
Signal Loss From Privacy Rules and Cross-Platform Attribution Gaps
Privacy requirements have made incomplete customer signals a lasting operating condition for advertisers. Apple App Tracking Transparency has reduced access to mobile identifiers, leaving iOS reporting dependent on aggregated, privacy-preserving methods that are delayed. The Performance marketing services market faces higher implementation needs as clients build first-party data collection, consent management, and server-side measurement. Google Consent Mode v2 and regional privacy requirements have made compliant data practices a necessary part of campaign delivery rather than a separate technology task. Agencies that connect consent, data collection, and reporting can provide more reliable views of campaign outcomes across platforms. Firms that continue to rely solely on browser pixels experience weaker visibility into conversions and less confidence in their optimization decisions.
Other drivers and restraints analyzed in the detailed report include:
- Retail Media Network and Offsite Commerce Media Growth
- AI-Enabled Creative Testing and Personalization
- Cost Inflation From Auction Automation and Walled-Garden Bidding
For complete list of drivers and restraints, kindly check the Table Of Contents.
Segment Analysis
Paid Search and Shopping Management accounted for 33.42% of the Performance marketing services market in 2025. The segment remains important because search queries and shopping listings can be close to a purchase decision. Google and Amazon inventory give advertisers access to consumers who are already comparing products or looking for a service. Search management also requires continuous work on bids, product feeds, landing pages, and conversion reporting. AI search experiences are changing the format of search results and may reduce traffic for some established campaign structures. They may also create new paid inventory, requiring agencies to adapt their search planning and reporting practices.
Mobile App User Acquisition Services is projected to grow at a 17.12% CAGR through 2031, the highest rate among the listed service types. The Performance marketing services industry is seeing app advertisers shift their attention from installation volume toward users who remain active and generate value over time. AppsFlyer identified privacy, AI, and more selective measurement as central considerations in mobile growth planning for 2026. Affiliate and Partner Marketing Services are expanding as social commerce and retail media introduce more performance-linked commission structures. Programmatic Display and Retargeting Services face pressure from concentrated platform inventory and reduced tracking visibility. Conversion Rate Optimization and Landing Page Services are receiving greater attention because advertisers need to derive more value from traffic as acquisition costs rise.
Complete Report Scope:
- By Service Type
- Paid Search and Shopping Management
- Paid Social Advertising Services
- Affiliate and Partner Marketing Services
- Programmatic Display and Retargeting Services
- Mobile App User Acquisition Services
- Conversion Rate Optimization and Landing Page Services
- Others Service Types
- By Enterprise Size
- Large Enterprises
- Small and Medium Enterprises
- By End-User Industry
- Retail and E-commerce
- IT and Telecommunications
- BFSI
- Healthcare and Life Sciences
- Media and Entertainment
- Travel and Hospitality
- Manufacturing and Industrials
- Other End-User Industries (Automotive, Public Sector, amongst Others)
- By Geography
- North America
- United States
- Canada
- Mexico
- South America
- Brazil
- Argentina
- Chile
- Rest of South America
- Europe
- Germany
- United Kingdom
- France
- Italy
- Spain
- Rest of Europe
- Asia-Pacific
- China
- Japan
- India
- South Korea
- Australia
- Rest of Asia-Pacific
- Middle East
- United Arab Emirates
- Saudi Arabia
- Qatar
- Rest of Middle East
- Africa
- South Africa
- Egypt
- Nigeria
- Rest of Africa
- North America
Geography Analysis
North America held 40.12% of the Performance marketing services market share in 2025. The region has deep digital advertising infrastructure, a large retail media presence, and an established agency base. U.S. advertisers have adopted incrementality testing, media mix modeling, and first-party data practices earlier than many other regions. This experience supports the demand for agencies that can link campaign activity to business results. Canada and Mexico participate in the regional ecosystem, although the United States remains the main center for platform spending and agency capability.
Asia-Pacific is projected to grow at a 15.04% CAGR through 2031. India is an important source of regional momentum as advertising moves further into digital channels and commerce-led formats. Dentsu and exchange4media reported that India's digital advertising market reached INR 71,621 crore in 2025, accounting for 59% of the country's advertising expenditure. China is also shifting attention toward measurable performance formats as brands prioritize direct-response activity. Japan, South Korea, and Australia are more mature markets where advertisers are adopting AI-supported targeting and retail media tools. The Performance marketing services market has opportunities across the region, but agency strategies need to reflect local platforms, languages, and commerce behavior.
Europe plays a significant role in the Performance marketing services market, though privacy requirements make measurement more difficult. IAB Europe reported that European digital advertising spending reached EUR 131.1 billion in 2025, with video and retail media accounting for substantial new investment. France's digital advertising market reached EUR 12.4 billion in 2025, according to SRI France and Observatoire de l'ePub. GDPR and ePrivacy compliance create additional campaign management requirements, which favor firms with strong consent and server-side tracking capabilities. South America is developing through Brazil's social commerce and mobile app activity, while Argentina and Chile offer smaller opportunities. The Middle East, especially the United Arab Emirates and Saudi Arabia, is seeing demand from retail and financial services. Africa remains earlier in the adoption cycle, although mobile commerce and fintech are driving demand in South Africa, Egypt, and Nigeria.
- Accenture plc
- Omnicom Group Inc.
- Publicis Groupe S.A.
- WPP plc
- Dentsu Group Inc.
- Havas N.V.
- Stagwell Inc.
- S4 Capital plc
- Hakuhodo DY Holdings Inc.
- BlueFocus Intelligent Communications Group Co., Ltd.
- DEKUPLE S.A.
- ad pepper media International N.V.
- Mobvista Inc.
- Jellyfish Group Limited
- Brainlabs Digital Limited
- Tinuiti, Inc.
- NP Digital, LLC
- Power Digital Marketing, Inc.
- Acceleration Partners LLC
- Gen3 Marketing, LLC
- PartnerCentric, Inc.
- Rise Interactive Holdings, LLC
Additional Benefits:
- The market estimate (ME) sheet in Excel format
- 3 months of analyst support
TABLE OF CONTENTS
1 INTRODUCTION
- 1.1 Study Assumptions and Market Definition
- 1.2 Scope of the Study
2 RESEARCH METHODOLOGY
3 EXECUTIVE SUMMARY
4 MARKET LANDSCAPE
- 4.1 Market Overview
- 4.2 Market Drivers
- 4.2.1 Rising Demand for Measurable ROI and Revenue Accountability
- 4.2.2 Expansion of Social Commerce and Performance-Led Paid Social
- 4.2.3 Retail Media Network Spend and Offsite Commerce Media Growth
- 4.2.4 AI-Enabled Creative Testing and Personalization at Scale
- 4.2.5 Ad Inventory Expansion Inside AI Search Experiences
- 4.2.6 Finance-Led Adoption of Incrementality Measurement
- 4.3 Market Restraints
- 4.3.1 Signal Loss From Privacy Rules and Cross-Platform Attribution Gaps
- 4.3.2 Rising Cost Inflation From Auction Automation and Walled-Garden Bidding
- 4.3.3 AI Overview Click Compression on Search Campaigns
- 4.3.4 Affiliate Fraud, Coupon Leakage, and Conversion Quality Risk
- 4.4 Impact of Macroeconomic Factors on the Market
- 4.5 Industry Value-Chain Analysis
- 4.6 Technology Outlook
- 4.7 Regulatory Landscape
- 4.8 Porter's Five Forces Analysis
- 4.8.1 Threat of New Entrants
- 4.8.2 Bargaining Power of Suppliers
- 4.8.3 Bargaining Power of Buyers
- 4.8.4 Threat of Substitutes
- 4.8.5 Intensity of Competitive Rivalry
5 MARKET SIZE AND GROWTH FORECASTS (VALUE)
- 5.1 By Service Type
- 5.1.1 Paid Search and Shopping Management
- 5.1.2 Paid Social Advertising Services
- 5.1.3 Affiliate and Partner Marketing Services
- 5.1.4 Programmatic Display and Retargeting Services
- 5.1.5 Mobile App User Acquisition Services
- 5.1.6 Conversion Rate Optimization and Landing Page Services
- 5.1.7 Others Service Types
- 5.2 By Enterprise Size
- 5.2.1 Large Enterprises
- 5.2.2 Small and Medium Enterprises
- 5.3 By End-User Industry
- 5.3.1 Retail and E-commerce
- 5.3.2 IT and Telecommunications
- 5.3.3 BFSI
- 5.3.4 Healthcare and Life Sciences
- 5.3.5 Media and Entertainment
- 5.3.6 Travel and Hospitality
- 5.3.7 Manufacturing and Industrials
- 5.3.8 Other End-User Industries (Automotive, Public Sector, amongst Others)
- 5.4 By Geography
- 5.4.1 North America
- 5.4.1.1 United States
- 5.4.1.2 Canada
- 5.4.1.3 Mexico
- 5.4.2 South America
- 5.4.2.1 Brazil
- 5.4.2.2 Argentina
- 5.4.2.3 Chile
- 5.4.2.4 Rest of South America
- 5.4.3 Europe
- 5.4.3.1 Germany
- 5.4.3.2 United Kingdom
- 5.4.3.3 France
- 5.4.3.4 Italy
- 5.4.3.5 Spain
- 5.4.3.6 Rest of Europe
- 5.4.4 Asia-Pacific
- 5.4.4.1 China
- 5.4.4.2 Japan
- 5.4.4.3 India
- 5.4.4.4 South Korea
- 5.4.4.5 Australia
- 5.4.4.6 Rest of Asia-Pacific
- 5.4.5 Middle East
- 5.4.5.1 United Arab Emirates
- 5.4.5.2 Saudi Arabia
- 5.4.5.3 Qatar
- 5.4.5.4 Rest of Middle East
- 5.4.6 Africa
- 5.4.6.1 South Africa
- 5.4.6.2 Egypt
- 5.4.6.3 Nigeria
- 5.4.6.4 Rest of Africa
- 5.4.1 North America
6 COMPETITIVE LANDSCAPE
- 6.1 Market Concentration
- 6.2 Strategic Moves
- 6.3 Market Share Analysis
- 6.4 Company Profiles (includes Global Level Overview, Market Level Overview, Core Segments, Financials as available, Strategic Information, Market Rank/Share, Products and Services, Recent Developments)
- 6.4.1 Accenture plc
- 6.4.2 Omnicom Group Inc.
- 6.4.3 Publicis Groupe S.A.
- 6.4.4 WPP plc
- 6.4.5 Dentsu Group Inc.
- 6.4.6 Havas N.V.
- 6.4.7 Stagwell Inc.
- 6.4.8 S4 Capital plc
- 6.4.9 Hakuhodo DY Holdings Inc.
- 6.4.10 BlueFocus Intelligent Communications Group Co., Ltd.
- 6.4.11 DEKUPLE S.A.
- 6.4.12 ad pepper media International N.V.
- 6.4.13 Mobvista Inc.
- 6.4.14 Jellyfish Group Limited
- 6.4.15 Brainlabs Digital Limited
- 6.4.16 Tinuiti, Inc.
- 6.4.17 NP Digital, LLC
- 6.4.18 Power Digital Marketing, Inc.
- 6.4.19 Acceleration Partners LLC
- 6.4.20 Gen3 Marketing, LLC
- 6.4.21 PartnerCentric, Inc.
- 6.4.22 Rise Interactive Holdings, LLC
7 MARKET OPPORTUNITIES AND FUTURE OUTLOOK
- 7.1 White-Space and Unmet-Need Assessment

