


 |
市場調查報告書
商品編碼
2118938
虛擬活動行銷服務:市場佔有率分析、產業趨勢與統計、成長預測(2026-2031)Virtual Event Marketing Services - Market Share Analysis, Industry Trends & Statistics, Growth Forecasts (2026 - 2031) |
||||||

※ 本網頁內容可能與最新版本有所差異。詳細情況請與我們聯繫。
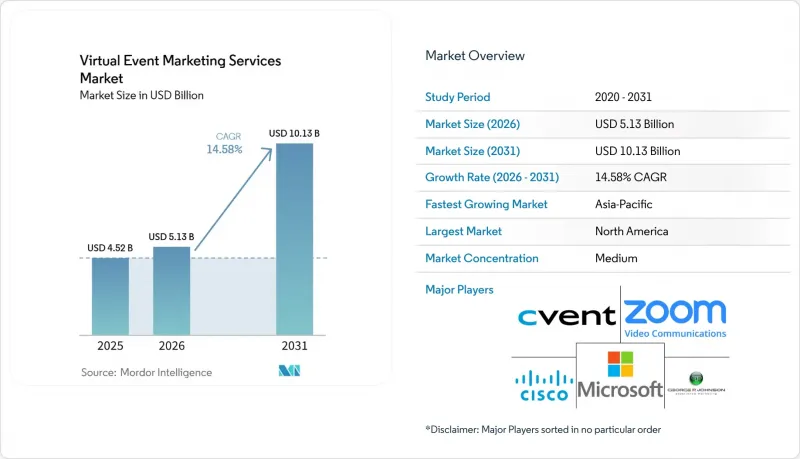
根據 Mordor Intelligence 預測,虛擬活動行銷服務市場規模將從 2025 年的 45.2 億美元和 2026 年的 51.3 億美元成長到 2031 年的 101.3 億美元,2026 年至 2031 年的複合年成長率為 14.58%。
本報告按服務類型(策略和宣傳活動策劃、參與者招募和註冊管理等)、活動形式(透過直播舉辦的企業活動等)、組織規模(大型企業、中小企業)、最終用戶行業(IT和電信、銀行、金融服務和保險等)以及地區進行細分。市場預測以美元計價。
全球虛擬活動行銷服務市場趨勢及洞察
遠距辦公和混合辦公的興起正在推動數位活動預算的成長。
混合辦公模式的興起造就了分散的受眾群體,而傳統的線下活動無法充分覆蓋所有受眾。當企業需要一種不受地理限制、能夠持續有效地與員工、採購人員和合作夥伴互動的方式時,虛擬活動行銷服務市場便能從中受益,尤其是在參與者不受行程安排或場地容量限制的情況下。根據 Forrester 發布的一份針對 2026 年的分析報告顯示,在製造業、專業服務和科技業,活動支出佔專案預算的 30% 之多。該分析還表明,活動預算增幅達到 10% 或以上的企業比例年增了一倍。 Bizzabo 的一份報告指出,財富 1000 強企業中 74% 的行銷負責人計劃在 2026 年增加活動預算,而所有活動組織者中有 40% 預計預算將會增加。此外,諸如 WCAG 2.2 和《歐洲無障礙法案》等無障礙標準也推動了提供字幕和多語言服務等標準功能的虛擬活動行銷服務的成長。
人工智慧驅動的個人化和內容重複利用可提高轉換率。
人工智慧正在改變服務供應商籌備、交付和擴展虛擬專案的方式。 ON24 的報告顯示,在其生命科學基準測試中,個人化虛擬活動落地頁使簡報請求量增加了兩倍,預約會議數量加倍。該公司還報告稱,當團隊利用人工智慧產生的衍生資產時,從單次網路研討會錄影中提取的內容量比去年同期成長了六倍。 Cvent 表示,其 CventIQ 引擎每年處理 127 億次參與者互動,並利用這些數據建立出席模型、提供人脈拓展提案和內容推薦。 Goldcast 的人工智慧內容實驗室可以從會議錄影中產生精彩短影片和相關素材。這些功能使虛擬活動行銷服務市場能夠支援在直播結束後繼續進行的宣傳活動,而無需顯著增加人工製作工作量。
網路研討會疲勞會降低現場參與率和人脈拓展能力。
當網路研討會行程過於密集時,即時參與率可能會下降,人脈拓展效果也會減弱。如前文所述,Forrester 的一項調查顯示,近 70% 的活動負責人正在減少活動總數,同時保持每個活動的品質。 Bizzabo 的一份報告指出,績效優異的組織平均註冊人數為 412 人,活動參與率為 52%。這些數據表明,買家越來越重視相關性、製作品質和個人化互動。因此,虛擬活動行銷服務市場需要提供更顯著的成果——而不僅僅是低成本、高數量的活動——例如,提供明確的參與理由和更有價值的引導式互動機會。能夠展示可衡量成果的供應商或許能夠贏得原本會分散在基礎網路研討會工具上的預算。
細分市場分析
至2025年,受眾獲取和註冊管理將佔虛擬活動行銷服務市場24.37%的佔有率。這是因為所有活動都需要在活動開始前合格且已授權的受眾,而後續跟進則依賴於準確的註冊記錄,從而滿足了一項基本需求。企業團隊越來越重視從線索品質、資料完整性、宣傳活動後續跟進準備情況以及將這些記錄與現有客戶系統整合的能力等方面評估註冊情況。註冊流程也能建立必要的同意記錄,以便在活動結束後負責任地利用互動資料。這使得該服務成為管理更廣泛數位活動宣傳活動的供應商的實用切入點。
預計從2026年到2031年,虛擬產品發表會和直播推廣活動將以16.69%的複合年成長率成長。行銷團隊正在利用這些形式協調跨區域的產品發布,而無需重複舉辦線下活動。即時數位活動可以將產品介紹給更廣泛的受眾,同時產生第一方意向數據。平台設置和營運仍然至關重要,因為團隊需要跨複雜系統進行可靠的整合。隨著個人化議程和適當的介紹變得越來越重要,網路研討會、會議、互動和人脈拓展服務的重要性也日益凸顯。
至2025年,網路研討會將佔據虛擬活動行銷服務市場46.17%的佔有率。這一主導地位反映了宣傳活動交付模式。 Bizzabo的一份報告顯示,53%的與會者表示計劃在2026年參加更多網路研討會。該公司還報告稱,61%的組織者發現其參加人數較去年同期成長。這些結果表明,即使與會者期望獲得更相關的內容和更高的製作質量,網路研討會仍將繼續廣泛應用。
預計2026年至2031年間,虛擬展覽會展覽會將以15.81%的複合年成長率成長,因為它們使參展能夠延長數位化潛在客戶開發週期,並實況活動結束後仍與潛在客戶保持聯繫。參展高度重視實況活動結束後仍可繼續進行的潛在客戶開發週期。虛擬會議和高峰會為更多知名品牌和經營團隊的溝通項目提供支援。直播企業活動滿足了投資者關係和內部溝通的需求,這些需求需要認證、錄製和多區域分發。培訓和研討會形式幫助分散各地的員工避免了與現場認證相關的差旅費用,這表明虛擬活動行銷服務市場正在滿足各種形式的多樣化需求。
區域分析
到2025年,北美將佔據虛擬活動行銷服務市場39.86%的佔有率。該地區擁有成熟的商業環境,匯聚了企業軟體供應商、行銷技術平台和活動技術供應商,並擁有龐大的經驗豐富的買家和專業服務供應商群體。美國在IT、銀行、金融和保險(BFSI)以及醫療保健行業的需求成長迅速,這些行業的客戶正在尋求整合的數位互動體驗。 Cvent和Bizzabo就是滿足這些需求的區域平台提供者的典範。加拿大為金融服務和政府計畫提供支持,而墨西哥則受益於美國跨國公司對雙語服務的需求。
歐洲有一部分買家將合規性放在首位,其中以德國、英國和法國最為突出。歐盟《2025年通用資料保護條例實施協議》和《2026年歐盟人工智慧法案》的全面實施正在影響平台評估。擁有資料駐留設定、同意管理和人工智慧文件的供應商在採購審查中能夠獲得優勢,因為這些控制措施滿足了行銷團隊僅靠宣傳活動設計無法滿足的要求。義大利和西班牙是製造業和專業服務領域的次市場,但英國的《一般資料保護條例》與歐洲法規高度一致,最大限度地減少了區域性專案之間的摩擦。
預計2026年至2031年,亞太地區將以17.24%的複合年成長率成長,成為虛擬活動行銷服務市場中成長最快的區域市場。印度、中國、日本和韓國是主要的需求中心,分別得益於其大規模的技術、金融服務和B2B通訊活動。印度的IT服務人才隊伍,以及該國的銀行、金融和保險(BFSI)以及技術相關項目,都為頻繁的虛擬互動提供了支援。一家IT通訊公司在2025年進行的一項調查顯示,線上研討會是日本企業三大行銷活動之一,51.9%的媒體贊助線上研討會參與者認為其效果顯著。在中國,企業日益成長的數位化正在推動網路研討會和會議的使用,而在韓國和澳大利亞,科技和金融服務業的需求是主要驅動力。
其他好處:
- Excel格式的市場預測(ME)表
- 3個月的分析師支持
目錄
第1章:引言
- 研究假設和市場定義
- 調查範圍
第2章:調查方法
第3章執行摘要
第4章 市場狀況
- 市場概覽
- 市場促進因素
- 遠距辦公和混合辦公模式的普及導致數位活動預算增加。
- 經濟高效的全球部署將改善虛擬活動的經濟效益。
- 人工智慧驅動的個人化和內容重複使用可提高轉換率。
- 第一方互動數據有助於改善收入歸因分析。
- 一個始終在線、按需運作的內容中心可以延長宣傳活動的生命週期。
- 贊助商對可衡量的數位化活化的需求正在推高服務支出。
- 市場限制因素
- 網路研討會疲勞正在削弱人們參與現場活動和拓展人脈的意願。
- 資料隱私和跨境合規的日益複雜化正在增加交貨風險。
- 碎片化的事件技術棧造成了資料孤島和摩擦。
- 投資報酬率 (ROI) 證明方面的不足導致預算核准過程延誤。
- 宏觀經濟因素對市場的影響
- 產業價值鏈分析
- 科技趨勢
- 監理情勢
- 波特五力分析
第5章 市場規模與成長預測
- 按服務類型
- 策略和宣傳活動規劃
- 用戶獲取和註冊管理
- 平台開發與活動管理
- 網路研討會和虛擬會議的行銷
- 虛擬產品發表會和直播推廣
- 受眾互動與網路服務
- 其他服務類型
- 按事件格式
- 網路研討會
- 虛擬會議和高峰會
- 線上產品發表會
- 虛擬展覽會展覽會
- 將進行直播的企業活動
- 線上培訓和研討會
- 按組織規模
- 大公司
- 小型企業
- 按最終用戶行業分類
- 零售與電子商務
- 資訊科技/通訊
- BFSI
- 醫療保健和生命科學
- 媒體與娛樂
- 旅遊與飯店
- 製造業和工業部門
- 其他終端使用者產業(汽車、公部門等)
- 按地區
- 北美洲
- 美國
- 加拿大
- 墨西哥
- 南美洲
- 巴西
- 阿根廷
- 智利
- 其他南美國家
- 歐洲
- 德國
- 英國
- 法國
- 義大利
- 西班牙
- 其他歐洲國家
- 亞太地區
- 中國
- 日本
- 印度
- 韓國
- 澳洲
- 其他亞太國家
- 中東
- 阿拉伯聯合大公國
- 沙烏地阿拉伯
- 卡達
- 其他中東國家
- 非洲
- 南非
- 埃及
- 奈及利亞
- 其他非洲國家
- 北美洲
第6章 競爭情勢
- 市場集中度
- 策略趨勢
- 市佔率分析
- 公司簡介
- Cvent Holding Corp.
- ON24, Inc.
- Bizzabo Ltd.
- 6Connex, Inc.
- vFairs LLC
- Airmeet Inc.
- BigMarker Holdings, Inc.
- Hubilo Technologies Inc.
- Zoom Communications, Inc.
- Cisco Systems, Inc.
- Microsoft Corporation
- Kaltura, Inc.
- RingCentral, Inc.
- EventMobi
- SpotMe SA
- Accelevents
- InEvent
- Goldcast Inc.
- Remo
- Whova Inc.
第7章 市場機會與未來展望
According to Mordor Intelligence, the virtual event marketing services market size is projected to expand from USD 4.52 billion in 2025 and USD 5.13 billion in 2026 to USD 10.13 billion by 2031, registering a CAGR of 14.58% between 2026 and 2031.
This report is Segmented by Service Type (Strategy and Campaign Planning, Audience Acquisition and Registration Management, and More), Event Format (Live-Streamed Corporate Events, and More), Organization Size (Large Enterprises, and Small and Medium-Sized Enterprises), End-User Industry (IT and Telecom, BFSI, and More), and Geography. The Market Forecasts are Provided in Terms of Value (USD).
Global Virtual Event Marketing Services Market Trends and Insights
Remote and Hybrid Work Programs Expand Digital Event Budgets
Hybrid work has created a dispersed audience that physical-only programs cannot fully serve. The Virtual Event Marketing Services Market benefits when businesses need a consistent way to involve employees, buyers, and partners across locations, especially when audience participation is not limited by travel schedules or venue capacity. Events accounted for up to 30% of program budgets in manufacturing, professional services, and technology, according to the referenced 2026 Forrester analysis. The same analysis reported that the share of organizations increasing event budgets by more than 10% doubled year over year. Bizzabo reported that 74% of Fortune 1000 marketers planned to increase event budgets in 2026, while 40% of all organizers expected budget growth. Accessibility requirements, including WCAG 2.2 and the European Accessibility Act, also favor services that provide captioning and multilingual delivery as standard capabilities.
Artificial Intelligence-Driven Personalization and Content Repurposing Lift Conversion
AI is changing how service providers prepare, deliver, and extend virtual programs. ON24 reported that personalized virtual event landing pages delivered a 3X increase in demo requests and a 2X rise in meetings booked in its life sciences benchmarks. The company also reported a 6X year-over-year increase in content output from a single webinar recording when teams used AI-generated derivative assets. Cvent stated that its CventIQ engine processes 12.7 billion attendee interactions annually and uses this data for attendance models, networking suggestions, and content recommendations. Goldcast's AI Content Lab can produce short video highlights and related assets from session recordings. These capabilities enable the Virtual Event Marketing Services Market to support campaigns that continue after the live session without requiring a corresponding increase in manual production work.
Webinar Fatigue Weakens Live Engagement and Networking
Heavy webinar calendars can reduce live participation and weaken networking results. The referenced Forrester survey found that nearly 70% of event leaders were reducing their total event count while protecting the quality of each program. Bizzabo reported that organizations with strong results averaged 412 registrations and a 52% event attendance rate. These figures indicate that buyers are placing more weight on relevance, production quality, and tailored interaction. The Virtual Event Marketing Services Market, therefore, faces pressure to deliver stronger outcomes rather than low-cost volume, including clear reasons for attendance and more useful opportunities for guided interaction. Providers that can show measurable results may gain funding from programs that would otherwise have been spread across basic webinar tools.
Other drivers and restraints analyzed in the detailed report include:
- First-Party Engagement Data Improves Revenue Attribution
- Always-On On-Demand Content Hubs Extend Campaign Life
- Data Privacy and Cross-Border Compliance Complexity Raises Delivery Risk
For complete list of drivers and restraints, kindly check the Table Of Contents.
Segment Analysis
Audience acquisition and registration management held 24.37% of the Virtual Event Marketing Services Market share in 2025. It meets a basic need because every program requires a qualified, permissioned audience before event delivery begins, and because downstream follow-up depends on accurate registration records. Enterprise teams increasingly judge registrations by lead quality, data completeness, readiness for campaign follow-up, and the ability to connect those records to existing customer systems. Registration workflows also establish the consent record needed to use engagement data responsibly after the event. This makes the service a practical entry point for providers that manage broader digital event campaigns.
Virtual product launch and live-stream promotion are projected to expand at a 16.69% CAGR from 2026 to 2031. Marketing teams use these formats to coordinate launches across regions without replicating physical programs. A live digital activation can generate first-party intent data while it introduces a product to a wider audience. Platform setup and operations remain important where teams need dependable integration across complex systems. Webinar, conference, engagement, and networking services gain relevance when personalized agendas and matched introductions are expected rather than optional.
Webinars accounted for 46.17% of the Virtual Event Marketing Services Market share in 2025. Their leading position reflects broad use in B2B demand generation and a delivery model that can be repeated across campaigns. Bizzabo reported that 53% of attendees planned to attend more webinars in 2026. The company also reported year-over-year attendance increases for 61% of organizers. These results support continued webinar use, even as audiences expect more relevant content and better production quality.
Virtual trade shows and expos are projected to expand at a 15.81% CAGR from 2026 to 2031, as exhibitors use extended digital lead-capture periods after live event dates and maintain contact with prospective buyers. Exhibitors value the lead-capture period that can remain open after the live event has ended. Virtual conferences and summits support higher-profile brand and executive communication programs. Live-streamed corporate events support investor relations and internal communication needs that require authentication, recording, and multiregion delivery. Training and workshop formats help distributed workforces avoid the cost of in-person certification travel, showing that the Virtual Event Marketing Services Market supports different requirements across formats.
Complete Report Scope:
- By Service Type
- Strategy and Campaign Planning
- Audience Acquisition and Registration Management
- Platform Setup and Event Operations
- Webinar and Virtual Conference Marketing
- Virtual Product Launch and Live-Stream Promotion
- Audience Engagement and Networking Services
- Other Service Types
- By Event Format
- Webinars
- Virtual Conferences and Summits
- Online Product Launches
- Virtual Trade Shows and Expos
- Live-Streamed Corporate Events
- Virtual Training and Workshops
- By Organization Size
- Large Enterprises
- Small and Medium-Sized Enterprises
- By End-User Industry
- Retail and E-commerce
- IT and Telecommunications
- BFSI
- Healthcare and Life Sciences
- Media and Entertainment
- Travel and Hospitality
- Manufacturing and Industrials
- Other End-User Industries (Automotive, Public Sector, amongst Others)
- By Geography
- North America
- United States
- Canada
- Mexico
- South America
- Brazil
- Argentina
- Chile
- Rest of South America
- Europe
- Germany
- United Kingdom
- France
- Italy
- Spain
- Rest of Europe
- Asia-Pacific
- China
- Japan
- India
- South Korea
- Australia
- Rest of Asia-Pacific
- Middle East
- United Arab Emirates
- Saudi Arabia
- Qatar
- Rest of Middle East
- Africa
- South Africa
- Egypt
- Nigeria
- Rest of Africa
- North America
Geography Analysis
North America held 39.86% of the Virtual Event Marketing Services Market share in 2025. The region brings together enterprise software vendors, marketing technology platforms, and event technology providers in a mature business environment, which supports a broad base of experienced buyers and specialist service providers. The United States drives demand across IT, BFSI, and healthcare, where customers seek integrated digital engagement. Cvent and Bizzabo are among the regional platform providers serving these needs. Canada supports financial services and government programs, while Mexico benefits from bilingual service demand from US-based multinationals.
Europe has a compliance-focused buyer base, led by Germany, the United Kingdom, and France. The European Union's 2025 GDPR enforcement agreement and the EU AI Act's full enforcement in 2026 are affecting platform evaluations. Providers with data residency settings, consent management, and AI documentation can gain an advantage in procurement reviews, as these controls address requirements that marketing teams cannot address through campaign design alone. Italy and Spain are secondary markets in manufacturing and professional services, while the United Kingdom's UK GDPR remains close enough to European rules to limit friction for regional programs.
Asia-Pacific is projected to expand at a 17.24% CAGR from 2026 to 2031, the fastest regional rate in the Virtual Event Marketing Services Market. India, China, Japan, and South Korea are the main demand centers, each supported by large technology, financial services, or business-to-business communications activity. India's IT services workforce, along with its BFSI and technology programs, supports frequent virtual engagement. A 2025 IT Communication Company survey ranked online seminars among the top 3 marketing activities for Japanese companies, and 51.9% of participants in media-hosted online seminars reported high effectiveness. China's enterprise digitalization supports webinar and conference use, while South Korea and Australia add demand from technology and financial services.
- Cvent Holding Corp.
- ON24, Inc.
- Bizzabo Ltd.
- 6Connex, Inc.
- vFairs LLC
- Airmeet Inc.
- BigMarker Holdings, Inc.
- Hubilo Technologies Inc.
- Zoom Communications, Inc.
- Cisco Systems, Inc.
- Microsoft Corporation
- Kaltura, Inc.
- RingCentral, Inc.
- EventMobi
- SpotMe SA
- Accelevents
- InEvent
- Goldcast Inc.
- Remo
- Whova Inc.
Additional Benefits:
- The market estimate (ME) sheet in Excel format
- 3 months of analyst support
TABLE OF CONTENTS
1 INTRODUCTION
- 1.1 Study Assumptions and Market Definition
- 1.2 Scope of the Study
2 RESEARCH METHODOLOGY
3 EXECUTIVE SUMMARY
4 MARKET LANDSCAPE
- 4.1 Market Overview
- 4.2 Market Drivers
- 4.2.1 Remote and Hybrid Work Programs Expand Digital Event Budgets
- 4.2.2 Cost-Efficient Global Reach Improves Virtual Event Economics
- 4.2.3 Artificial Intelligence-Driven Personalization and Content Repurposing Lift Conversion
- 4.2.4 First-Party Engagement Data Improves Revenue Attribution
- 4.2.5 Always-On On-Demand Content Hubs Extend Campaign Life
- 4.2.6 Sponsor Demand for Measurable Digital Activation Boosts Service Spend
- 4.3 Market Restraints
- 4.3.1 Webinar Fatigue Weakens Live Engagement and Networking
- 4.3.2 Data Privacy and Cross-Border Compliance Complexity Raises Delivery Risk
- 4.3.3 Fragmented Event Technology Stacks Create Data Silos and Friction
- 4.3.4 Return-on-Investment Proof Gaps Slow Budget Approval Cycles
- 4.4 Impact of Macroeconomic Factors on the Market
- 4.5 Industry Value-Chain Analysis
- 4.6 Technology Outlook
- 4.7 Regulatory Landscape
- 4.8 Porter's Five Forces Analysis
- 4.8.1 Threat of New Entrants
- 4.8.2 Bargaining Power of Suppliers
- 4.8.3 Bargaining Power of Buyers
- 4.8.4 Threat of Substitutes
- 4.8.5 Intensity of Competitive Rivalry
5 MARKET SIZE AND GROWTH FORECASTS (VALUE)
- 5.1 By Service Type
- 5.1.1 Strategy and Campaign Planning
- 5.1.2 Audience Acquisition and Registration Management
- 5.1.3 Platform Setup and Event Operations
- 5.1.4 Webinar and Virtual Conference Marketing
- 5.1.5 Virtual Product Launch and Live-Stream Promotion
- 5.1.6 Audience Engagement and Networking Services
- 5.1.7 Other Service Types
- 5.2 By Event Format
- 5.2.1 Webinars
- 5.2.2 Virtual Conferences and Summits
- 5.2.3 Online Product Launches
- 5.2.4 Virtual Trade Shows and Expos
- 5.2.5 Live-Streamed Corporate Events
- 5.2.6 Virtual Training and Workshops
- 5.3 By Organization Size
- 5.3.1 Large Enterprises
- 5.3.2 Small and Medium-Sized Enterprises
- 5.4 By End-User Industry
- 5.4.1 Retail and E-commerce
- 5.4.2 IT and Telecommunications
- 5.4.3 BFSI
- 5.4.4 Healthcare and Life Sciences
- 5.4.5 Media and Entertainment
- 5.4.6 Travel and Hospitality
- 5.4.7 Manufacturing and Industrials
- 5.4.8 Other End-User Industries (Automotive, Public Sector, amongst Others)
- 5.5 By Geography
- 5.5.1 North America
- 5.5.1.1 United States
- 5.5.1.2 Canada
- 5.5.1.3 Mexico
- 5.5.2 South America
- 5.5.2.1 Brazil
- 5.5.2.2 Argentina
- 5.5.2.3 Chile
- 5.5.2.4 Rest of South America
- 5.5.3 Europe
- 5.5.3.1 Germany
- 5.5.3.2 United Kingdom
- 5.5.3.3 France
- 5.5.3.4 Italy
- 5.5.3.5 Spain
- 5.5.3.6 Rest of Europe
- 5.5.4 Asia-Pacific
- 5.5.4.1 China
- 5.5.4.2 Japan
- 5.5.4.3 India
- 5.5.4.4 South Korea
- 5.5.4.5 Australia
- 5.5.4.6 Rest of Asia-Pacific
- 5.5.5 Middle East
- 5.5.5.1 United Arab Emirates
- 5.5.5.2 Saudi Arabia
- 5.5.5.3 Qatar
- 5.5.5.4 Rest of Middle East
- 5.5.6 Africa
- 5.5.6.1 South Africa
- 5.5.6.2 Egypt
- 5.5.6.3 Nigeria
- 5.5.6.4 Rest of Africa
- 5.5.1 North America
6 COMPETITIVE LANDSCAPE
- 6.1 Market Concentration
- 6.2 Strategic Moves
- 6.3 Market Share Analysis
- 6.4 Company Profiles (includes Global Level Overview, Market Level Overview, Core Segments, Financials as available, Strategic Information, Market Rank/Share, Products and Services, Recent Developments)
- 6.4.1 Cvent Holding Corp.
- 6.4.2 ON24, Inc.
- 6.4.3 Bizzabo Ltd.
- 6.4.4 6Connex, Inc.
- 6.4.5 vFairs LLC
- 6.4.6 Airmeet Inc.
- 6.4.7 BigMarker Holdings, Inc.
- 6.4.8 Hubilo Technologies Inc.
- 6.4.9 Zoom Communications, Inc.
- 6.4.10 Cisco Systems, Inc.
- 6.4.11 Microsoft Corporation
- 6.4.12 Kaltura, Inc.
- 6.4.13 RingCentral, Inc.
- 6.4.14 EventMobi
- 6.4.15 SpotMe SA
- 6.4.16 Accelevents
- 6.4.17 InEvent
- 6.4.18 Goldcast Inc.
- 6.4.19 Remo
- 6.4.20 Whova Inc.
7 MARKET OPPORTUNITIES AND FUTURE OUTLOOK
- 7.1 White-Space and Unmet-Need Assessment


