


 |
市場調查報告書
商品編碼
2118214
OTT串流媒體播放機:市場佔有率分析、產業趨勢與統計數據、成長預測(2026-2031年)OTT Streaming Media Player - Market Share Analysis, Industry Trends & Statistics, Growth Forecasts (2026 - 2031) |
||||||

※ 本網頁內容可能與最新版本有所差異。詳細情況請與我們聯繫。
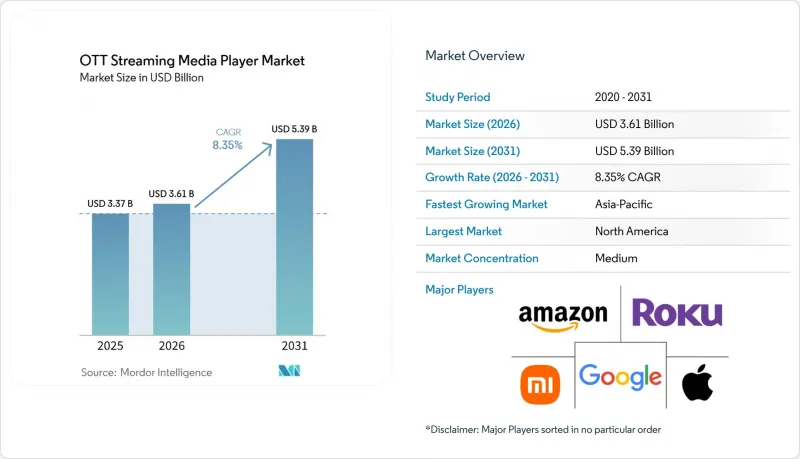
根據 Mordor Intelligence 的數據顯示,2025 年 OTT 串流媒體播放機市值為 33.7 億美元,預計 2026 年將達到 36.1 億美元。預計在 2026 年至 2031 年的預測期內,該市場將以 8.35% 的複合年成長率成長,到 2031 年將達到 53.9 億美元。
本報告按產品類型(插件串流播放器和獨立式串流媒體播放器)、作業系統平台(Fire TV、Roku OS、Google TV 和 Android TV、Apple tvOS 等)、銷售管道(線上和線下)以及地區(北美、南美、歐洲、亞太、中東和非洲)進行細分。市場預測以美元(USD)計價。
全球OTT串流媒體播放機市場趨勢與洞察
消費者對停掉有線電視服務)的需求,以及以聯網電視。
傳統付費電視的衰退仍然是推動OTT串流媒體播放機市場發展的主要動力。這是因為這種轉變正在將這些設備從普通的周邊設備轉變為價格親民的應用程式、直播頻道和影片庫的入口,而這些內容如今已成為每個家庭的日常必需品。到2025年12月,串流媒體將占美國電視觀看時間的47.5%,超過有線電視和地面電波電視月均觀看時間的總和。這清晰地展現了觀看習慣轉變的規模。這種轉變催生了對能夠將舊顯示器連接到串流媒體服務的簡易設備的需求,尤其是在那些尚未更換功能完好的電視面板的家庭中。許多家庭可以選擇購買35至50美元的串流媒體棒,而不是購買新的智慧電視,從而在採用串流媒體服務方面保持柔軟性。由於低成本設備允許安裝最新的軟體和應用程式來增強現有螢幕的功能,因此即使在智慧電視普及率高的地區,對即插即用播放器的需求也將持續存在。此外,年輕一代取消付費電視訂閱導致主要依賴串流影片內容且需要簡單連網電視介面的家庭數量增加。
快速且廣告支援的串流媒體的興起
廣告支援的免費串流電視(FAST)正在改變OTT串流媒體播放機市場的商業性格局,它將裝置啟動與廣告空間和受眾覆蓋範圍更緊密地聯繫起來。截至2026年3月,FAST平台占美國電視觀賞時間的6.1%,顯示這種模式正逐漸成為連網電視的主流使用方式。根據Amagi追蹤的頻道顯示,2026年4月至6月全球FAST觀看時間較去年同期成長55%。 50歲及以上觀眾的FAST總觀看時間超過了Netflix,顯示一些以前觀看有線電視的觀眾正在轉向廣告支援型服務,而不是完全放棄電視。連網電視設備是提供支援這些服務的廣告空間所必需的,因此設備安裝仍然在平台的經濟效益中扮演著至關重要的角色。因此,如果新設備的啟動能夠帶來廣告、訂閱試用和持續觀看的機會,並且符合允許的隱私法規,平台運營商就可以將硬體利潤率保持在較低水平。同期,南美洲的 FAST 觀看時間比去年同期成長了 190%,這表明存在由廣告支援的觀看而非付費訂閱驅動的需求。
更換智慧電視並延長更換週期
整合智慧電視的作業系統是OTT串流媒體播放機市場的主要結構性限制因素。這是因為消費者無需購買額外設備即可使用熟悉的串流應用程式。預計到2025年,全球串流媒體裝置出貨量將下降4.8%至5,900萬台,反映出在智慧電視滲透率高的市場中,該設備類別已趨於成熟。售價在200至400美元之間的智慧電視擴大配備了相當於50美元外接設備的功能,可以存取主流串流媒體庫,這縮小了購買新電視的家庭的實際體驗差異。這降低了外接裝置對購買電視的家庭的附加價值,尤其是在電視預裝作業系統已經能夠滿足其應用需求的情況下。為了應對這項挑戰,亞馬遜、Roku和谷歌正在向電視製造商授權其作業系統,這不僅擴大了其平台的覆蓋範圍,也降低了對獨立播放器銷售的依賴。此外,北美和歐洲 7-8 年的更換週期也是抑制 2017 年至 2022 年間購買了串流面板的家庭短期需求的因素。
細分市場分析
到2025年,即插即用的串流媒體播放器將佔據OTT串流媒體播放機市場53.42%的佔有率,成為該品類銷量領先的產品。在北美和歐洲,價格低於50美元的入門級產品,尤其是電視棒和電視轉換器,滿足了消費者對價格敏感的需求。許多消費者更傾向於升級螢幕,而不是更換整台電視。這些產品利用現有的電視螢幕,透過HDMI介面直接連接,無需複雜的安裝。這樣一來,用戶無需購買新的顯示器,既能延長現有高畫質電視的使用壽命,又能享受最新的串流應用。許多型號無需單獨的電源插座,因此可以輕鬆安裝在現有顯示器的位置,例如臥室或次臥。線上管道在這一品類中扮演著重要角色,因為促銷設備和訂閱福利可以降低用戶的實際成本,並提高平台營運商的啟動率。
亞馬遜的 Fire TV Stick 4K Max 展示了這種即插即用型設備的最新功能,滿足了以往主要由機上盒提供的畫質、無線性能和存儲需求。它配備 Wi-Fi 6E、杜比視界、四核心處理器和 16GB 儲存空間,售價不到 60 美元。這款硬體讓消費者無需更換昂貴的機上盒即可升級設備,同時平台供應商也能持續觸及對價格敏感的用戶群。預計到 2031 年,獨立串流媒體播放器市場將以 9.06% 的複合年成長率成長。蘋果計劃於 2026 年推出的 Apple TV 4K 和 NVIDIA 的 Shield TV Pro 都旨在滿足用戶對小型資料庫、乙太網路連接或持續 4K60 HDR 效能的需求。獨立串流媒體播放器還可以滿足遊戲和串流媒體的交叉需求,滿足用戶對長時間使用、豐富功能和強大處理能力的需求。
區域分析
預計到2025年,北美將佔全球銷售額的42.37%,這主要得益於大量家庭從傳統付費電視轉向以串流媒體為中心的觀看方式。這一趨勢使該地區成為新設備購買和升級的關鍵市場,滿足了用戶對不同作業系統平台、更強大的無線功能或更高畫質的需求。寬頻普及率和現有設備的擁有率為整個OTT串流媒體播放機市場的更換需求提供了強勁基礎。 2026年第一季,Roku佔據了串流媒體播放機市場43%的佔有率,亞馬遜則佔了30%的佔有率,顯示兩大設備生態系統之間存在激烈的競爭。在加拿大,沃爾瑪+於2026年6月推出了一項新的零售捆綁服務,將Crave串流服務與其現有服務結合,這又是一個零售捆綁服務的案例。同時,墨西哥雖然發展水平低於北美平均水平,但隨著價格更低的設備和內容庫的獲取變得更加便捷,其高所得的都市區消費者群體也呈現出成長動能。
在歐洲,推動市場成長的並非是那些發展尚不成熟的市場中出現的初期流媒體普及率,而是高清硬體向4K HDR設備的升級換代。德國的光纖普及率預計將從2024年的16%上升到2029年的近50%,這將增加能夠支援高畫質影片服務和連網裝置的家庭數量。在英國,Sky Stream將地面電波直播頻道和OTT服務整合到一個緊湊的機上盒中,展示了廣播公司如何利用硬體來提高內容留存率。法國和西班牙的電信業者IPTV供應商也正在採用類似的方法,將設備、客戶關係和訂閱方案連接起來。南美洲的需求趨勢有所不同,巴西在該地區扮演著核心角色,預計到2025年,44.4%的巴西家庭將能夠使用付費影片串流服務。
儘管亞太地區在全球串流觀看時長中佔據相當大的比例,但其在全球串流媒體收入中所佔佔有率卻較低,導致該地區在高階硬體方面的支出受到限制,而對中階設備的需求依然旺盛。預計到2031年,亞太地區將以9.11%的複合年成長率推動區域成長,使其成為OTT串流媒體播放機市場的重要擴張區域。預計到2025年,印度的OTT月有效用戶將達到14.5億,到2028年,智慧型手機用戶將達到8.85億,大規模的用戶群未來可望轉向連網電視觀看。 2026年4月,JioHotstar推出了基於ChatGPT的語音搜尋功能,支援多種印度語言的自然語言搜尋。同時,截至2025年12月,中國線上影片用戶數已達10.99億。小米的整合硬體和串流生態系統部署在中國價值1.29兆元人民幣(1800億美元)的線上影像和音訊領域,隨著寬頻和行動通訊普及率的進一步提高,阿拉伯聯合大公國、南非和其他新興市場也可能從中受益。
其他好處:
- Excel格式的市場預測(ME)表
- 3個月的分析師支持
目錄
第1章:引言
- 研究假設和市場定義
- 調查範圍
第2章:調查方法
第3章執行摘要
第4章 市場狀況
- 市場概覽
- 市場促進因素
- 停掉有線電視服務,更換尋求聯網電視。
- 快速且廣告支援的串流媒體發現的成長
- 適用於 4K HDR 和 Wi-Fi 6 相容裝置的升級
- 在寬頻和5G普及率低的家庭中擴大覆蓋範圍
- 人工智慧驅動的跨服務內容發現
- 零售商和平台捆綁銷售低成本串流硬體
- 市場限制因素
- 向智慧電視的轉變以及更換週期的延長。
- 硬體商品化和利潤率下降。
- 內容和應用程式相容性以及平台碎片化
- 隱私、廣告成效衡量與資料使用限制
- 產業價值鏈分析
- 監理情勢
- 技術展望
- 波特五力分析
- 宏觀經濟因素對市場的影響
第5章 市場規模與成長預測
- 依產品類型
- 外掛式串流播放器
- 獨立串流媒體播放器
- 透過作業系統
- Fire TV
- Roku OS
- Google TV 和 Android TV
- Apple tvOS
- 其他營運平台
- 按銷售管道
- 線上
- 離線
- 按地區
- 北美洲
- 美國
- 加拿大
- 墨西哥
- 南美洲
- 巴西
- 阿根廷
- 智利
- 其他南美國家
- 歐洲
- 德國
- 英國
- 法國
- 義大利
- 西班牙
- 其他歐洲國家
- 亞太地區
- 中國
- 日本
- 印度
- 韓國
- 澳洲
- 其他亞太國家
- 中東
- 沙烏地阿拉伯
- 阿拉伯聯合大公國
- 卡達
- 其他中東國家
- 非洲
- 南非
- 埃及
- 奈及利亞
- 其他非洲國家
- 北美洲
第6章 競爭情勢
- 市場集中度
- 策略趨勢
- Vendor Positioning Analysis
- 公司簡介
- Roku, Inc.
- Amazon.com, Inc.
- Google LLC
- Apple Inc.
- Xiaomi Corporation
- Walmart Inc.
- NVIDIA Corporation
- Sony Corporation
- ASUSTeK Computer Inc.
- Sagemcom SAS
- Shenzhen Xgimi Technology Co., Ltd.
- Hisense Group
- Sky UK Limited
- Comcast Corporation
- Bharti Airtel Limited
- Haier Group Corporation
- Realme Mobile Telecommunications(Shenzhen)Co., Ltd.
第7章 市場機會與未來展望
According to Mordor Intelligence, the OTT streaming media player market size was valued at USD 3.37 billion in 2025, is estimated at USD 3.61 billion in 2026, and is forecast to reach USD 5.39 billion by 2031, at a CAGR of 8.35% during the forecast period, 2026-2031.
This report is Segmented by Product Type (Plug-In Streaming Players, and Standalone Streaming Players), Operating Platform (Fire TV, Roku OS, Google TV and Android TV, Apple TvOS, and More), Sales Channel (Online, and Offline), and Geography (North America, South America, Europe, Asia-Pacific, Middle East, and Africa). The Market Forecasts are Provided in Terms of Value (USD).
Global OTT Streaming Media Player Market Trends and Insights
Cord-Cutting and Connected TV Replacement Demand
The move away from traditional pay television remains a central demand factor for the OTT streaming media player market, as it shifts the device from a discretionary accessory into an affordable gateway to the applications, live channels, and video libraries households use every day. Streaming accounted for 47.5% of U.S. television viewing in December 2025 and exceeded cable and broadcast viewing combined on a full-month average basis, underscoring the scale of this shift in viewing behavior. The change creates demand for simple devices that connect older displays to streaming services, especially for homes that have not yet replaced functional television panels. Many households can choose a USD 35-50 streaming stick instead of purchasing a new smart television, preserving flexibility in adopting streaming services. This choice preserves demand for plug-in players even where smart television ownership is already high, since a low-cost device can improve an existing screen with current software and applications. Pay television losses among younger consumers also extend the pool of households that rely on streaming-first video access and may need a straightforward connected television interface.
Growth of FAST and Ad-Supported Streaming Discovery
Free ad-supported streaming television is changing the commercial role of the OTT streaming media player market by tying device activation more closely to advertising inventory and audience reach. FAST platforms represented 6.1% of U.S. television viewing in March 2026, demonstrating that this format has become part of mainstream connected television use. Global FAST viewing hours across Amagi-tracked channels rose 55% year over year during April-June 2026. Aggregated FAST viewing among viewers older than 50 exceeded Netflix usage, which shows that some former cable audiences are moving into ad-supported services rather than leaving television viewing altogether. Connected television devices are required to deliver the advertising inventory that supports these services, giving device placement a continuing role in platform economics. Platform owners can therefore accept lower hardware margins when additional device activations create advertising, subscription-trial, and recurring-viewing opportunities, within permitted privacy rules. South American FAST viewing hours rose 190% year over year during the same period, pointing to demand that can be led by ad-supported viewing rather than paid subscriptions.
Smart TV Substitution and Longer Replacement Cycles
Integrated smart television operating systems are the main structural restraint for the OTT streaming media player market, as they give buyers access to familiar streaming applications without requiring a separate device. Global media streamer shipments fell 4.8% to 59 million units in 2025, reflecting a more mature device category in markets with high smart television penetration. Smart televisions priced at USD 200-400 increasingly include access to the same major streaming libraries as a USD 50 dongle, reducing the practical difference for a household buying a new display. This narrows the added value of an external device for households purchasing a television, particularly when the installed operating system already meets their application needs. Amazon, Roku, and Google have responded by licensing their operating systems to television manufacturers, which broadens platform reach but lowers reliance on standalone player volumes. Replacement cycles of 7-8 years in North America and Europe also reduce near-term demand from households with streaming-capable panels purchased between 2017 and 2022.
Other drivers and restraints analyzed in the detailed report include:
- 4K HDR and Wi-Fi 6 Device Upgrades
- Broadband and 5G Expansion in Underpenetrated Households
- Hardware Commoditization and Margin Compression
For complete list of drivers and restraints, kindly check the Table Of Contents.
Segment Analysis
Plug-in streaming players held 53.42% of the OTT streaming media player market share in 2025, making them the category's main volume product. Dongles and sticks meet price-sensitive demand for sub-USD 50 entry points in North America and Europe, where many consumers prefer to upgrade a screen rather than replace it. They use existing television panels and connect directly via HDMI ports, eliminating the need for a more complex installation. This removes the need for a new display and helps households extend the life of older HD television inventories while adding current streaming applications. Many models require no separate power outlet, making them easy to install in bedrooms, secondary rooms, and other locations with existing displays. The online channel is important for this category because promotional devices and subscription offers can lower the effective cost for buyers and improve activation rates for platform owners.
Amazon's Fire TV Stick 4K Max shows the current capability of the plug-in format, which now addresses image quality, wireless performance, and storage needs that were once associated mainly with set-top boxes. It combines Wi-Fi 6E, Dolby Vision, a quad-core processor, and 16GB of storage at a price below USD 60. This hardware gives consumers a practical upgrade without moving into a higher-priced set-top box, while allowing platform providers to retain access to price-conscious users. Standalone streaming players are projected to grow at a 9.06% CAGR through 2031. Apple's planned 2026 Apple TV 4K refresh and NVIDIA Shield TV Pro address users who want local storage, Ethernet connectivity, or sustained 4K60 HDR performance. Standalone boxes can also serve the gaming and streaming crossover segment, where long operating sessions, richer feature sets, and stronger processing capacity matter.
Complete Report Scope:
- By Product Type
- Plug-In Streaming Players
- Standalone Streaming Players
- By Operating Platform
- Fire TV
- Roku OS
- Google TV and Android TV
- Apple tvOS
- Other Operating Platforms
- By Sales Channel
- Online
- Offline
- By Geography
- North America
- United States
- Canada
- Mexico
- South America
- Brazil
- Argentina
- Chile
- Rest of South America
- Europe
- Germany
- United Kingdom
- France
- Italy
- Spain
- Rest of Europe
- Asia-Pacific
- China
- Japan
- India
- South Korea
- Australia
- Rest of Asia-Pacific
- Middle East
- Saudi Arabia
- United Arab Emirates
- Qatar
- Rest of Middle East
- Africa
- South Africa
- Egypt
- Nigeria
- Rest of Africa
- North America
Geography Analysis
North America held a 42.37% revenue share in 2025, supported by a large base of households moving away from traditional pay television toward streaming-first access. This foundation makes the region important for both new device purchases and upgrades among users who want a different operating platform, stronger wireless performance, or better picture quality. Broadband availability and established device ownership provide a strong basis for replacement purchases across the OTT streaming media player market. Roku accounted for 43% of streaming media player purchases in the first quarter of 2026, while Amazon accounted for 30%, showing active competition between the two leading device ecosystems. Canada added a retail bundling example when Walmart+ launched with Crave streaming access in June 2026, while Mexico remains less developed than the continental average but is seeing uptake among urban higher-income customers as lower-cost devices and content catalogs become more accessible.
Europe is supported by an upgrade cycle from HD hardware to 4K HDR devices, rather than by the same level of first-time streaming adoption seen in less mature markets. Germany's fiber share was projected to rise from 16% in 2024 to nearly 50% by 2029, which would expand the number of homes able to support higher-quality video services and connected devices. Sky Stream in the United Kingdom combines live terrestrial channels and OTT services in a compact set-top box, showing how broadcasters can use hardware to support content retention. Telecom-affiliated IPTV providers in France and Spain use comparable approaches that link a device, a customer relationship, and a subscription offer. South America has a different demand profile, with Brazil acting as the regional anchor and paid video streaming services present in 44.4% of Brazilian households in 2025.
The region generates a high share of global streaming hours but receives a lower share of global streaming revenue, which constrains spending on premium hardware while maintaining a need for devices at mid-market price points. Asia-Pacific is projected to lead geographic growth with a 9.11% CAGR through 2031, making it an important expansion area for the OTT streaming media player market. India's OTT monthly active users reached 1.45 billion in 2025, and smartphone users are projected to reach 885 million by fiscal year 2028, providing a large user base that may later move toward connected television viewing. JioHotstar introduced a ChatGPT-powered voice discovery capability in April 2026 for natural-language searches across multiple Indian languages, while China's online video user base reached 1.099 billion by December 2025. Xiaomi's integrated hardware and streaming ecosystem operated within a Chinese online audio-visual sector valued at CNY 1.29 trillion (USD 180 billion), and the United Arab Emirates, South Africa, and other early-stage markets can benefit as broadband and mobile coverage develop further.
- Roku, Inc.
- Amazon.com, Inc.
- Google LLC
- Apple Inc.
- Xiaomi Corporation
- Walmart Inc.
- NVIDIA Corporation
- Sony Corporation
- ASUSTeK Computer Inc.
- Sagemcom SAS
- Shenzhen Xgimi Technology Co., Ltd.
- Hisense Group
- Sky UK Limited
- Comcast Corporation
- Bharti Airtel Limited
- Haier Group Corporation
- Realme Mobile Telecommunications (Shenzhen) Co., Ltd.
Additional Benefits:
- The market estimate (ME) sheet in Excel format
- 3 months of analyst support
TABLE OF CONTENTS
1 INTRODUCTION
- 1.1 Study Assumptions and Market Definition
- 1.2 Scope of The Study
2 RESEARCH METHODOLOGY
3 EXECUTIVE SUMMARY
4 MARKET LANDSCAPE
- 4.1 Market Overview
- 4.2 Market Drivers
- 4.2.1 Cord-Cutting and Connected-TV Replacement Demand
- 4.2.2 Growth of FAST and Ad-Supported Streaming Discovery
- 4.2.3 4K HDR and Wi-Fi 6 Device Upgrades
- 4.2.4 Broadband and 5G Expansion in Underpenetrated Households
- 4.2.5 AI-Powered Cross-Service Content Discovery
- 4.2.6 Retailer and Platform Bundling of Low-Cost Streaming Hardware
- 4.3 Market Restraints
- 4.3.1 Smart TV Substitution and Longer Replacement Cycles
- 4.3.2 Hardware Commoditization and Margin Compression
- 4.3.3 Content-App Compatibility and Platform Fragmentation
- 4.3.4 Privacy, Advertising-Measurement, and Data-Use Restrictions
- 4.4 Industry Value Chain Analysis
- 4.5 Regulatory Landscape
- 4.6 Technological Outlook
- 4.7 Porter's Five Forces Analysis
- 4.7.1 Bargaining Power of Buyers
- 4.7.2 Bargaining Power of Suppliers
- 4.7.3 Threat of New Entrants
- 4.7.4 Threat of Substitutes
- 4.7.5 Intensity of Competitive Rivalry
- 4.8 Impact of Macroeconomic Factors on the Market
5 MARKET SIZE AND GROWTH FORECASTS (VALUE)
- 5.1 By Product Type
- 5.1.1 Plug-In Streaming Players
- 5.1.2 Standalone Streaming Players
- 5.2 By Operating Platform
- 5.2.1 Fire TV
- 5.2.2 Roku OS
- 5.2.3 Google TV and Android TV
- 5.2.4 Apple tvOS
- 5.2.5 Other Operating Platforms
- 5.3 By Sales Channel
- 5.3.1 Online
- 5.3.2 Offline
- 5.4 By Geography
- 5.4.1 North America
- 5.4.1.1 United States
- 5.4.1.2 Canada
- 5.4.1.3 Mexico
- 5.4.2 South America
- 5.4.2.1 Brazil
- 5.4.2.2 Argentina
- 5.4.2.3 Chile
- 5.4.2.4 Rest of South America
- 5.4.3 Europe
- 5.4.3.1 Germany
- 5.4.3.2 United Kingdom
- 5.4.3.3 France
- 5.4.3.4 Italy
- 5.4.3.5 Spain
- 5.4.3.6 Rest of Europe
- 5.4.4 Asia-Pacific
- 5.4.4.1 China
- 5.4.4.2 Japan
- 5.4.4.3 India
- 5.4.4.4 South Korea
- 5.4.4.5 Australia
- 5.4.4.6 Rest of Asia-Pacific
- 5.4.5 Middle East
- 5.4.5.1 Saudi Arabia
- 5.4.5.2 United Arab Emirates
- 5.4.5.3 Qatar
- 5.4.5.4 Rest of Middle East
- 5.4.6 Africa
- 5.4.6.1 South Africa
- 5.4.6.2 Egypt
- 5.4.6.3 Nigeria
- 5.4.6.4 Rest of Africa
- 5.4.1 North America
6 COMPETITIVE LANDSCAPE
- 6.1 Market Concentration
- 6.2 Strategic Moves
- 6.3 Vendor Positioning Analysis
- 6.4 Company Profiles (includes Global Level Overview, Market Level Overview, Core Segments, Financials as available, Strategic Information, Market Rank/Share, Products and Services, Recent Developments)
- 6.4.1 Roku, Inc.
- 6.4.2 Amazon.com, Inc.
- 6.4.3 Google LLC
- 6.4.4 Apple Inc.
- 6.4.5 Xiaomi Corporation
- 6.4.6 Walmart Inc.
- 6.4.7 NVIDIA Corporation
- 6.4.8 Sony Corporation
- 6.4.9 ASUSTeK Computer Inc.
- 6.4.10 Sagemcom SAS
- 6.4.11 Shenzhen Xgimi Technology Co., Ltd.
- 6.4.12 Hisense Group
- 6.4.13 Sky UK Limited
- 6.4.14 Comcast Corporation
- 6.4.15 Bharti Airtel Limited
- 6.4.16 Haier Group Corporation
- 6.4.17 Realme Mobile Telecommunications (Shenzhen) Co., Ltd.
7 MARKET OPPORTUNITIES AND FUTURE OUTLOOK
- 7.1 White-Space and Unmet-Need Assessment

 全球智慧家庭硬體市場規模、佔有率、趨勢和成長分析報告(2026-2034年)
 智慧家庭硬體市場規模、佔有率和成長分析:按產品類型、通訊技術、應用和地區分類-2026-2033年產業預測
 智慧家庭硬體住宅室內金屬製品市場報告:趨勢、預測與競爭分析(至 2031 年)