


 |
市場調查報告書
商品編碼
2118101
人工智慧作業系統:市場佔有率分析、產業趨勢與統計及成長預測(2026-2031)AI Operating System - Market Share Analysis, Industry Trends & Statistics, Growth Forecasts (2026 - 2031) |
||||||

※ 本網頁內容可能與最新版本有所差異。詳細情況請與我們聯繫。
根據 Mordor Intelligence 預測,人工智慧作業系統市場規模將從 2025 年的 91.7 億美元和 2026 年的 110.2 億美元成長到 2031 年的 331.3 億美元,2026 年至 2031 年的年複合成長率(CAGR)為 24.63%。
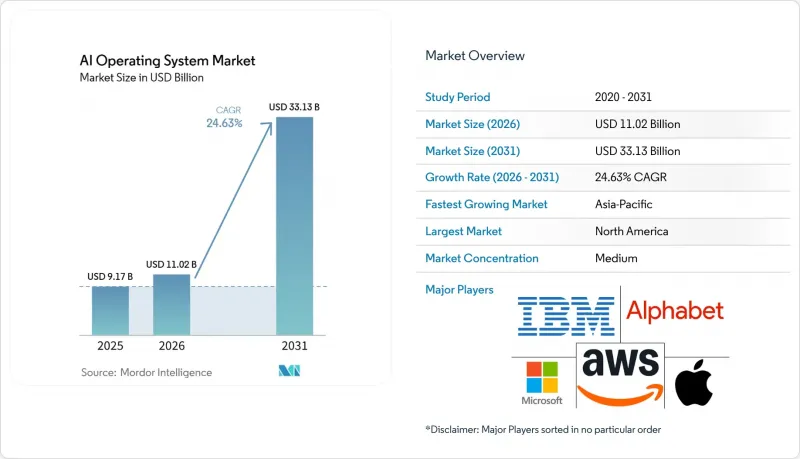
本報告按模型整合方式(設備端AI作業系統、雲端原生AI作業系統、混合AI作業系統)、平台(行動裝置、桌上型電腦和筆記型電腦、嵌入式和邊緣運算、其他)、最終用戶(IT和電信、銀行、金融服務和保險、汽車和交通運輸、醫療保健和生命科學、其他)以及地區進行細分。市場預測以美元(USD)為單位。
全球人工智慧作業系統市場趨勢與洞察
企業對具備管治的AI編配的需求
人工智慧作業系統市場正受益於對能夠核准、記錄和審查每個模型行為的系統的需求。當人工智慧工具與客戶資料、營運記錄或受監管的工作流程互動時,企業需要這些功能。 2026年6月,微軟在20個Azure區域正式發表了Azure AI Foundry代理服務,該服務具備沙盒運算、驗證功能、管治工具和可觀測性等特性。此次發布表明,企業買家希望管治功能從生產階段就可用,而不是後期添加。此外,歐盟人工智慧法規引入了透明度、風險管理和文件記錄方面的要求,鼓勵企業選擇整合管治功能的平台。因此,金融、醫療保健和政府部門的大型企業傾向於將其人工智慧工具標準化,而中小企業可能繼續使用輕量級自動化產品。
人工智慧加速器和配備NPU的設備日益普及
專用處理器的供應量不斷擴大,正在拓寬人工智慧作業系統市場的技術基礎。更快的加速器使得大規模運行推理、記憶體和代理工作負載成為可能。 NVIDIA 報告稱,其 2026 會計年度的資料中心營收年增 68%,達到 1,937 億美元,並表示「Blackwell Ultra」與「Hopper」相比,可將代理工作負載的成本降低高達 35 倍。該公司還發布了專為基於代理的工作負載設計的平台“Vera Rubin”,並透露其每個推理代幣的成本比 Blackwell 低 10 倍。雖然這些優勢能夠實現大規模的部署,但大型雲端服務供應商和資金雄厚的公司很可能率先獲得最大的收益。此外,部署在行動裝置、個人電腦、汽車和工業設備中的人工智慧硬體的激增,也為軟體供應商提供了更多本地智慧部署方案。
高昂的運算、記憶體和能源成本
運算、記憶體和電力需求仍然是人工智慧作業系統市場面臨的重大限制。生產代理工作負載比簡單的推理請求需要更多資源,因為它們可能涉及持久記憶體、多階段推理以及多個代理之間的協作。對於無法享受大型雲端客戶批量折扣的中型企業而言,這種負擔可能構成重大挑戰。能源需求的成長也會影響資料中心規劃,可能會延緩電力供應緊張地區的容量擴張。 NVIDIA 報告稱,其在降低每次推理代幣成本方面取得了進展,這為降低營運成本提供了一條途徑。然而,對於那些不得不以市場價格購買容量的企業而言,這些改進並不能立即消除財務障礙。
細分市場分析
預計到 2025 年,混合平台將佔據人工智慧作業系統市場 42.31% 的佔有率。這使得企業能夠在本地處理敏感請求的同時,保持對雲端模型的訪問,以應對更複雜的任務。這種平衡對於金融服務、醫療保健、政府機構以及其他需要數據居住管理的用戶至關重要。 Microsoft Foundry 提供了一個託管代理,該代理具有沙盒運算環境,並可連接到 Azure 模型結束點,展示了雲端供應商如何支援這種設計。這種方法減少了在更強大的模型功能和嚴格處理敏感資訊之間做出選擇的必要性。它還為技術團隊提供了一種實用的方法,可以根據風險、延遲、資料儲存位置和本地運算資源的可用性來分配工作負載。這種柔軟性簡化了內部核准流程,即使不同的業務部門遵循各自的資料處理規則。
預計從 2026 年到 2031 年,設備端平台將以 27.84% 的複合年成長率成長。 2026 年 6 月,蘋果在 iOS 27、macOS 27、iPadOS 27、watchOS 27 和 visionOS 27 中預覽了下一代 Apple Intelligence 和 Siri AI。本地處理不僅可以保護隱私,還可以在網路連線不穩定的環境下提高回應速度。對於需要非常大規模的上下文視窗或快速模型變更的任務,雲端原生平台仍然至關重要。在這三種方法中,客戶越來越重視模型版本控制、效能監控、回溯功能和稽核記錄。這些功能擴大被整合到平台功能中,而不是作為獨立的管理工具。買家可以利用通用的控制結構來比較模型版本、審查變更,並在模型產生不當結果時做出適當的回應。當團隊使用多個模型並且必須在應用程式之間保持一致的記錄時,這一點至關重要。
區域分析
到2025年,北美將佔總收入的36.42%。美國聚集了眾多雲端服務供應商、模型開發人員和企業平台公司。 NIST人工智慧風險管理框架為買家提供了一個廣泛認可的評估管治和風險管理的框架。這可能使從一開始就將風險管理和文件納入考慮的提供者獲得優勢。加拿大正透過其多倫多、蒙特婁和溫哥華的叢集加強其研究和技術活動。在墨西哥,隨著實用化的不斷進步,嵌入式自動化在製造業和物流行業的應用日益廣泛。
預計到2031年,亞太地區的複合年成長率將達到28.73%。中國正透過公共政策和國內技術生態系統拓展人工智慧應用,而日本和韓國則正發揮其在汽車、機器人、家用電子電器和半導體領域的優勢。印度和東南亞地區則呈現出行動優先的需求、數位基礎設施的建設以及企業雲採用率的提升。隨著本地人工智慧技術在工業控制系統、車輛系統和企業軟體中的應用日益廣泛,該地區的商機已不再局限於消費性設備。人工智慧作業系統市場的區域需求呈現多樣化,各國對設備類型、國內供應商和部署模式的重點各不相同。
歐洲是第三大人工智慧應用區域,其中德國、英國和法國在工業、金融和公共部門的應用方面處於領先地位。歐盟人工智慧立法要求高風險應用必須符合相關規定,同時也推動了對具備審計、透明度和風險管理功能的平台的需求。南美洲的人工智慧應用仍處於早期階段,主要集中在金融服務和數位政府領域。基礎設施的限制和人才短缺可能會減緩該地區更廣泛的應用。在中東和非洲,沙烏地阿拉伯和阿拉伯聯合大公國(阿拉伯聯合大公國)是活躍的投資中心。 NVIDIA宣布,其DRIVE Hyperion平台支援L4級自動駕駛計程車的部署,並正與HUMAIN合作在中東地區部署。
其他好處:
- Excel格式的市場預測(ME)表
- 3個月的分析師支持
目錄
第1章:引言
- 研究假設和市場定義
- 調查範圍
第2章:調查方法
第3章執行摘要
第4章 市場狀況
- 市場概覽
- 市場促進因素
- 企業對具有可控管治的AI編配的需求。
- 人工智慧加速器和配備NPU的設備日益普及
- 擴展設備端和邊緣人工智慧處理能力
- 自主代理和目標導向介面的發展
- 對模型生命週期管理和可審計性的要求日益提高。
- 用於舊有系統現代化的代理操作層
- 市場限制因素
- 高昂的運算成本、記憶體成本和能源成本
- 資料隱私、安全和監管合規方面的負擔。
- 硬體碎片化和互通性差距
- 整合遺留企業系統的複雜性
- 宏觀經濟因素對市場的影響
- 產業價值鏈分析
- 科技趨勢
- 監理情勢
- 波特五力分析
第5章 市場規模與成長預測
- 模型整合方法
- 設備端人工智慧作業系統
- 雲端原生人工智慧作業系統
- 混合人工智慧作業系統
- 按平台
- 移動的
- 桌上型電腦和筆記型電腦
- 嵌入式和邊緣
- 其他平台
- 最終用戶
- 資訊科技/通訊
- BFSI
- 汽車和運輸業
- 醫療保健和生命科學
- 零售與電子商務
- 工業製造
- 教育和研究機構
- 政府/行政部門
- 能源公用事業
- 其他最終用戶
- 按地區
- 北美洲
- 美國
- 加拿大
- 墨西哥
- 南美洲
- 巴西
- 阿根廷
- 其他南美國家
- 歐洲
- 德國
- 英國
- 法國
- 俄羅斯
- 西班牙
- 其他歐洲國家
- 亞太地區
- 中國
- 日本
- 印度
- 韓國
- 東南亞
- 其他亞太國家
- 中東和非洲
- 中東
- 沙烏地阿拉伯
- 阿拉伯聯合大公國
- 其他中東國家
- 非洲
- 南非
- 奈及利亞
- 其他非洲國家
- 中東
- 北美洲
第6章 競爭情勢
- 市場集中度
- 策略趨勢
- 市佔率分析
- 公司簡介
- Microsoft Corporation
- Alphabet Inc.
- Amazon Web Services, Inc.
- International Business Machines Corporation
- NVIDIA Corporation
- Apple Inc.
- Oracle Corporation
- Salesforce, Inc.
- ServiceNow, Inc.
- SAP SE
- OpenAI, LLC
- Anthropic PBC
- Databricks, Inc.
- Snowflake Inc.
- Palantir Technologies Inc.
- C3.ai, Inc.
- UiPath, Inc.
- DataRobot, Inc.
- Hugging Face, Inc.
- Mistral AI SAS
- Cohere Inc.
- SambaNova Systems, Inc.
- Cerebras Systems, Inc.
- H2O.ai, Inc.
第7章 市場機會與未來展望
According to Mordor Intelligence, the AI operating system market size is projected to expand from USD 9.17 billion in 2025 and USD 11.02 billion in 2026 to USD 33.13 billion by 2031, registering a CAGR of 24.63% between 2026 and 2031.
This report is Segmented by Model Integration Approach (On-Device AI Operating System, Cloud-Native AI Operating System, and Hybrid AI Operating System), Platform (Mobile, Desktop and Laptop, Embedded and Edge, and More), End User (IT and Telecommunication, BFSI, Automotive and Transportation, Healthcare and Life Sciences, and More), and Geography. The Market Forecasts are Provided in Terms of Value (USD).
Global AI Operating System Market Trends and Insights
Enterprise Demand for Governed AI Orchestration
The AI Operating System Market is benefiting from demand for systems that authorize, record, and review each model action. Organizations need these capabilities when AI tools interact with customer data, business records, or regulated workflows. Microsoft made Azure AI Foundry Agent Service generally available in June 2026 with sandboxed compute, identity features, governance tools, and observability across 20 Azure regions. This release shows that enterprise buyers now expect controls to be available at the production stage rather than added later. The EU AI Act also introduces transparency, risk management, and documentation requirements that encourage organizations to select platforms with built-in governance. Large organizations in finance, healthcare, and public administration are therefore more likely to standardize their AI tools, while smaller firms may continue to use lighter automation products.
Proliferation of AI Accelerators and NPU-Enabled Devices
The growing supply of specialized processors is widening the technical base for the AI Operating System Market. Faster accelerators make it more practical to run reasoning, memory, and agent workloads at scale. NVIDIA reported fiscal 2026 data center revenue of USD 193.7 billion, up 68% year over year, and stated that Blackwell Ultra can lower the cost of agentic workloads by up to 35 times compared with Hopper. The company also presented Vera Rubin as a platform designed for agentic workloads, with a cost per inference token up to 10 times lower than Blackwell's. These gains can support larger deployments, although the strongest benefits are likely to reach major cloud providers and well-funded enterprises first. The installed base of AI-capable hardware in mobile devices, PCs, vehicles, and industrial equipment also provides software providers with more deployment options for local intelligence.
High Compute, Memory, and Energy Costs
Compute, memory, and power needs remain a major constraint on the AI Operating System Market. Production agent workloads require more resources than simple inference requests because they may involve persistent memory, multi-step reasoning, and multiple coordinated agents. This burden can be difficult for mid-sized organizations that lack the volume discounts available to large cloud customers. Higher energy demand also affects data center planning and can delay capacity additions in regions with constrained grids. NVIDIA's reported improvement in cost per inference token points to a path toward lower operating costs. However, these gains do not immediately remove the financial barrier for organizations that must buy capacity at market rates.
Other drivers and restraints analyzed in the detailed report include:
- Expansion of On-Device and Edge AI Processing
- Growth of Autonomous Agents and Goal-Oriented Interfaces
- Data Privacy, Security, and Regulatory Compliance Burden
For complete list of drivers and restraints, kindly check the Table Of Contents.
Segment Analysis
Hybrid platforms accounted for 42.31% share of the AI operating system market size in 2025. They allow organizations to process sensitive requests locally while maintaining access to cloud models for more demanding tasks. This balance matters to financial services, healthcare, government, and other buyers that need data residency controls. Microsoft Foundry provides hosted agents with sandboxed compute and connections to Azure model endpoints, demonstrating how a cloud provider supports this design. The approach can reduce the need to choose between stronger model capability and tighter handling of sensitive information. It also gives technology teams a practical way to assign workloads by risk, latency, data location, and the availability of local compute resources. This flexibility can simplify internal approval processes when different business units operate under distinct data-handling rules.
On-device platforms are projected to grow at a CAGR of 27.84% from 2026 to 2031. Apple previewed next-generation Apple Intelligence and Siri AI across iOS 27, macOS 27, iPadOS 27, watchOS 27, and visionOS 27 in June 2026. Local processing supports privacy and can improve response times where an internet connection is unreliable. Cloud-native platforms remain necessary for tasks that require very large context windows or rapid model changes. Across the three approaches, customers are placing more value on model version control, performance monitoring, rollback options, and audit records. These functions are moving into platform offerings rather than remaining as separate management tools. Buyers can use a common control structure to compare model versions, review changes, and respond when a model produces unsuitable results. This is important when teams use several models and must maintain consistent records across their applications.
Complete Report Scope:
- By Model Integration Approach
- On-Device AI Operating System
- Cloud-Native AI Operating System
- Hybrid AI Operating System
- By Platform
- Mobile
- Desktop and Laptop
- Embedded and Edge
- Other Platforms
- By End User
- IT and Telecommunication
- BFSI
- Automotive and Transportation
- Healthcare and Life Sciences
- Retail and E-Commerce
- Industrial Manufacturing
- Education and Research Institutions
- Government and Administration
- Energy and Utilities
- Other End Users
- By Geography
- North America
- United States
- Canada
- Mexico
- South America
- Brazil
- Argentina
- Rest of South America
- Europe
- Germany
- United Kingdom
- France
- Russia
- Spain
- Rest of Europe
- Asia-Pacific
- China
- Japan
- India
- South Korea
- Southeast Asia
- Rest of Asia-Pacific
- Middle East and Africa
- Middle East
- Saudi Arabia
- United Arab Emirates
- Rest of Middle East
- Africa
- South Africa
- Nigeria
- Rest of Africa
- Middle East
- North America
Geography Analysis
North America accounted for 36.42% of total revenue in 2025. The United States has a high concentration of cloud providers, model developers, and enterprise platform companies. The NIST AI Risk Management Framework provides buyers with a recognized framework for evaluating governance and risk controls. This can favor providers that include risk management and documentation from the start. Canada adds to its research and technology activities through its clusters in Toronto, Montreal, and Vancouver. Mexico is seeing increased use in manufacturing and logistics as embedded automation becomes more practical.
Asia-Pacific is projected to grow at a CAGR of 28.73% through 2031. China is expanding AI applications through public policy and domestic technology ecosystems, while Japan and South Korea bring automotive, robotics, consumer electronics, and semiconductor capabilities. India and Southeast Asia offer mobile-first demand, growing digital infrastructure, and expanding enterprise cloud use. The regional opportunity extends beyond consumer devices because industrial control, vehicle systems, and enterprise software are also adopting local AI capabilities. The AI Operating System Market has varied regional demand, with each country emphasizing different device types, domestic suppliers, and deployment models.
Europe is the third-largest region, with Germany, the United Kingdom, and France leading adoption in industrial, financial, and public-sector applications. The EU AI Act creates compliance work for high-risk uses and supports demand for platforms with audit, transparency, and risk management features. South America is at an earlier stage, with activity concentrated in financial services and digital government. Infrastructure constraints and a limited talent pool can slow broader adoption there. Saudi Arabia and the UAE are active investment centers within the Middle East and Africa. NVIDIA stated that DRIVE Hyperion supports level 4-ready robotaxi deployments and is being pursued with HUMAIN in the Middle East.
- Microsoft Corporation
- Alphabet Inc.
- Amazon Web Services, Inc.
- International Business Machines Corporation
- NVIDIA Corporation
- Apple Inc.
- Oracle Corporation
- Salesforce, Inc.
- ServiceNow, Inc.
- SAP SE
- OpenAI, L.L.C.
- Anthropic PBC
- Databricks, Inc.
- Snowflake Inc.
- Palantir Technologies Inc.
- C3.ai, Inc.
- UiPath, Inc.
- DataRobot, Inc.
- Hugging Face, Inc.
- Mistral AI SAS
- Cohere Inc.
- SambaNova Systems, Inc.
- Cerebras Systems, Inc.
- H2O.ai, Inc.
Additional Benefits:
- The market estimate (ME) sheet in Excel format
- 3 months of analyst support
TABLE OF CONTENTS
1 INTRODUCTION
- 1.1 Study Assumptions and Market Definition
- 1.2 Scope of the Study
2 RESEARCH METHODOLOGY
3 EXECUTIVE SUMMARY
4 MARKET LANDSCAPE
- 4.1 Market Overview
- 4.2 Market Drivers
- 4.2.1 Enterprise Demand for Governed AI Orchestration
- 4.2.2 Proliferation of AI Accelerators and NPU-Enabled Devices
- 4.2.3 Expansion of On-Device and Edge AI Processing
- 4.2.4 Growth of Autonomous Agents and Goal-Oriented Interfaces
- 4.2.5 Increasing Requirements for Model Lifecycle Management and Auditability
- 4.2.6 Agent-Ready Operating Layers for Legacy System Modernization
- 4.3 Market Restraints
- 4.3.1 High Compute, Memory, and Energy Costs
- 4.3.2 Data Privacy, Security, and Regulatory Compliance Burden
- 4.3.3 Hardware Fragmentation and Interoperability Gaps
- 4.3.4 Integration Complexity Across Legacy Enterprise Systems
- 4.4 Impact of Macroeconomic Factors on the Market
- 4.5 Industry Value-Chain Analysis
- 4.6 Technology Outlook
- 4.7 Regulatory Landscape
- 4.8 Porter's Five Forces Analysis
- 4.8.1 Threat of New Entrants
- 4.8.2 Bargaining Power of Suppliers
- 4.8.3 Bargaining Power of Buyers
- 4.8.4 Threat of Substitutes
- 4.8.5 Intensity of Competitive Rivalry
5 MARKET SIZE AND GROWTH FORECASTS (VALUE)
- 5.1 By Model Integration Approach
- 5.1.1 On-Device AI Operating System
- 5.1.2 Cloud-Native AI Operating System
- 5.1.3 Hybrid AI Operating System
- 5.2 By Platform
- 5.2.1 Mobile
- 5.2.2 Desktop and Laptop
- 5.2.3 Embedded and Edge
- 5.2.4 Other Platforms
- 5.3 By End User
- 5.3.1 IT and Telecommunication
- 5.3.2 BFSI
- 5.3.3 Automotive and Transportation
- 5.3.4 Healthcare and Life Sciences
- 5.3.5 Retail and E-Commerce
- 5.3.6 Industrial Manufacturing
- 5.3.7 Education and Research Institutions
- 5.3.8 Government and Administration
- 5.3.9 Energy and Utilities
- 5.3.10 Other End Users
- 5.4 By Geography
- 5.4.1 North America
- 5.4.1.1 United States
- 5.4.1.2 Canada
- 5.4.1.3 Mexico
- 5.4.2 South America
- 5.4.2.1 Brazil
- 5.4.2.2 Argentina
- 5.4.2.3 Rest of South America
- 5.4.3 Europe
- 5.4.3.1 Germany
- 5.4.3.2 United Kingdom
- 5.4.3.3 France
- 5.4.3.4 Russia
- 5.4.3.5 Spain
- 5.4.3.6 Rest of Europe
- 5.4.4 Asia-Pacific
- 5.4.4.1 China
- 5.4.4.2 Japan
- 5.4.4.3 India
- 5.4.4.4 South Korea
- 5.4.4.5 Southeast Asia
- 5.4.4.6 Rest of Asia-Pacific
- 5.4.5 Middle East and Africa
- 5.4.5.1 Middle East
- 5.4.5.1.1 Saudi Arabia
- 5.4.5.1.2 United Arab Emirates
- 5.4.5.1.3 Rest of Middle East
- 5.4.5.2 Africa
- 5.4.5.2.1 South Africa
- 5.4.5.2.2 Nigeria
- 5.4.5.2.3 Rest of Africa
- 5.4.5.1 Middle East
- 5.4.1 North America
6 COMPETITIVE LANDSCAPE
- 6.1 Market Concentration
- 6.2 Strategic Moves
- 6.3 Market Share Analysis
- 6.4 Company Profiles (includes Global Level Overview, Market Level Overview, Core Segments, Financials as available, Strategic Information, Market Rank/Share, Products and Services, Recent Developments)
- 6.4.1 Microsoft Corporation
- 6.4.2 Alphabet Inc.
- 6.4.3 Amazon Web Services, Inc.
- 6.4.4 International Business Machines Corporation
- 6.4.5 NVIDIA Corporation
- 6.4.6 Apple Inc.
- 6.4.7 Oracle Corporation
- 6.4.8 Salesforce, Inc.
- 6.4.9 ServiceNow, Inc.
- 6.4.10 SAP SE
- 6.4.11 OpenAI, L.L.C.
- 6.4.12 Anthropic PBC
- 6.4.13 Databricks, Inc.
- 6.4.14 Snowflake Inc.
- 6.4.15 Palantir Technologies Inc.
- 6.4.16 C3.ai, Inc.
- 6.4.17 UiPath, Inc.
- 6.4.18 DataRobot, Inc.
- 6.4.19 Hugging Face, Inc.
- 6.4.20 Mistral AI SAS
- 6.4.21 Cohere Inc.
- 6.4.22 SambaNova Systems, Inc.
- 6.4.23 Cerebras Systems, Inc.
- 6.4.24 H2O.ai, Inc.
7 MARKET OPPORTUNITIES AND FUTURE OUTLOOK
- 7.1 White-Space and Unmet-Need Assessment

 免費遊戲市場:全球市場預測,2026-2032年
 軟體引進:市佔率分析、產業趨勢與統計及成長預測(2026-2031 年)
 多模態人工智慧基礎設施市場預測至2034年-按基礎設施類型、模態類型、部署模式、最終用戶和地區分類的全球分析聯邦式人工智慧管治市場預測至2034年—按組件、部署類型、組織規模、管治架構、最終用戶和地區分類的全球分析
 2026年全球大型主機作業系統市場報告2026年Macintosh(Mac)客戶關係管理(CRM)軟體全球市場報告2026年全球Java Web框架軟體市場報告
 聯邦式人工智慧系統市場分析與預測(至2035年):類型、產品類型、服務、技術、組件、應用、部署模式、最終用戶2026年Macintosh(Mac)作業系統(OS)全球市場報告2026年全球汽車數位化服務市場報告