


 |
市場調查報告書
商品編碼
2118031
OTT聚合商:市場佔有率分析、產業趨勢與統計、成長預測(2026-2031年)OTT Aggregator - Market Share Analysis, Industry Trends & Statistics, Growth Forecasts (2026 - 2031) |
||||||

※ 本網頁內容可能與最新版本有所差異。詳細情況請與我們聯繫。
到 2025 年,整合內容聚合器佔 OTT 聚合器市場規模的 43.12%,而白牌OTT 聚合平台預計到 2031 年將以 14.84% 的複合年成長率成長。
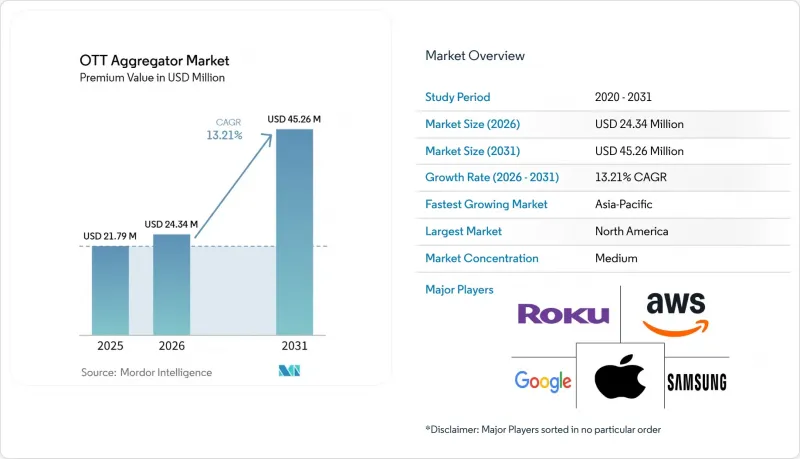
根據Mordor Intelligence預測,市場規模將從2026年的2,434萬美元成長至2031年的4,526萬美元,2026年至2031年的複合年成長率(CAGR)為13.21%。本報告按服務類型(多串流聚合器、整合內容聚合器、白牌OTT聚合平台等)、收入模式(訂閱式(SVOD)、廣告支援式(AVOD)、交易式(TVOD)等)、裝置類型(智慧型手機和平板電腦、智慧型電視、筆記型電腦和桌上型電腦等)以及地區進行細分。市場預測以美元(USD)計價。
全球OTT聚合市場趨勢及洞察
訂閱疲勞正在加速聚合平台的普及。
隨著每個家庭需要透過各自的應用程式和支付週期來管理越來越多的獨立串流服務,OTT聚合市場正從中受益。隨著訂閱數量的激增,觀眾越來越傾向於使用單一網路基地台,以減少內容發現和帳戶管理的麻煩。這意味著聚合不僅僅是一項便利功能;它還可以幫助消費者簡化持續服務的選擇,同時確保他們能夠獲得所需的內容。由於能夠消除複雜性的平台可以影響搜尋行為、支付流程和推薦內容的可見性,中間商的角色也得到了加強。因此,OTT(Over-The-Top)聚合市場正受益於一種回饋循環:觀看選擇越分散,整合存取就越具吸引力。這種動態正在推動聚合商向串流媒體分發鏈的核心靠攏。
統一計費和跨應用程式搜尋可降低解約率。
統一計費將徹底改變家庭用戶管理訂閱的方式,只需一個帳戶即可輕鬆查看、續訂和使用多個串流媒體服務,從而減少所需工作量。跨應用程式搜尋帶來另一個優勢:使用者只需搜尋一次即可找到所需內容,無需在多個應用程式間重複相同的操作。這減少了內容發現過程中的摩擦,這在OTT聚合市場至關重要,因為用戶不滿往往會導致參與度下降和用戶流失加速。此外,用戶始終可以在同一介面查看訂閱詳情,並更輕鬆地跨計費週期進行管理,進一步提升了這一優勢。歐盟委員會就即將訂定的「數位公平法」進行的諮詢表明,用戶流失的透明度和訂閱的清晰度正日益成為數位服務整體的重要政策議題。隨著這些期望的日益明確,能夠將更簡化的收費系統與更清晰的訂閱管理工具結合的平台有望在OTT聚合市場中佔據主導地位。
平台費用糾紛可能會延遲內容上線。
由於OTT聚合市場依賴配銷商和內容服務商之間的合作,商業性糾紛會直接阻礙平台發展。圍繞訂閱收入分成和內容上線條款的衝突往往會導致內容上線延遲和整合模式的削弱。這損害了聚合的核心價值,因為使用者期望在一個介面內獲得豐富的內容庫和無縫的收費體驗。如果關鍵服務被排除在套餐之外,用戶仍被迫單獨管理部分觀看內容,從而導致平台留存率下降。如果新的聚合商試圖快速擴張,但無法與加值內容合作夥伴達成可接受的經濟條款,OTT聚合市場尤其容易受到此問題的影響。隨著時間的推移,重複的內容上線延遲會導致用戶遷移到那些已經擁有強大議價能力和廣泛服務網路的大規模生態系統。
細分市場分析
整合內容聚合器的興起源自於消費者服務的成熟,這些服務將收費、搜尋和建議整合到一個高度直覺的介面中。在OTT聚合器市場,這種模式非常適合那些尋求直接前端體驗而非後台基礎架構的使用者。此外,由於平台品牌在帳戶管理和內容發現的整個過程中都清晰可見,因此也有助於提升消費者的品牌認知。多串流聚合器仍然十分重要,因為它們可以快速部署,並且通常專注於連結、搜尋和觀看清單功能,而無需承擔全部收費責任。
白牌平台正蓬勃發展,因為電信和廣播公司往往更傾向於以自有品牌來維護客戶關係。 Tata Play Binge 的白牌服務就充分展現了這一點,他們在 4-6 個月內,在客戶品牌化的介面中部署了 30 多個 OTT 應用程式。這種方式使區域服務供應商能夠更快地進入 OTT 聚合市場,而無需完全建立自己的技術堆疊。企業影片管理平台仍然是小規模市場,但它們滿足了教育和企業環境中的管理用例,在這些環境中,管治和基於許可的存取比大規模發現更為重要。因此,OTT 聚合市場的服務組合正在不斷擴展,消費者聚合和 B2B 基礎設施都在同步成長。
區域分析
到2025年,北美將佔據OTT聚合市場36.19%的佔有率,成為全球最大的聚合服務區域市場。該地區受益於強大的串流生態系統、高需求端普及率以及消費者普遍擁有多個數位訂閱服務。 2025年6月,亞馬遜廣告和Roku宣佈建立合作夥伴關係,計劃透過亞馬遜的需求方平台(DSP)連接約8,000萬個已認證的聯網電視家庭(占美國聯網電視家庭總數的80%以上)。此舉表明,北美OTT聚合市場正在從訂閱服務擴展到更廣泛的廣告和受眾匹配領域。加拿大和墨西哥則採取了不同的發展路徑,加拿大傾向於捆綁式IPTV經營模式,而墨西哥則專注於以價值主導的套餐服務。
預計到2031年,亞太地區將以17.42%的複合年成長率成長,成為OTT聚合商成長最快的區域市場。根據AVIA預測,到2030年,亞太地區與螢幕相關的收入預計將達到1960億美元,所有淨成長均來自在線影片,預計在線影片的複合年成長率將達到7%。印度是競爭最激烈的市場,Jio Platforms和Bharti Airtel利用其龐大的行動和寬頻基本客群,大規模地推動捆綁式內容豐富化和價格優惠。這使得營運商在OTT聚合商市場擁有強大的結構性優勢,因為他們可以將串流媒體和網路服務整合到單一的消費者套餐中。韓國和日本也在推動該地區的成長勢頭,因為它們強大的本地串流生態系統提升了跨服務發現和導航的價值。
歐洲仍然是OTT(Over-The-Top)聚合商的重要市場,但同時也是一個嚴格監管的地區。德國電信的「MagentaTV」預計將在2026年初擁有超過350萬用戶,它透過一個由營運商主導的單一介面整合了Netflix、Disney+、Apple TV+和DAZN等平台。 2026年2月,德國電信與ProsiBensat.1達成一項新的五年合作協議,進一步拓展了這一模式,將ProsiBensat.1的內容Joyn和Joyn PLUS+添加到MagentaTV的內容庫中,並擴大了雙方在可尋址電視廣告(ATV)領域的合作。歐盟委員會的「數位綜合提案」透過簡化部分數據法規並加強與基於人工智慧的用戶畫像和跨服務受眾管理相關的義務,進一步提升了這一趨勢的重要性。南美洲、中東和非洲仍然是 OTT 聚合商的成長市場,但由於購買力較低、經營模式普及率不均衡以及對「行動優先」和「成本績效」服務的強烈偏好,這些地區的商業模式比北美或西歐的商業模式對價格更加敏感。
其他好處:
- Excel格式的市場預測(ME)表
- 3個月的分析師支持
目錄
第1章:引言
- 研究假設和市場定義
- 調查範圍
第2章:調查方法
第3章執行摘要
第4章 市場狀況
- 市場概覽
- 宏觀經濟因素對市場的影響
- 市場促進因素
- 訂閱疲勞正在加速聚合平台的普及。
- 透過整合收費和跨應用程式搜尋降低客戶流失率。
- 智慧電視的主螢幕正逐漸成為預設的內容發現層。
- 將電信業者與寬頻服務捆綁在一起可以降低客戶獲取成本。
- 元資料規範化使得跨平台建議引擎成為可能。
- 基於廣告的聚合正在將其覆蓋範圍擴展到高階受眾之外。
- 市場限制因素
- 平台費用糾紛可能會導致內容發布延遲。
- 權利和使用權的分散限制了目錄的全面性。
- 由於隱私限制,跨服務瀏覽資料的貨幣化受到限制。
- 在價格敏感且配套服務支出較低的市場中,停掉有線電視服務的勢頭正在放緩。
- 產業價值鏈分析
- 監理情勢
- 技術展望
- 波特五力分析
第5章 市場規模與成長預測
- 按服務類型
- 多串流聚合器
- 整合內容聚合器
- 白牌OTT聚合平台
- 企業影片管理平台
- 按收入模式
- 訂閱式(SVOD)
- 廣告支持型(AVOD)
- 交易型(TVOD)
- 混合模式(訂閱+廣告)
- 依設備類型
- 智慧型手機和平板電腦
- 智慧電視
- 筆記型電腦和桌上型電腦
- 其他設備類型
- 按地區
- 北美洲
- 美國
- 加拿大
- 墨西哥
- 南美洲
- 巴西
- 阿根廷
- 智利
- 其他南美國家
- 歐洲
- 德國
- 英國
- 法國
- 義大利
- 西班牙
- 其他歐洲國家
- 亞太地區
- 中國
- 日本
- 印度
- 韓國
- 澳洲
- 其他亞太國家
- 中東
- 沙烏地阿拉伯
- 阿拉伯聯合大公國
- 卡達
- 其他中東國家
- 非洲
- 南非
- 埃及
- 奈及利亞
- 其他非洲國家
- 北美洲
第6章 競爭情勢
- 市場集中度
- 策略趨勢
- Vendor Positioning Analysis
- 公司簡介
- Roku, Inc.
- Amazon.com, Inc.
- Alphabet Inc.
- Apple Inc.
- Comcast Corporation
- Paramount, a Skydance Corporation
- Samsung Electronics Co., Ltd.
- LG Electronics Inc.
- Tata Play Limited
- Bharti Airtel Limited
- Jio Platforms Limited
- JustWatch GmbH
- Plex, Inc.
- Reelgood, Inc.
- Deutsche Telekom AG
- Orange SA
- Charter Communications, Inc.
- Verizon Communications, Inc.
- Zattoo AG
- Xperi Inc.
第7章 市場機會與未來展望
Unified content aggregators held 43.12% share of the OTT aggregator market size in 2025, while white-label OTT aggregation platforms are projected to expand at a 14.84% CAGR through 2031.
According to Mordor Intelligence, uSD 24.34 million in 2026 to USD 45.26 million by 2031, registering a CAGR of 13.21% between 2026 and 2031. This report is Segmented by Service Type (Multi-Streaming Aggregators, Unified Content Aggregators, White-Label OTT Aggregation Platforms, and More), Revenue Model (Subscription-Based (SVOD), Advertising-Based (AVOD), Transaction-Based (TVOD), and More), Device Type (Smartphones and Tablets, Smart TVs, Laptops and Desktops, and More), and Geography. The Market Forecasts are Provided in Terms of Value (USD).
Global OTT Aggregator Market Trends and Insights
Subscription Fatigue is Accelerating Aggregator Adoption
The OTT aggregator market is benefiting from the steady rise in the number of standalone streaming services that households must manage across separate apps and payment cycles. As subscription stacks become more crowded, viewers are increasingly interested in a single access point that reduces friction in discovery and account management. This makes aggregation more than a convenience feature, as it helps consumers keep their desired content while simplifying ongoing service choices. It also strengthens the role of the intermediary, since platforms that remove complexity can gain influence over search behavior, payment flows, and recommendation visibility. The over-the-top (OTT) aggregator market, therefore, benefits from a feedback loop in which more fragmented viewing choices increase the appeal of unified access. That dynamic is helping aggregators move closer to the center of the streaming distribution chain.
Unified Billing and Cross-App Search Reduce Churn
Unified billing changes the way households manage subscriptions by reducing the effort required to review, renew, and use multiple streaming services under a single account. Cross-app search adds another advantage; users can search for a title once instead of repeating the same task across several apps. This reduces discovery friction, which is important in the OTT aggregator market because user frustration often leads to lower engagement and faster cancellation. The benefit becomes stronger when the same interface also keeps subscription details visible and easier to manage across billing cycles. The European Commission's consultation on a forthcoming Digital Fairness Act showed that cancellation transparency and subscription clarity are becoming more important policy themes across digital services. As these expectations become more formal, the OTT aggregator market is likely to favor platforms that can combine simpler billing with clearer subscription management tools.
Platform Fee Disputes Can Delay Content Onboarding
The OTT aggregator market relies on cooperation between distributors and content services, so commercial disputes can directly slow platform growth. When subscription revenue shares or placement terms become contentious, the result is often a delay in onboarding or a weaker integration model. That weakens the core value of aggregation, because viewers expect a broad catalog and a smooth billing experience within a single interface. If a major service remains outside the bundle, users must still manage part of their viewing separately, which reduces platform stickiness. The OTT aggregator market is especially exposed to this issue when new aggregation layers try to scale quickly but cannot secure acceptable economics with premium content partners. Over time, repeated onboarding delays can push users toward larger ecosystems that already have stronger negotiating power and deeper service coverage.
Other drivers and restraints analyzed in the detailed report include:
- Smart TV Home Screens are Becoming the Default Discovery Layer
- Telco and Broadband Bundles Lower Customer Acquisition Costs
- Rights and Entitlement Fragmentation Limits Catalog Depth
For complete list of drivers and restraints, kindly check the Table Of Contents.
Segment Analysis
The larger position of unified content aggregators reflects the maturity of consumer-facing services that bring billing, search, and recommendations into one visible interface. In the OTT aggregator market, that model fits users who want a direct front-end experience rather than a background infrastructure layer. It also supports stronger consumer recognition because the platform brand stays in front of viewers throughout account management and discovery. Multi-streaming aggregators still matter because they can be deployed quickly and often focus on links, search, and watchlist functions without taking on full billing responsibility.
White-label platforms are gaining speed because telecom operators and broadcasters often prefer to keep the customer relationship under their own brand. Tata Play Binge's white-label offer showed this appeal by promoting the deployment of 30+ OTT apps within a client-branded interface in 4 to 6 months. That approach gives regional service providers a faster entry point into the OTT aggregator market without requiring them to build a full proprietary stack. Enterprise video management platforms remain a smaller segment, but they address controlled use cases in education and corporate environments where governance and licensed access matter more than mass discovery. The service mix in the OTT aggregator market is therefore broadening, with consumer aggregation and B2B infrastructure scaling at the same time.
Complete Report Scope:
- By Service Type
- Multi-Streaming Aggregators
- Unified Content Aggregators
- White-label OTT Aggregation Platforms
- Enterprise Video Management Platforms
- By Revenue Model
- Subscription-Based (SVOD)
- Advertising-Based (AVOD)
- Transaction-Based (TVOD)
- Hybrid (Subscription + Advertising)
- By Device Type
- Smartphones and Tablets
- Smart TVs
- Laptops and Desktops
- Other Device Types
- By Geography
- North America
- United States
- Canada
- Mexico
- South America
- Brazil
- Argentina
- Chile
- Rest of South America
- Europe
- Germany
- United Kingdom
- France
- Italy
- Spain
- Rest of Europe
- Asia-Pacific
- China
- Japan
- India
- South Korea
- Australia
- Rest of Asia-Pacific
- Middle East
- Saudi Arabia
- United Arab Emirates
- Qatar
- Rest of Middle East
- Africa
- South Africa
- Egypt
- Nigeria
- Rest of Africa
- North America
Geography Analysis
North America accounted for 36.19% of the OTT aggregator market in 2025, making it the largest regional base for aggregation services. The region benefits from a dense streaming ecosystem, high broadband penetration, and consumers who already manage multiple digital subscriptions. In June 2025, Amazon Ads and Roku announced a partnership that combined an estimated 80 million authenticated connected TV households, representing over 80% of all US connected TV households, via Amazon's demand-side platform. That move showed how the OTT aggregator market in North America is expanding beyond subscription access into a broader advertising and audience-matching layer. Canada and Mexico are following different paths, with Canada closer to bundled IPTV economics and Mexico more focused on value-led packaging.
Asia-Pacific is projected to expand at a 17.42% CAGR through 2031, making it the fastest-growing regional market for OTT aggregators. AVIA reported that Asia-Pacific screen revenues are expected to reach USD 196 billion by 2030, with all net growth coming from online video that is projected to expand at a 7% CAGR. India has become the clearest battleground because Jio Platforms and Bharti Airtel are using mobile and broadband relationships to push bundle depth and price access at scale. That creates a strong structural advantage in the OTT aggregator market, as telecom operators can combine streaming access with network services into a single consumer offer. South Korea and Japan also support the region's momentum because dense local streaming ecosystems increase the value of better cross-service discovery and navigation.
Europe remains a significant but regulation-heavy part of the over-the-top (OTT) aggregator market, and Deutsche Telekom's MagentaTV passed 3.5 million subscribers in early 2026, aggregating Netflix, Disney+, Apple TV+, and DAZN through a single operator-led interface. Deutsche Telekom and ProSiebenSat. 1 expanded that model further in February 2026 through a new five-year cooperation that added ProSiebenSat. 1 content, Joyn, and Joyn PLUS+ to the MagentaTV catalog and extended addressable TV advertising collaboration. The European Commission's Digital Omnibus proposal added another layer of relevance by simplifying some data rules while tightening obligations tied to AI-based profiling and cross-service audience handling. South America, the Middle East, and Africa remain growth markets for OTT aggregators, but lower purchasing power, uneven broadband coverage, and stronger preference for mobile-first or value-oriented offers make regional models more price-sensitive than those in North America and Western Europe.
- Roku, Inc.
- Amazon.com, Inc.
- Alphabet Inc.
- Apple Inc.
- Comcast Corporation
- Paramount, a Skydance Corporation
- Samsung Electronics Co., Ltd.
- LG Electronics Inc.
- Tata Play Limited
- Bharti Airtel Limited
- Jio Platforms Limited
- JustWatch GmbH
- Plex, Inc.
- Reelgood, Inc.
- Deutsche Telekom AG
- Orange S.A.
- Charter Communications, Inc.
- Verizon Communications, Inc.
- Zattoo AG
- Xperi Inc.
Additional Benefits:
- The market estimate (ME) sheet in Excel format
- 3 months of analyst support
TABLE OF CONTENTS
1 INTRODUCTION
- 1.1 Study Assumptions and Market Definition
- 1.2 Scope of the Study
2 RESEARCH METHODOLOGY
3 EXECUTIVE SUMMARY
4 MARKET LANDSCAPE
- 4.1 Market Overview
- 4.2 Impact of Macroeconomic Factors on the Market
- 4.3 Market Drivers
- 4.3.1 Subscription Fatigue Is Accelerating Aggregator Adoption
- 4.3.2 Unified Billing and Cross-App Search Reduce Churn
- 4.3.3 Smart TV Home Screens Are Becoming the Default Discovery Layer
- 4.3.4 Telco and Broadband Bundles Lower Customer Acquisition Costs
- 4.3.5 Metadata Normalization Makes Cross-Platform Recommendation Engines Viable
- 4.3.6 Ad-Supported Aggregation Expands Reach Beyond Premium Viewers
- 4.4 Market Restraints
- 4.4.1 Platform Fee Disputes Can Delay Content Onboarding
- 4.4.2 Rights and Entitlement Fragmentation Limits Catalog Depth
- 4.4.3 Privacy Constraints Restrict Cross-Service Viewing Data Monetization
- 4.4.4 Cord-Cutting Slows in Price-Sensitive Markets With Low Bundle Spend
- 4.5 Industry Value Chain Analysis
- 4.6 Regulatory Landscape
- 4.7 Technological Outlook
- 4.8 Porter's Five Forces Analysis
- 4.8.1 Threat of New Entrants
- 4.8.2 Bargaining Power of Buyers
- 4.8.3 Bargaining Power of Suppliers
- 4.8.4 Threat of Substitutes
- 4.8.5 Intensity of Competitive Rivalry
5 MARKET SIZE AND GROWTH FORECASTS (VALUE)
- 5.1 By Service Type
- 5.1.1 Multi-Streaming Aggregators
- 5.1.2 Unified Content Aggregators
- 5.1.3 White-label OTT Aggregation Platforms
- 5.1.4 Enterprise Video Management Platforms
- 5.2 By Revenue Model
- 5.2.1 Subscription-Based (SVOD)
- 5.2.2 Advertising-Based (AVOD)
- 5.2.3 Transaction-Based (TVOD)
- 5.2.4 Hybrid (Subscription + Advertising)
- 5.3 By Device Type
- 5.3.1 Smartphones and Tablets
- 5.3.2 Smart TVs
- 5.3.3 Laptops and Desktops
- 5.3.4 Other Device Types
- 5.4 By Geography
- 5.4.1 North America
- 5.4.1.1 United States
- 5.4.1.2 Canada
- 5.4.1.3 Mexico
- 5.4.2 South America
- 5.4.2.1 Brazil
- 5.4.2.2 Argentina
- 5.4.2.3 Chile
- 5.4.2.4 Rest of South America
- 5.4.3 Europe
- 5.4.3.1 Germany
- 5.4.3.2 United Kingdom
- 5.4.3.3 France
- 5.4.3.4 Italy
- 5.4.3.5 Spain
- 5.4.3.6 Rest of Europe
- 5.4.4 Asia-Pacific
- 5.4.4.1 China
- 5.4.4.2 Japan
- 5.4.4.3 India
- 5.4.4.4 South Korea
- 5.4.4.5 Australia
- 5.4.4.6 Rest of Asia-Pacific
- 5.4.5 Middle East
- 5.4.5.1 Saudi Arabia
- 5.4.5.2 United Arab Emirates
- 5.4.5.3 Qatar
- 5.4.5.4 Rest of Middle East
- 5.4.6 Africa
- 5.4.6.1 South Africa
- 5.4.6.2 Egypt
- 5.4.6.3 Nigeria
- 5.4.6.4 Rest of Africa
- 5.4.1 North America
6 COMPETITIVE LANDSCAPE
- 6.1 Market Concentration
- 6.2 Strategic Moves
- 6.3 Vendor Positioning Analysis
- 6.4 Company Profiles (includes Global Level Overview, Market Level Overview, Core Segments, Financials as available, Strategic Information, Market Rank/Share, Products and Services, Recent Developments)
- 6.4.1 Roku, Inc.
- 6.4.2 Amazon.com, Inc.
- 6.4.3 Alphabet Inc.
- 6.4.4 Apple Inc.
- 6.4.5 Comcast Corporation
- 6.4.6 Paramount, a Skydance Corporation
- 6.4.7 Samsung Electronics Co., Ltd.
- 6.4.8 LG Electronics Inc.
- 6.4.9 Tata Play Limited
- 6.4.10 Bharti Airtel Limited
- 6.4.11 Jio Platforms Limited
- 6.4.12 JustWatch GmbH
- 6.4.13 Plex, Inc.
- 6.4.14 Reelgood, Inc.
- 6.4.15 Deutsche Telekom AG
- 6.4.16 Orange S.A.
- 6.4.17 Charter Communications, Inc.
- 6.4.18 Verizon Communications, Inc.
- 6.4.19 Zattoo AG
- 6.4.20 Xperi Inc.
7 MARKET OPPORTUNITIES AND FUTURE OUTLOOK
- 7.1 White-Space and Unmet-Need Assessment

