


 |
市場調查報告書
商品編碼
2117584
元宇宙串流:市場佔有率分析、產業趨勢與統計、成長預測(2026-2031)Metaverse Streaming - Market Share Analysis, Industry Trends & Statistics, Growth Forecasts (2026 - 2031) |
||||||

※ 本網頁內容可能與最新版本有所差異。詳細情況請與我們聯繫。
根據 Mordor Intelligence 預測,元宇宙串流媒體市場規模將從 2025 年的 64.9 億美元和 2026 年的 76.9 億美元成長到 2031 年的 193 億美元,2026 年至 2031 年的年複合成長率(CAGR)為 20.2%。
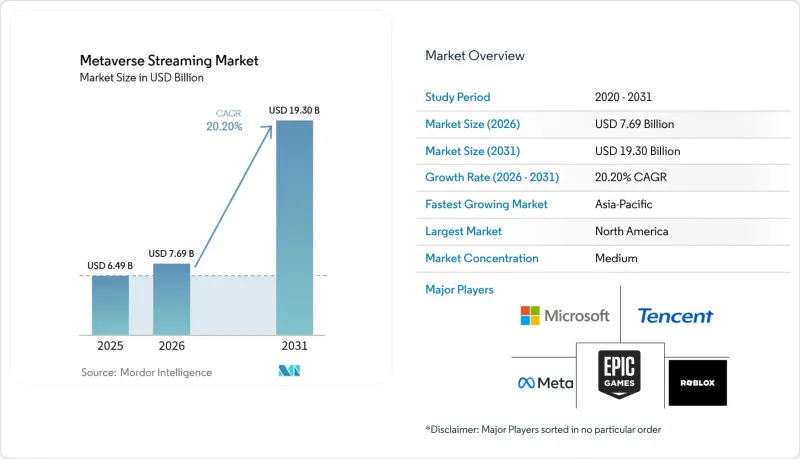
本報告按串流格式(直播、點播等)、內容類型(音樂和現場演出、體育賽事、品牌體驗和廣告等)、收入模式(廣告、訂閱、按次付費和門票銷售、元宇宙商務和數位商品等)以及地區進行細分。市場預測以美元計價。
全球元宇宙媒體市場趨勢與洞察
低延遲雲端串流媒體和XR設備整合
硬體分離正在改變元宇宙串流媒體市場的成本結構。這是因為高階渲染處理不再需要在使用者裝置上執行,從而降低了高品質身臨其境型體驗的硬體進入門檻。在2026年GTC大會上,NVIDIA發布了CloudXR 6.0,它採用基於OpenXR的通用運行時,能夠透過標準的5GHz Wi-Fi以90幀/秒的速度傳輸等效4K的空間內容,幀間延遲僅為20至30毫秒。動態注視點流透過將低解析度影像傳送到視野邊緣,並將高解析度影像傳送到焦點,從而降低了資料使用量。這提高了多用戶會話的經濟性,使元宇宙串流媒體市場能夠大規模地支持更豐富的世界。憑藉對visionOS 26.4的原生支持,該模式已擴展到Apple Vision Pro,擴大了身臨其境型平台的目標高階硬體範圍。這對企業部署和消費者訂閱都有重大意義。這種轉變可能會將成本負擔從消費者硬體購買轉移到平台營運成本,從而有可能提高串流媒體原生服務的轉換率,並為元宇宙串流媒體市場的規模化提供更清晰的路徑。
人們對虛擬世界中的互動式實況活動的需求日益成長。
虛擬世界中的互動實況活動正超越被動式廣播。這是因為平台收入越來越依賴會話時長、重複訪問和交易活動,而不僅僅是總觀看人數。 DAZN 和 Immersiv.io 在 Meta Quest 平台上為 2025 年 FIFA 俱樂部世界盃打造了 XR 體驗,讓球迷能夠以即時 3D 形式觀看全部 63 場比賽。在賽事的後半程,平台還提供了互動統計數據、戰術疊加以及 180° 和 360° 回放功能。隨後,Fox Sports、Cosm 和國際足總將這一概念擴展到「共享現實」場館,用於 2026 年 FIFA 世界盃的轉播,利用現場空間製作工作流程,在美國主要城市的穹頂場館中提供沉浸式觀賽體驗。付費共享現實觀賽正在成為一種獨特的收入來源,介於線性串流媒體和體育場館現場觀賽之間,在元宇宙串流媒體市場開闢了傳統數位影片無法完全覆蓋的價格區間。隨著元宇宙串流媒體市場的成熟,將身臨其境型內容要求納入更廣泛的媒體談判的版權所有擁有者將能夠更好地實現盈利。
高延遲敏感性和頻寬限制
網路效能仍是元宇宙媒體市場大規模普及的主要技術瓶頸。這是因為當反應時間和頻寬低於感知閾值時,身臨其境型體驗會迅速受到影響。 IEEE COMCOMAP 2025 年的一項研究發現,在多用戶元宇宙負載下,5G 上行鏈路延遲在 6.41 到 14.75 毫秒之間,仍然高於觸覺體驗和其他高響應元宇宙所需的 5 毫秒以下延遲水平。 Zenodo 於 2025 年發布的另一份評估報告也指出,目前架構無法滿足高密度元宇宙部署所需的「端對端延遲低於 20 毫秒」和「每用戶最高 1 Gbps頻寬」的要求,凸顯了元宇宙媒體市場基礎設施的巨大差距。當網路品質達不到用戶預期時,用戶參與度會迅速下降,平台將面臨比一般影片串流更難以承受的用戶流失趨勢。雖然邊緣運算和未來的 6G 部署可能會隨著時間的推移緩解這種限制,但它們的時間表與短期內容和平台投資週期並不完全一致。
細分市場分析
到2025年,直播將佔據元宇宙媒體市場40.26%的佔有率,繼續超越其他分發形式,並證實即時參與仍然是身臨其境型觀看體驗最強大的基礎。其主導地位源自於用戶對同步體驗(例如音樂會、電競決賽、粉絲見面會和品牌活動)日益成長的喜愛——這些體驗一旦共用時刻結束,吸引力就會大打折扣。這種「限時價值」促使用戶在活動上的支出高於常規重播,增強了活動的社交吸引力,並維持了直播時段在元宇宙媒體市場的商業性價值。 2026年1月, 頻譜和蘋果公司宣布,部分洛杉磯湖人隊的比賽將透過Apple Vision Pro上的「Spectrum Front Row」進行直播。這表明,即時空間體育賽事串流媒體正在消費級硬體上日益普及,並已超越實驗性應用階段。
點播串流媒體持續發揮至關重要的作用,因為重播、創作者庫和培訓內容延長了內容的生命週期,並拓寬了其在元宇宙串流媒體市場的效用。混合串流媒體預計到2031年將以20.81%的複合年成長率成長,成為元宇宙串流媒體市場中成長最快的格式。這表明平台希望在單一環境中提供多種會話形式。服務提供者正在將持久的社交層融入預定的活動中,使用戶能夠在主直播之前、期間和之後繼續留在共用空間。這可以延長用戶參與度,並帶來更多交易和提升銷售的機會。這種機制降低了客戶流失率,因為即使在主直播結束後,用戶與平台的關係也不會中斷,並且為運營商提供了更多在同一用戶旅程中平衡訂閱、廣告、門票銷售和商業活動的選擇。
區域分析
在2025年的元宇宙媒體市場中,北美保持了其最大區域市場的地位,佔據31.24%的市場佔有率。這反映了核心平台、基礎設施供應商和優質版權擁有者在美國的集中度。該地區受益於一個緊密聯繫的生態系統,該系統連接了設備製造商、雲端服務提供商、身臨其境型軟體開發商、體育媒體和企業買家,使其商業化速度比大多數其他地區更快。美國也在運動領域主導引人注目的實驗,例如在2026年1月洛杉磯湖人隊的一場比賽中部署「Spectrum」和「Apple Vision Pro」。這顯示身臨其境型直播觀看正在轉變為一個廣受認可的主流消費管道。加拿大和墨西哥的市場規模仍然小規模,但這兩個國家都受益於技術的漣漪效應、跨境內容的影響以及活躍的雙語人口,這些因素可以支持本地化應用。歐洲是第二大重要地區,GDPR(一般資料保護規則)和數位服務法案為身臨其境型內容的資料處理、可靠性和審核制定了標準。雖然這會增加合規成本,但也會提升公司的信譽。
預計到2031年,亞太地區將以20.56%的複合年成長率成長,成為元宇宙媒體市場成長最快的區域市場,並為全球市場前景提供更廣泛的第二大成長引擎。中國憑藉其整合的遊戲和社交生態系統、龐大的本土平台規模以及支持身臨其境型內容傳輸的XR硬體的普及,成為該地區最大的收入來源。韓國憑藉其高密度的5G基礎設施、電子競技文化以及與音樂和娛樂相關的粉絲平台,正在創造強勁的需求,進一步鞏固身臨其境型實況活動的商業性管道。日本透過企業對VR的投資來支持成長,而印度則憑藉其「行動優先」的5G部署以及大規模的年輕用戶群體(他們無需即時依賴頭戴式設備即可訪問輕量級的雲端串流媒體XR服務)來擴大用戶群體。這種組合在亞太地區的眾多領域產生了需求,包括遊戲、粉絲互動、企業廣播和行動社交觀看,從而降低了元宇宙媒體市場對特定、狹窄用例的依賴。
儘管中東和非洲目前的收入規模相對較小,但這兩個地區對未來的元宇宙媒體市場具有重要的戰略意義,因為公共數位專案和年輕的數位用戶群能夠支撐其長期應用。沙烏地阿拉伯和阿拉伯聯合大公國正在投資元宇宙基礎設施,作為其更廣泛的數位經濟多元化策略的一部分,從而在該地區建立制度支持,促進企業和活動主導應用。在非洲,特別是南非、奈及利亞和埃及,頻寬限制最為嚴重,阻礙了高品質沉浸式內容的傳輸,網路效能方面的障礙也比已開發市場更大。在以巴西為首的南美洲,可以利用基於瀏覽器的XR串流模式,減少對頭戴裝置的依賴,使元宇宙串流媒體市場能夠更早觸及行動優先用戶,而無需等待硬體的全面普及。
其他好處:
- Excel格式的市場預測(ME)表
- 3個月的分析師支持
目錄
第1章:引言
- 研究假設和市場定義
- 調查範圍
第2章:調查方法
第3章執行摘要
第4章 市場狀況
- 市場概覽
- 市場促進因素
- 人們對虛擬世界中的互動式實況活動的需求日益成長。
- 拓展身臨其境型平台上的創作者變現管道
- 虛擬世界中空間商業的擴張和品牌贊助的增加。
- 低延遲雲端串流媒體和XR設備整合
- 虛擬教育、培訓與企業廣播的發展
- 社交觀看和共同觀看的需求日益成長。
- 市場限制因素
- 高延遲敏感性和頻寬限制
- 平台標準碎片化和互通性差距
- 使用者生成環境中的內容審核、安全性和品牌風險
- 核心玩家群以外的獲利率較低。
- 宏觀經濟因素對市場的影響
- 產業價值鏈分析
- 監理情勢
- 技術展望
- 波特五力分析
第5章 市場規模與成長預測
- 透過串流媒體格式
- 直播
- 點播串流媒體
- 混合串流媒體
- 按內容類型
- 音樂和現場表演
- 運動的
- 教育和培訓
- 品牌體驗、品牌活動、廣告
- 社交和社區活動
- 其他內容類型
- 按收入模式
- 廣告收入
- 訂閱制
- 按次付費觀看和門票銷售
- 世界內商業和數位商品
- 贊助和品牌推廣
- 按地區
- 北美洲
- 美國
- 加拿大
- 墨西哥
- 歐洲
- 德國
- 英國
- 法國
- 俄羅斯
- 其他歐洲國家
- 亞太地區
- 中國
- 日本
- 印度
- 韓國
- 澳洲
- 其他亞太國家
- 中東
- 沙烏地阿拉伯
- 阿拉伯聯合大公國
- 土耳其
- 其他中東國家
- 非洲
- 南非
- 埃及
- 奈及利亞
- 其他非洲國家
- 南美洲
- 巴西
- 阿根廷
- 其他南美國家
- 北美洲
第6章 競爭情勢
- 市場集中度
- 策略趨勢
- 市佔率分析
- 公司簡介
- Meta Platforms, Inc.
- Roblox Corporation
- Epic Games, Inc.
- Microsoft Corporation
- NVIDIA Corporation
- Alphabet Inc.
- Tencent Holdings Limited
- Sony Group Corporation
- ByteDance Ltd.
- Unity Software Inc.
- Amazon.com, Inc.
- Apple Inc.
- Zoom Video Communications, Inc.
- Kaltura, Inc.
- Brightcove Inc.
- Akamai Technologies, Inc.
- Vimeo, Inc.
- Twitch Interactive, Inc.
- BytePlus Pte. Ltd.
- The Sandbox
第7章 市場機會與未來展望
According to Mordor Intelligence, the metaverse streaming market size is projected to expand from USD 6.49 billion in 2025 and USD 7.69 billion in 2026 to USD 19.30 billion by 2031, registering a CAGR of 20.2% between 2026 to 2031.
This report is Segmented by Streaming Format (Live Streaming, On-Demand Streaming, and More), Content Type (Music and Live Performances, Sports, Branded Experiences and Advertising, and More), Revenue Model (Advertising Supported, Subscription Based, Pay Per View and Ticketing, In-World Commerce and Digital Goods, and More), and Geography. The Market Forecasts are Provided in Terms of Value (USD).
Global Metaverse Streaming Market Trends and Insights
Integration of Low-Latency Cloud Streaming With XR Devices
Hardware decoupling is changing the cost profile of the metaverse streaming market because high-end rendering no longer needs to sit on the user device, which lowers the hardware barrier for premium immersive experiences. NVIDIA introduced CloudXR 6.0 at GTC 2026 with a universal OpenXR-based runtime that can stream 4K-equivalent spatial content at 90 FPS over standard 5 GHz Wi-Fi with pose-to-frame received latency in the 20 ms to 30 ms range. Dynamic foveated streaming reduces data use by sending lower resolution imagery at the edge of the field of view and full detail at the focal point, which improves the economics of multi-user sessions and helps the metaverse streaming market support richer worlds at scale. Native visionOS 26.4 support extends this model to Apple Vision Pro and broadens the premium hardware base that immersive platforms can target, which matters for both enterprise deployments and consumer subscriptions. This shift moves more cost from consumer hardware purchases to platform operating spend, which can raise conversion for streaming-native services and give the metaverse streaming market a clearer path to scale.
Rising Demand for Interactive Live Events Inside Virtual Worlds
Interactive live events in virtual worlds are moving away from passive broadcast because platform revenue depends more on session length, repeat visits, and transaction activity than on headline audience size alone. DAZN and Immersiv.io delivered an XR experience for the FIFA Club World Cup 2025 on Meta Quest, giving fans access to all 63 matches in real-time 3D with interactive stats, tactical overlays, and 180° and 360° replay features during the later rounds of the tournament. Fox Sports, Cosm, and FIFA then extended that logic into shared-reality venues for FIFA World Cup 2026 coverage, using live spatial production workflows to bring immersive match viewing to dome environments in major U.S. cities. Ticketed shared-reality attendance is emerging as its own revenue layer between linear streaming and stadium attendance, which gives the metaverse streaming market a pricing tier that traditional digital video did not fully capture. Rights holders that lock immersive terms into broader media negotiations are likely to improve monetization leverage as the metaverse streaming market matures.
High Latency Sensitivity and Bandwidth Constraints
Network performance is still the main technical limit on mass adoption in the metaverse streaming market because immersive sessions break down quickly when response times and bandwidth fall below perception thresholds. A 2025 IEEE COMCOMAP study found 5G uplink latencies of 6.41 ms to 14.75 ms under multi-user metaverse load, which remained above the sub-5 ms level needed for haptic-enabled experiences and other highly responsive formats. A separate 2025 assessment on Zenodo found that current architectures do not meet the sub-20-ms end-to-end latency and up to 1 Gbps per-user bandwidth needs of dense metaverse deployments, which highlights a wide infrastructure gap for the metaverse streaming market. When network quality drops below user expectations, engagement can collapse quickly, and platforms face churn dynamics that are harder to absorb than in standard video streaming. Edge computing and future 6G deployment may reduce this constraint over time, but those timelines do not fully match near-term content and platform investment cycles.
Other drivers and restraints analyzed in the detailed report include:
- Expansion of Creator Monetization in Immersive Platforms
- Growth of Virtual Education, Training, and Enterprise Broadcasting
- Fragmented Platform Standards and Interoperability Gaps
For complete list of drivers and restraints, kindly check the Table Of Contents.
Segment Analysis
Live Streaming held 40.26% of the metaverse streaming market share in 2025, which kept it ahead of the other delivery formats and confirmed that real-time participation remains the strongest anchor for immersive viewing. It led because users place a higher value on synchronous experiences such as concerts, esports finals, fan meetups, and branded activations that lose a large part of their appeal once the shared moment passes. That time-sensitive value supports higher event spending and stronger social pull than standard replay viewing, which keeps live inventory commercially attractive in the metaverse streaming market. Spectrum and Apple announced in January 2026 that select Los Angeles Lakers games would stream live through Spectrum Front Row on Apple Vision Pro, which showed that live spatial sports is reaching mainstream consumer hardware and moving beyond test use cases.
On-Demand Streaming still holds an important role because replay viewing, creator libraries, and training content support longer shelf life and broaden utility across the metaverse streaming market. Hybrid Streaming is forecast to grow at a 20.81% CAGR through 2031, making it the fastest-expanding format in the metaverse streaming market and showing that platforms want more than one session type inside a single environment. Providers are attaching persistent social layers to scheduled events so users remain in shared spaces before, during, and after the main broadcast, which raises visit length and opens more chances for transactions and upselling. This structure can reduce churn because the platform relationship does not end when the headline stream ends, and it gives operators more ways to balance subscriptions, ads, ticketing, and commerce inside the same user journey.
Complete Report Scope:
- By Streaming Format
- Live Streaming
- On-Demand Streaming
- Hybrid Streaming
- By Content Type
- Music and Live Performances
- Sports
- Education and Training
- Branded Experiences, Brand Events and Advertising
- Social and Community Events
- Other Content Type
- By Revenue Model
- Advertising Supported
- Subscription Based
- Pay Per View and Ticketing
- In-World Commerce and Digital Goods
- Sponsorship and Brand Activation
- By Geography
- North America
- United States
- Canada
- Mexico
- Europe
- Germany
- United Kingdom
- France
- Russia
- Rest of Europe
- Asia-Pacific
- China
- Japan
- India
- South Korea
- Australia
- Rest of Asia-Pacific
- Middle East
- Saudi Arabia
- United Arab Emirates
- Turkey
- Rest of Middle East
- Africa
- South Africa
- Egypt
- Nigeria
- Rest of Africa
- South America
- Brazil
- Argentina
- Rest of South America
- North America
Geography Analysis
North America accounted for 31.24% share of the metaverse streaming market size in 2025, which kept it as the largest regional base and reflected the concentration of core platforms, infrastructure vendors, and premium rights holders in the United States. The region benefits from a dense ecosystem that links device makers, cloud providers, immersive software developers, sports media, and enterprise buyers in a way that supports faster commercialization than most other regions. The U.S. also leads visible sports experimentation, including the Spectrum and Apple Vision Pro rollout for Los Angeles Lakers games in January 2026, which signaled that immersive live viewing is moving into recognizable mainstream consumer channels. Canada and Mexico remain smaller markets, but both benefit from technology spillover, cross-border content influence, and digitally active bilingual audiences that can support localized adoption. Europe is a material secondary region where GDPR and the Digital Services Act are shaping data handling, trust, and moderation standards for immersive content, which raises compliance costs but can also strengthen enterprise confidence.
Asia-Pacific is projected to advance at a 20.56% CAGR through 2031, making it the fastest-growing regional segment in the metaverse streaming market and giving the global outlook a broad second engine of expansion. China contributes the largest revenue base in the region through integrated gaming and social ecosystems, domestic platform scale, and XR hardware deployment that supports immersive content distribution. South Korea adds strong demand through dense 5G infrastructure, esports culture, and fan platforms tied to music and entertainment, which gives immersive live events a stronger commercial path. Japan supports growth through enterprise VR investment, and India widens the user base through mobile-first 5G rollout and a large young audience that can access lightweight cloud-streamed XR services without immediate headset dependence. This mix gives Asia-Pacific demand across gaming, fan engagement, enterprise broadcasting, and mobile social viewing, which makes the metaverse streaming market less reliant on one narrow use case.
The Middle East and Africa remain smaller in current revenue terms, but both regions have strategic importance for the future metaverse streaming market because public digital programs and younger digital populations can support longer-term adoption. Saudi Arabia and the UAE are investing in metaverse infrastructure as part of broader digital economy diversification efforts, which gives the region an institutional push that can support enterprise and event-led deployments. Africa faces the sharpest bandwidth limits, especially in South Africa, Nigeria, and Egypt, which slows high-quality immersive delivery and keeps network performance as a larger barrier than in more developed markets. South America, led by Brazil, can benefit from browser-based XR streaming models that reduce headset dependence and help the metaverse streaming market reach mobile-first users sooner than full hardware adoption would allow.
- Meta Platforms, Inc.
- Roblox Corporation
- Epic Games, Inc.
- Microsoft Corporation
- NVIDIA Corporation
- Alphabet Inc.
- Tencent Holdings Limited
- Sony Group Corporation
- ByteDance Ltd.
- Unity Software Inc.
- Amazon.com, Inc.
- Apple Inc.
- Zoom Video Communications, Inc.
- Kaltura, Inc.
- Brightcove Inc.
- Akamai Technologies, Inc.
- Vimeo, Inc.
- Twitch Interactive, Inc.
- BytePlus Pte. Ltd.
- The Sandbox
Additional Benefits:
- The market estimate (ME) sheet in Excel format
- 3 months of analyst support
TABLE OF CONTENTS
1 INTRODUCTION
- 1.1 Study Assumptions and Market Definition
- 1.2 Scope of the Study
2 RESEARCH METHODOLOGY
3 EXECUTIVE SUMMARY
4 MARKET LANDSCAPE
- 4.1 Market Overview
- 4.2 Market Drivers
- 4.2.1 Rising Demand for Interactive Live Events Inside Virtual Worlds
- 4.2.2 Expansion of Creator Monetization in Immersive Platforms
- 4.2.3 Rising Use of Spatial Commerce and Branded In-World Sponsorships
- 4.2.4 Integration of Low-Latency Cloud Streaming With XR Devices
- 4.2.5 Growth of Virtual Education, Training, and Enterprise Broadcasting
- 4.2.6 Rising Demand for Persistent Social Viewing and Co-Watching
- 4.3 Market Restraints
- 4.3.1 High Latency Sensitivity and Bandwidth Constraints
- 4.3.2 Fragmented Platform Standards and Interoperability Gaps
- 4.3.3 Content Moderation, Safety, and Brand Risk in User-Generated Worlds
- 4.3.4 Weak Monetization Conversion Outside Core Gaming Audiences
- 4.4 Impact of Macroeconomic Factors on the Market
- 4.5 Industry Value Chain Analysis
- 4.6 Regulatory Landscape
- 4.7 Technological Outlook
- 4.8 Porter's Five Forces Analysis
- 4.8.1 Threat of New Entrants
- 4.8.2 Bargaining Power of Suppliers
- 4.8.3 Bargaining Power of Buyers
- 4.8.4 Threat of Substitutes
- 4.8.5 Competitive Rivalry
5 MARKET SIZE AND GROWTH FORECASTS (VALUE)
- 5.1 By Streaming Format
- 5.1.1 Live Streaming
- 5.1.2 On-Demand Streaming
- 5.1.3 Hybrid Streaming
- 5.2 By Content Type
- 5.2.1 Music and Live Performances
- 5.2.2 Sports
- 5.2.3 Education and Training
- 5.2.4 Branded Experiences, Brand Events and Advertising
- 5.2.5 Social and Community Events
- 5.2.6 Other Content Type
- 5.3 By Revenue Model
- 5.3.1 Advertising Supported
- 5.3.2 Subscription Based
- 5.3.3 Pay Per View and Ticketing
- 5.3.4 In-World Commerce and Digital Goods
- 5.3.5 Sponsorship and Brand Activation
- 5.4 By Geography
- 5.4.1 North America
- 5.4.1.1 United States
- 5.4.1.2 Canada
- 5.4.1.3 Mexico
- 5.4.2 Europe
- 5.4.2.1 Germany
- 5.4.2.2 United Kingdom
- 5.4.2.3 France
- 5.4.2.4 Russia
- 5.4.2.5 Rest of Europe
- 5.4.3 Asia-Pacific
- 5.4.3.1 China
- 5.4.3.2 Japan
- 5.4.3.3 India
- 5.4.3.4 South Korea
- 5.4.3.5 Australia
- 5.4.3.6 Rest of Asia-Pacific
- 5.4.4 Middle East
- 5.4.4.1 Saudi Arabia
- 5.4.4.2 United Arab Emirates
- 5.4.4.3 Turkey
- 5.4.4.4 Rest of Middle East
- 5.4.5 Africa
- 5.4.5.1 South Africa
- 5.4.5.2 Egypt
- 5.4.5.3 Nigeria
- 5.4.5.4 Rest of Africa
- 5.4.6 South America
- 5.4.6.1 Brazil
- 5.4.6.2 Argentina
- 5.4.6.3 Rest of South America
- 5.4.1 North America
6 COMPETITIVE LANDSCAPE
- 6.1 Market Concentration
- 6.2 Strategic Moves
- 6.3 Market Share Analysis
- 6.4 Company Profiles (includes Global Level Overview, Market Level Overview, Core Segments, Financials as available, Strategic Information, Market Rank/Share, Products and Services, Recent Developments)
- 6.4.1 Meta Platforms, Inc.
- 6.4.2 Roblox Corporation
- 6.4.3 Epic Games, Inc.
- 6.4.4 Microsoft Corporation
- 6.4.5 NVIDIA Corporation
- 6.4.6 Alphabet Inc.
- 6.4.7 Tencent Holdings Limited
- 6.4.8 Sony Group Corporation
- 6.4.9 ByteDance Ltd.
- 6.4.10 Unity Software Inc.
- 6.4.11 Amazon.com, Inc.
- 6.4.12 Apple Inc.
- 6.4.13 Zoom Video Communications, Inc.
- 6.4.14 Kaltura, Inc.
- 6.4.15 Brightcove Inc.
- 6.4.16 Akamai Technologies, Inc.
- 6.4.17 Vimeo, Inc.
- 6.4.18 Twitch Interactive, Inc.
- 6.4.19 BytePlus Pte. Ltd.
- 6.4.20 The Sandbox
7 MARKET OPPORTUNITIES AND FUTURE OUTLOOK
- 7.1 White-Space and Unmet-Need Assessment

 元宇宙全球市場規模、佔有率、趨勢和成長分析報告(2026-2034年)
 遊戲元元宇宙市場:2026-2032年全球市場預測元宇宙市場:全球市場預測(2026-2032)時尚領域的元宇宙市場:2026-2032年全球市場預測
 元宇宙房地產市場規模、佔有率和成長分析:按資產類型、平台架構框架、最終用戶角色、平台組件層和地區分類-2026-2033年產業預測
 元宇宙市場:依產品、平台、技術、應用、最終用途、國家及地區分類-全球產業分析、市場規模、市場佔有率及2026年至2033年預測
 全球元宇宙娛樂市場:依產品、科技、娛樂類型和地區分類-預測至2032年
 零售業元宇宙市場-全球產業規模、佔有率、趨勢、機會與預測:按產品、平台、技術、最終用途、地區和競爭格局分類,2021-2031年
 2026-2030年全球元宇宙市場元宇宙遊戲全球市場規模、佔有率、趨勢和成長分析報告(2026-2034)