


 |
市場調查報告書
商品編碼
2117307
藍氫:市場佔有率分析、產業趨勢與統計、成長預測(2026-2031)Blue Hydrogen - Market Share Analysis, Industry Trends & Statistics, Growth Forecasts (2026 - 2031) |
||||||

※ 本網頁內容可能與最新版本有所差異。詳細情況請與我們聯繫。
據 Mordor Intelligence 稱,預計 2026 年藍氫市場規模為 81 萬噸,在預測期(2026-2031 年)內將以 57.64% 的複合年成長率成長,到 2031 年將達到 789 萬噸。
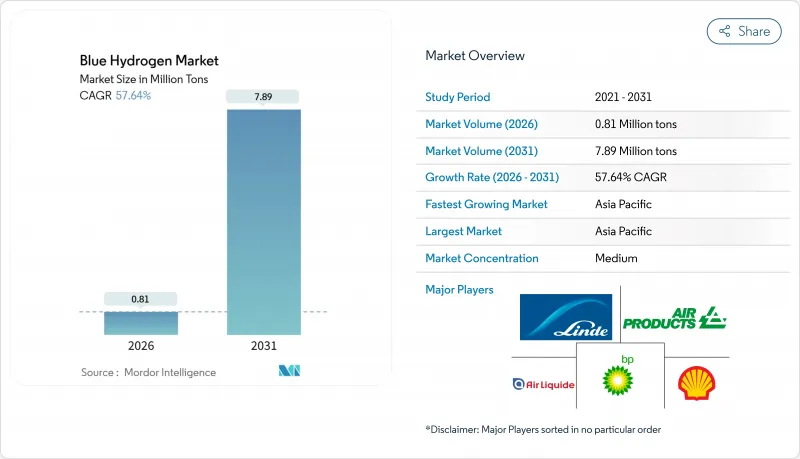
本報告按技術(蒸汽甲烷重整+碳捕集與封存、自發性熱重組+碳捕集與封存、氣體部分氧化法+碳捕集與封存、天然氣熱解及其他)、終端用戶行業(煉油、化工、鋼鐵、交通運輸及其他)和地區(亞太、北美、歐洲、南美、中東和非洲)進行細分。市場預測以噸為單位。
全球藍氫市場趨勢與洞察
燃料電池電動車(FCEV)的使用量迅速成長
在重型卡車領域,這項技術正超越試點階段。尼古拉公司在2025年上半年交付了72輛8級燃料電池卡車,現代汽車承諾到2027年在加州和瑞士部署共1600輛「XCIENT」車輛。憑藉加州低碳燃料標準(LCFS)的積分,藍氫可實現90%的二氧化碳捕集率,從而擁有極具競爭力的總擁有成本(TCO),早期車隊營運商已簽署多年供應合約。航運業對這項技術的興趣也日益濃厚,馬士基和道達爾能源公司在鹿特丹完成了燃料庫測試,併計劃於2028年在航線上進行商業部署。這些採用者優先考慮即時滿足排放法規的要求,無需等待可再生能源的充足供應,這正推動藍氫市場在交通運輸領域迎來轉折點。
亞洲藍色氨回程傳輸走廊的擴建
2024年,沙烏地阿美向JERA交付了首批40噸藍氨,證明了以氨形式進行長距離氫氣運輸的商業性可行性。韓國浦項鋼鐵公司於2025年撥款12億美元用於建造一座裂解裝置,目標是在2028年實現20萬噸氫氣的年產量。中東生產商以每公斤1.20美元的價格供應藍氫,然後在東北亞地區以每公斤近2.50美元的價格出售,比國內綠氫供應價格高出40%。這條運輸路線使日本和韓國能夠在可再生能源用地資源有限的情況下實現其2030年的氫能目標,並為藍氫市場建立了一條長期的貿易通道。
與灰氫相比,生產成本更高。
儘管未享有補貼的藍氫價格為每公斤1.80至2.50美元,但在天然氣資源豐富的地區,灰氫的價格僅為每公斤1.00至1.30美元,兩者價格相差高達40%至90%。當歐盟碳價超過每噸80歐元時,這一價格差異會縮小至10%至20%,但亞洲買家仍對價格較為敏感。小型甲烷重整-碳捕集與封存(SMR-CCS)的資本投資是傳統SMR的兩倍,每公斤年產能需額外投資2.50至3美元,主要是因為回收設備的成本較高。由於小規模工業用戶無法攤銷這些成本,因此初期應用僅限於煉油廠、氨廠和鋼鐵廠,減緩了藍氫市場滲透的速度。
細分市場分析
即使到2025年,採用碳捕集與封存(CCS)技術的蒸汽甲烷重整預計仍將維持61.62%的市佔率。這是因為煉油廠可以透過維修現有重整設備,以比新建設自熱重整(ATR)製程低40-50%的資本成本實施該技術。氣體部分氧化法仍僅限於需要高CO₂熱值的石化工廠,而天然氣熱解仍處於實用化前期階段。林德公司計劃在德克薩斯州建設的混合式蒸汽甲烷重整-自熱重整(SMR-ATR)裝置提供了一種兼顧回收效率和成本的切實可行的中間解決方案。目前,採用碳捕集與封存(CCS)技術的自熱重整(ATR)製程正以62.25%的複合年成長率成長,預計將成為成長最快的製造流程。 ATR結合了氧氣吹掃部分氧化法和高壓重整,實現了95-98%的CO₂回收率,並透過產生近乎純淨的CO₂流,顯著降低了溶劑再生所需的能量。空氣產品公司計劃在路易斯安那州建造一座價值 70 億美元的綜合設施,該設施將利用 ATR 技術每年生產 75 萬噸氫氣並封存 500 萬噸二氧化碳,目標是根據《通膨控制法案》(IRA) 獲得第四級積分。
計畫的經濟可行性越來越依賴補貼機制。在預期碳權額度獲取量最大的地區,ATR(大型加氫反應器)佔據主導地位;但在那些更重視與現有設施整合優勢的地區,SMR(小型模組化反應器)維修正逐漸成為主流。技術授權公司之間的競爭日益激烈。 Topsaw公司憑藉其模組化的SynCOR裝置,已獲得2025年的8個ATR訂單,該裝置可將建設時間縮短30%。同時,莊信萬豐公司憑藉其LCH(液氫化物)技術也獲得了3個訂單,這凸顯了正在重塑藍氫市場的技術的整合趨勢。
區域分析
預計到2025年,亞太地區將佔藍氫市場38.24%的佔有率,複合年成長率高達59.42%,是各區域中成長最快的。中國將於2025年在內蒙古和陝西省運作三座氫氣設施(總合為每年18萬噸氫氣),同時每年也將封存120萬噸二氧化碳。在韓國,首個商業化裂解終端預計將於2026年投入運作,釜山和光陽將成為區域進口樞紐。日本更新後的氫能戰略目標是到2030年每年進口300萬噸氫氣,其中60%將來自藍氨,並利用現有的LNG接收站進行卸載。印度正在馬圖拉進行藍氫試點運營,但要等到全國範圍內的碳定價機制訂定後才能在2028年後擴大規模。除了每公斤1.20至1.50美元的具有競爭力的交付成本外,亞太地區豐富的適宜碳捕獲與封存(CCS)地點也支撐了其成本競爭力,即使由於認證延遲導致出口到歐洲RFNBO市場受到限制。
在北美,大部分區域產能都集中在美國,並透過利用IRA 45V碳權額度來保障。埃克森美孚的貝城計畫和空氣產品公司的路易斯安那項目合計將在2028年前新增150萬噸年產能。在加拿大,埃德蒙頓地區擁有四座運作的設施,並計劃透過「路徑聯盟」(Pathways Alliance)利用成熟的海水含水層儲能技術,在2030年前將產能提高三倍。墨西哥的參與目前仍處於試點階段。 45V碳權額度在2032年後的日落條款帶來了長期的政策風險,可能導致40%至50%的未獲批准專案失敗。因此,補貼的永續性是關鍵因素。
歐洲的情況喜憂參半。可再生能源指令(RFNBO)保障了需求,但天然氣價格飆升和甲烷認證的延遲正在減緩新計畫的最終投資決策(FID)。德國30億歐元的基金目前僅支持林德集團的萊納計畫和尤尼珀集團的威廉港計畫。英國的HyNet和東海岸叢集每年根據每公斤1.50英鎊的差價交易協議供應8萬噸氫氣,但要更廣泛地推廣,需要明確二氧化碳儲存的責任。法國和義大利專注於綠色氫氣,而將藍氫留給煉油廠維修。中東、非洲和南美洲的出口尚處於起步階段。沙烏地阿美公司的賈夫拉計畫計畫在2025年擴建,屆時將年產150萬噸藍色氨,而巴西石油公司正在巴西開發一個碳二氧化碳捕集(CCS)儲存試驗計畫。這兩個項目都瞄準了東北亞的高階市場需求。
其他好處
- Excel格式的市場預測(ME)表
- 3個月的分析師支持
目錄
第1章:引言
- 研究假設和市場定義
- 調查範圍
第2章:調查方法
第3章執行摘要
第4章 市場狀況
- 市場概覽
- 市場促進因素
- 燃料電池電動車(FCEV)的使用量迅速成長
- 亞洲藍色氨回程傳輸走廊的擴建
- 化工原料(氨、甲醇)需求增加
- 透過IRA 45V和歐盟RFNBO的獎勵降低平準化發電成本。
- CCS中心快速發展可降低迴收成本。
- 市場限制因素
- 與灰氫相比,生產成本更高。
- 能源強度和效率降低
- 甲烷外洩測量和認證面臨的挑戰
- 價值鏈分析
- 波特五力模型
第5章 市場規模與成長預測
- 透過技術
- 蒸汽甲烷重整(SMR)+碳捕集與封存(CCS)
- 自發性熱重組(ATR)+碳捕獲與封存
- 部分氧化法(GPOX)+ CCS
- 天然氣熱解(NGD)
- 整合式SMR-ATR混合
- 按最終用戶行業分類
- 純化
- 化學品
- 鋼
- 運輸
- 其他行業(水泥、玻璃、食品等)
- 按地區
- 亞太地區
- 中國
- 印度
- 日本
- 韓國
- 其他亞太國家
- 北美洲
- 美國
- 加拿大
- 墨西哥
- 歐洲
- 德國
- 英國
- 法國
- 義大利
- 其他歐洲國家
- 南美洲
- 巴西
- 阿根廷
- 其他南美國家
- 中東和非洲
- 沙烏地阿拉伯
- 南非
- 其他中東和非洲國家
- 亞太地區
第6章 競爭情勢
- 市場集中度
- 策略趨勢
- 市佔率和排名分析
- 公司簡介
- Air Liquide
- Air Products and Chemicals, Inc.
- ATCO Ltd.
- BP plc
- CERTIFHY CONSORTIUM.
- Cummins Inc.
- Equinor ASA
- Exxon Mobil Corporation
- Johnson Matthey
- Linde PLC
- Plug Power Inc.
- Reliance Industries Limited
- SABIC
- Saudi Arabian Oil Co.
- Shell plc
- Siemens Energy
- Suncor Energy Inc.
- Technip Energies NV
- Topsoe A/S
- TotalEnergies
- Uniper SE
- Xebec Adsorption Inc.
第7章 市場機會與未來展望
According to Mordor Intelligence, the blue hydrogen market size is estimated at 0.81 Million tons in 2026, and is expected to reach 7.89 Million tons by 2031, at a CAGR of 57.64% during the forecast period (2026-2031).
This report is Segmented by Technology (Steam Methane Reforming + CCS, Autothermal Reforming + CCS, Gas Partial Oxidation + CCS, Natural-Gas Pyrolysis, and More), End-User Industry (Refining, Chemicals, Iron and Steel, Transportation, and Other Industries), and Geography (Asia-Pacific, North America, Europe, South America, and Middle East and Africa). Market Forecasts are Provided in Terms of Volume (tons).
Global Blue Hydrogen Market Trends and Insights
Surging Application in Fuel-Cell Electric Vehicles
Heavy-duty trucking is moving beyond pilots. Nikola delivered 72 Class 8 fuel-cell trucks in 1H 2025, and Hyundai committed to 1,600 XCIENT units across California and Switzerland by 2027. California's Low Carbon Fuel Standard credits give blue hydrogen with 90% capture a competitive total cost of ownership, and early fleet operators lock in multi-year supply contracts. Maritime interest is rising as Maersk and TotalEnergies complete bunkering trials in Rotterdam, aiming for 2028 route commercialization. These adopters value immediate emissions compliance without waiting for renewable overbuild, pushing the blue hydrogen market toward transportation inflection.
Growing Blue-Ammonia Back-Haul Corridors in Asia
A first shipment of 40 tons of blue ammonia from Saudi Aramco to JERA in 2024 proved the commercial case for long-distance hydrogen carriage in ammonia form. South Korea's POSCO earmarked USD 1.2 billion in 2025 for cracking facilities targeting 200,000 tons of hydrogen by 2028. Middle-Eastern producers deliver blue hydrogen at USD 1.20 kg and sell into Northeast Asia near USD 2.50 kg, a 40% price advantage over domestic green supply. The corridor satisfies Japan and South Korea's 2030 hydrogen targets despite renewable-land constraints, embedding long-term trade lanes in the blue hydrogen market.
High Production Cost vs. Grey Hydrogen
Unsubsidized blue hydrogen ranges USD 1.80-2.50 kg versus USD 1.00-1.30 kg for grey in gas-rich regions, sustaining a 40-90% premium. EU carbon prices above EUR 80 t narrow the gap to 10-20%, but Asian buyers remain price-sensitive. SMR-CCS capex of USD 2.5-3.0 kg yr capacity is double conventional SMR, mainly from capture equipment. Small industrial users cannot amortize these costs, limiting early adoption to refineries, ammonia, and steel complexes and slowing penetration of the blue hydrogen market.
Other drivers and restraints analyzed in the detailed report include:
- Rising Demand from Chemical Feedstocks (Ammonia, Methanol)
- IRA 45V and EU RFNBO Incentives Compress Levelized Cost
- Energy-Intensity and Efficiency Losses
For complete list of drivers and restraints, kindly check the Table Of Contents.
Segment Analysis
Steam-methane reforming with CCS retains the bulk 61.62% share in 2025 because refineries can retrofit existing reformers at 40-50% lower capital cost than greenfield ATR. Gas partial oxidation remains confined to petrochemical sites needing high-CO heat, while natural-gas pyrolysis is pre-commercial. Linde's planned hybrid SMR-ATR plant in Texas signals a pragmatic middle ground, balancing capture efficiency and cost. Autothermal reforming with CCS is on track for a 62.25% CAGR, the quickest among production pathways. ATR achieves 95-98% CO2 capture by combining oxygen-blown partial oxidation with high-pressure reforming, producing a near-pure CO2 stream that slashes solvent-regeneration energy. Air Products' USD 7 billion Louisiana complex will use ATR to deliver 750,000 t yr hydrogen and sequester 5 million t CO2, targeting Tier 4 IRA credits.
Project economics increasingly hinge on subsidy structures. Where maximum carbon credits are available, ATR dominates; where brownfield integration advantages count more, SMR retrofits prevail. Technology licensors are locked in a competitive race, Topsoe captured eight ATR awards in 2025 thanks to modular SynCOR units that cut construction time 30%, while Johnson Matthey recorded three for its LCH, underscoring a technology shake-out that will reshape the blue hydrogen market.
Complete Report Scope:
- By Technology
- Steam Methane Reforming (SMR) + CCS
- Autothermal Reforming (ATR) + CCS
- Gas Partial Oxidation (GPOX) + CCS
- Natural-Gas Pyrolysis / NGD
- Integrated SMR-ATR Hybrid
- By End-user Industry
- Refining
- Chemicals
- Iron and Steel
- Transportation
- Other Industries (Cement, Glass, Food, and more)
- Geography
- Asia-Pacific
- China
- India
- Japan
- South Korea
- Rest of Asia-Pacific
- North America
- United States
- Canada
- Mexico
- Europe
- Germany
- United Kingdom
- France
- Italy
- Rest of Europe
- South America
- Brazil
- Argentina
- Rest of South America
- Middle-East and Africa
- Saudi Arabia
- South Africa
- Rest of Middle-East and Africa
- Asia-Pacific
Geography Analysis
Asia-Pacific commanded 38.24% of the 2025 blue hydrogen market and is forecast to grow 59.42% CAGR, the strongest regional pace. China commissioned three Inner Mongolia and Shaanxi facilities totaling 180,000 t yr hydrogen in 2025 and paired them with 1.2 million t yr CO2 sequestration. South Korea's first commercial cracking terminals come online in 2026, positioning Busan and Gwangyang as regional import hubs. Japan's updated hydrogen strategy targets 3 million t yr imports by 2030, 60% from blue ammonia, using legacy LNG terminals for offloading. India pilots blue hydrogen at Mathura but awaits a national carbon price before scaling beyond 2028. Competitive delivered-cost baselines of USD 1.20-1.50 kg, plus ample CCS geology, anchor Asia-Pacific's cost leadership even as certification lags restrict export access to European RFNBO markets.
North America leverages IRA 45V credits to secure most of the regional capacity within the United States. ExxonMobil's Baytown and Air Products' Louisiana projects together add 1.5 million t yr by 2028. Canada's Edmonton region hosts four operating facilities and plans to triple output by 2030 through the Pathways Alliance, capitalizing on proven saline aquifer storage. Mexico's participation is exploratory only. Post-2032 sunset clauses for 45V create long-term policy risk that could strand 40-50% of un-sanctioned plans, making subsidy durability the critical variable.
Europe presents a mixed picture. RFNBO mandates guarantee demand, yet high gas prices and methane-certification delays slow new FIDs. Germany's EUR 3 billion fund backed only Linde's Leuna and Uniper's Wilhelmshaven projects to date. United Kingdom clusters HyNet and East Coast supply 80,000 t yr hydrogen under GBP 1.50 kg contracts-for-difference, but broader uptake hinges on resolving liability for CO2 storage. France and Italy focus on green hydrogen, leaving blue to refinery retrofits. Middle East-Africa and South America are early-stage exporters: Saudi Aramco's Jafurah rises to 1.5 million t yr blue ammonia by 2025, while Petrobras pilots CCS-enabled hydrogen in Brazil, both targeting premium Northeast Asian demand.
- Air Liquide
- Air Products and Chemicals, Inc.
- ATCO Ltd.
- BP p.l.c.
- CERTIFHY CONSORTIUM.
- Cummins Inc.
- Equinor ASA
- Exxon Mobil Corporation
- Johnson Matthey
- Linde PLC
- Plug Power Inc.
- Reliance Industries Limited
- SABIC
- Saudi Arabian Oil Co.
- Shell plc
- Siemens Energy
- Suncor Energy Inc.
- Technip Energies N.V.
- Topsoe A/S
- TotalEnergies
- Uniper SE
- Xebec Adsorption Inc.
Additional Benefits:
- The market estimate (ME) sheet in Excel format
- 3 months of analyst support
TABLE OF CONTENTS
1 Introduction
- 1.1 Study Assumptions & Market Definition
- 1.2 Scope of the Study
2 Research Methodology
3 Executive Summary
4 Market Landscape
- 4.1 Market Overview
- 4.2 Market Drivers
- 4.2.1 Surging application in fuel-cell electric vehicles
- 4.2.2 Growing blue-ammonia back-haul corridors in Asia
- 4.2.3 Rising demand from chemical feedstocks (ammonia, methanol)
- 4.2.4 IRA 45V and EU RFNBO incentives compress levelised cost
- 4.2.5 Rapid CCS hub build-out lowers capture cost
- 4.3 Market Restraints
- 4.3.1 High production cost vs. grey hydrogen
- 4.3.2 Energy-intensity/efficiency losses
- 4.3.3 Methane-slip measurement and certification gaps
- 4.4 Value Chain Analysis
- 4.5 Porter's Five Forces
- 4.5.1 Bargaining Power of Suppliers
- 4.5.2 Bargaining Power of Buyers
- 4.5.3 Threat of New Entrants
- 4.5.4 Threat of Substitutes
- 4.5.5 Degree of Competition
5 Market Size & Growth Forecasts (Volume)
- 5.1 By Technology
- 5.1.1 Steam Methane Reforming (SMR) + CCS
- 5.1.2 Autothermal Reforming (ATR) + CCS
- 5.1.3 Gas Partial Oxidation (GPOX) + CCS
- 5.1.4 Natural-Gas Pyrolysis / NGD
- 5.1.5 Integrated SMR-ATR Hybrid
- 5.2 By End-user Industry
- 5.2.1 Refining
- 5.2.2 Chemicals
- 5.2.3 Iron and Steel
- 5.2.4 Transportation
- 5.2.5 Other Industries (Cement, Glass, Food, and more)
- 5.3 Geography
- 5.3.1 Asia-Pacific
- 5.3.1.1 China
- 5.3.1.2 India
- 5.3.1.3 Japan
- 5.3.1.4 South Korea
- 5.3.1.5 Rest of Asia-Pacific
- 5.3.2 North America
- 5.3.2.1 United States
- 5.3.2.2 Canada
- 5.3.2.3 Mexico
- 5.3.3 Europe
- 5.3.3.1 Germany
- 5.3.3.2 United Kingdom
- 5.3.3.3 France
- 5.3.3.4 Italy
- 5.3.3.5 Rest of Europe
- 5.3.4 South America
- 5.3.4.1 Brazil
- 5.3.4.2 Argentina
- 5.3.4.3 Rest of South America
- 5.3.5 Middle-East and Africa
- 5.3.5.1 Saudi Arabia
- 5.3.5.2 South Africa
- 5.3.5.3 Rest of Middle-East and Africa
- 5.3.1 Asia-Pacific
6 Competitive Landscape
- 6.1 Market Concentration
- 6.2 Strategic Moves
- 6.3 Market Share(%)/Ranking Analysis
- 6.4 Company Profiles (includes Global level Overview, Market level overview, Core Segments, Financials as available, Strategic Information, Market Rank/Share for key companies, Products & Services, and Recent Developments)
- 6.4.1 Air Liquide
- 6.4.2 Air Products and Chemicals, Inc.
- 6.4.3 ATCO Ltd.
- 6.4.4 BP p.l.c.
- 6.4.5 CERTIFHY CONSORTIUM.
- 6.4.6 Cummins Inc.
- 6.4.7 Equinor ASA
- 6.4.8 Exxon Mobil Corporation
- 6.4.9 Johnson Matthey
- 6.4.10 Linde PLC
- 6.4.11 Plug Power Inc.
- 6.4.12 Reliance Industries Limited
- 6.4.13 SABIC
- 6.4.14 Saudi Arabian Oil Co.
- 6.4.15 Shell plc
- 6.4.16 Siemens Energy
- 6.4.17 Suncor Energy Inc.
- 6.4.18 Technip Energies N.V.
- 6.4.19 Topsoe A/S
- 6.4.20 TotalEnergies
- 6.4.21 Uniper SE
- 6.4.22 Xebec Adsorption Inc.
7 Market Opportunities & Future Outlook
- 7.1 White-space & Unmet-need Assessment
- 7.2 Rising Government Initiatives to Shift Towards Clean Energy Sources

 2026年全球藍氫市場報告
 部分氧化法藍氫市場規模、佔有率和成長分析:按原料、碳捕獲技術、應用、最終用戶和地區分類 - 產業預測,2026-2033年
 全球藍氫市場規模、佔有率、趨勢和成長分析報告(2026-2034年)
 藍氫市場:全球市場預測(2026-2032)
 藍氫市場:預測至2034年-全球分析(按生產技術、原料、碳捕獲技術、經銷模式、儲存技術、終端用戶產業、工廠產能、碳捕獲率、應用和地區分類)
 蒸汽甲烷重整制藍氫市場機會、成長要素、產業趨勢分析及2026-2035年預測2026 年至 2035 年自發性熱重組藍氫市場的商業機會、成長要素、產業趨勢與預測。藍氫市場:商業機會、成長要素、產業趨勢分析及2026-2035年預測
 藍氫市場:依產品類型、應用、運輸方式及地區分類2034年全球藍氫市場機會與策略