


 |
市場調查報告書
商品編碼
2116927
紙吸管:市場佔有率分析、產業趨勢與統計、成長預測(2026-2031)Paper Straw - Market Share Analysis, Industry Trends & Statistics, Growth Forecasts (2026 - 2031) |
||||||

※ 本網頁內容可能與最新版本有所差異。詳細情況請與我們聯繫。
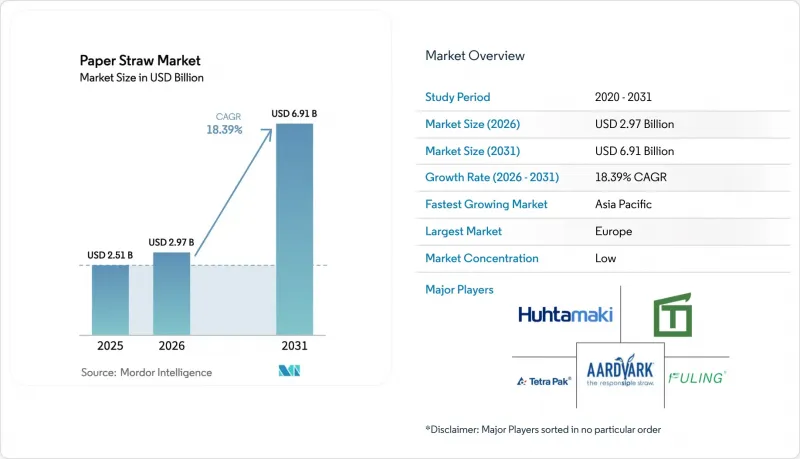
據 Mordor Intelligence 稱,紙吸管市場預計到 2026 年價值 29.7 億美元,高於 2025 年的 25.1 億美元,預計到 2031 年將達到 69.1 億美元。
預計從 2026 年到 2031 年,其複合年成長率將達到 18.39%。
本報告按材料類型(原生紙、再生紙)、吸管產品類型(普通吸管、印刷/品牌吸管)、終端用戶行業(餐飲服務業、家庭零售、商用餐飲)、吸管直徑/尺寸(標準吸管 6-7 毫米、寬吸管/手搖茶飲8-12 毫米、特殊吸管 12 毫米及以上)、銷售管道(離線 B2B 地區線上/電子商務)。市場預測以美元 (USD) 為單位。
全球紙吸管市場趨勢及洞察
全球範圍內禁止使用一次性塑膠製品正在推動市場轉型。
目前,主要經濟體正在實施協調一致的法規,強制零售商和餐廳停止使用不可生物分解的塑膠吸管。雖然中國的《污染防治行動計畫》和香港自2024年起實施的禁令縮短了監管合規的寬限期,但歐盟的《一次性塑膠指令》已成為新興市場效仿的典範。這些法規設定了可衡量的減廢棄物目標,增強了加工商投資新型造紙機和塗佈生產線的信心。此外,監管透明度的提高也讓投資者更加相信,即使在利潤微薄的速食業,紙吸管市場的長期銷售量也會成長。
消費者對環保產品的偏好日益成長,正在改變採購方式。
Z世代要求包裝既環保又要實用。研究表明,這一代人不喜歡吸管容易變軟或影響飲品口感,因此製造商正在開發使用纖維素奈米晶體和生物聚酯的塗層,以滿足更高的性能標準。像指南針集團這樣的大型餐飲公司已將這些規範納入其合約競標中,迫使整個紙吸管行業的供應商提高准入標準。隨著速食連鎖店不斷宣佈在可再生材料使用方面取得里程碑式的進展,消費者的期望值也越來越高,加速了創新和應用。
與塑膠吸管相比,較高的單價限制了它們的廣泛應用。
由於生產速度快、原料成本低,塑膠吸管生產機器的單位成本仍具有經濟優勢。即使通貨膨脹推高了餐飲企業的投入成本,採購團隊仍會嚴格審查每餐的成本,尤其是在新興市場。韋恩堡紙吸管工廠的關閉凸顯了利潤率過低會導致產能削減。然而,儘管掩埋稅和與塑膠相關的聲譽風險正在縮小成本差距,但新的原料供應管道,例如蘆葦基材,預計將進一步降低成本。
細分市場分析
預計到2025年,再生紙將佔紙吸管市場51.20%的佔有率,且成長速度將超過其他任何材料,到2031年複合年成長率將達到22.96%。成本優勢主要得益於回收網路的成熟,高品質的再生纖維目前正被重新用於食品級應用。生產者責任延伸制度(EPR)對原生包裝徵收的附加費進一步推動了原料向再生材料的轉變。雖然原生紙對於高階外觀和複雜的印刷色彩仍然至關重要,但新的除煙工藝正在縮小兩者之間的差距,高品質的再生紙漿也開始適用於高階品牌管道。
對加工設施的投資也反映了這一發展勢頭。斯特拉勒恩索公司已投資10億歐元對其位於奧盧的工廠維修,該工廠生產用於折疊紙盒的紙板和塗佈牛皮紙。這些產品也可作為食品接觸吸管的覆膜材料。隨著生產線速度的提升,再生捲紙的加工能力已達到與原生紙生產線相當的水平,從而緩解了人們對產量差異的擔憂。製造商與市政廢棄物管理部門之間的合作確保了纖維供應的穩定,使工廠不易受現貨價格波動的影響。此類整合提高了後進企業的進入門檻,並進一步鞏固了早期回收企業在紙吸管市場的優勢。
到2025年,由於快餐店優先考慮單價,普通吸管將佔市場佔有率的56.12%。然而,隨著零售商開始將吸管用作微型廣告牌,印花吸管市場正以24.12%的複合年成長率成長。相容水性油墨的數位印刷機能夠以符合食品接觸標準的方式小批量生產少於1萬根的吸管,從而將客製化市場拓展至精品咖啡館和其他餐飲場所。大型連鎖商店正利用與電影上映和體育賽事相關的定期宣傳活動,推出吸管套裝。這種策略提高了吸管與飲料的關聯度,從而實現了更高的溢價。
為了滿足市場需求,印刷吸管製造商正投資於七色柔版印刷模組和自動化裝版設備,同時減少因過度設定造成的浪費。此外,從石油基油墨轉向植物來源油墨,強化了環保理念,並使吸管圖案與永續發展品牌訊息相協調。隨著印刷成本的降低,市場分析師預測,未來十年,印刷吸管與普通白吸管的價格差距將縮小,並在紙吸管市場中擴大市場佔有率。
區域分析
預計到2025年,歐洲將憑藉嚴格的政策環境和成熟的回收物流體系,以30.40%的市佔率引領紙吸管市場。德國、法國和英國的公共機構正在調整其採購政策,使其與歐盟的一次性塑膠指令保持一致,從而支撐著市場需求。芬蘭奧盧造紙廠的升級改造以及瑞典斯科訥乾式成型製程的投資,都體現了歐洲生產商對長期國內消費的信心。零售商更傾向於選擇本地採購的吸管,以避免洲際運輸造成的碳排放,這進一步強化了歐洲的採購體系。
亞太地區預計到2031年將以20.58%的複合年成長率成長,主要得益於中國、香港和日本同步實施的監管措施。加之手搖茶飲的爆紅,這些措施將在未來幾年鞏固對大直徑產品的需求。豐富的紡織資源和充足的勞動力帶來的低製造成本,使亞洲工廠在出口競標中極具競爭力,預計該地區在預測期內的絕對產量將超過歐洲。製造商正在迅速採用自動化檢測系統以滿足西方的食品接觸標準,這加速了產品在高階市場的普及。
在北美,隨著各州層級的監管措施從沿海地區逐步擴展到中西部,預計市場將穩定擴張。麥當勞和思科等公司的努力確保了即使在監管不均的地區也能維持一定的需求水準。像美國包裝公司(Packing Corporation of America)這樣的大型多元化製造商預計,2025年的銷售額將達到創紀錄的21億美元,凸顯了終端市場的持續健康發展。創業投資資金正湧入海藻和蘆葦等小眾材料領域,展現出多元化的創新格局,與大規模的紙張相關資產形成互補。
其他好處:
- Excel格式的市場預測(ME)表
- 3個月的分析師支持
目錄
第1章:引言
- 研究假設和市場定義
- 調查範圍
第2章:調查方法
第3章執行摘要
第4章 市場狀況
- 市場概覽
- 市場促進因素
- 全球禁止使用一次性塑膠製品
- 消費者對環保產品的偏好日益成長
- 速食和QSR產業的永續性舉措
- 強制性生產者延伸責任制(EPR)
- 突破性的防水紙塗佈技術
- 零售商自有品牌綠色品牌推廣計劃
- 市場限制因素
- 單位成本高於塑膠吸管
- 功能性能(水分、味道)
- 加強對 PFAS 污染的監測
- 永續紡織品供應瓶頸
- 價值供應鏈分析
- 監理情勢
- 技術展望
- 波特五力分析
- 產業價值鏈分析
- 地緣政治影響評估
第5章 市場規模與成長預測
- 材料類型
- 原生紙
- 再生紙
- 秸稈製品類型
- 清楚的
- 印刷品/品牌產品
- 按最終用途類別
- 餐飲服務業(速食店、咖啡館、酒吧)
- 家庭零售
- 為機構(學校、醫院、航空公司)提供餐飲服務
- 吸管直徑/尺寸
- 標準(6-7毫米)
- 適用於寬口/手搖茶飲(8-12毫米)
- 特殊產品(大於 12 毫米)
- 按銷售管道
- 線下B2B分銷
- 線上電子商務
- 按地區
- 北美洲
- 美國
- 加拿大
- 墨西哥
- 歐洲
- 英國
- 德國
- 法國
- 義大利
- 其他歐洲國家
- 亞太地區
- 中國
- 日本
- 印度
- 韓國
- 其他亞太國家
- 中東
- 以色列
- 沙烏地阿拉伯
- 阿拉伯聯合大公國
- 土耳其
- 其他中東國家
- 非洲
- 南非
- 埃及
- 其他非洲國家
- 南美洲
- 巴西
- 阿根廷
- 其他南美國家
- 北美洲
第6章 競爭情勢
- 市場集中度
- 策略趨勢
- 市佔率分析
- 公司簡介
- Aardvark Straws LLC(Hoffmaster Group Inc.)
- Huhtamaki Oyj
- Transcend Packaging Ltd
- Tembo Paper BV
- Tetra Pak International SA
- Fuling Global Inc.
- Uflex Ltd
- Canada Brown Eco Products Ltd
- Karat Packaging Inc.
- IPI Srl
- Footprint International Holdings Inc.
- Biopac UK Ltd
- Lollicup USA Inc.
- OkStraw Paper Straws
- Strawland Packaging Co. Ltd
- Vegware Ltd
- Ningbo Henvcon Package Co. Ltd
- Soton Daily Necessities Co. Ltd
- GP PRO(Georgia-Pacific LLC)
- US Paper Straw
第7章 市場機會與未來展望
According to Mordor Intelligence, paper straw market size in 2026 is estimated at USD 2.97 billion, growing from 2025 value of USD 2.51 billion with 2031 projections showing USD 6.91 billion, growing at 18.39% CAGR over 2026-2031.
This report is Segmented by Material Type (Virgin Paper, Recycled Paper), Straw Product Type (Non-Printed, Printed/Branded), End-Use Sector (Foodservice, Household Retail, Institutional Catering), Straw Diameter/Size (Standard 6-7mm, Wide/Bubble-tea 8-12mm, Specialty Greater12mm), Sales Channel (Offline B2B Distribution, Online/E-commerce), and Geography. The Market Forecasts are Provided in Terms of Value (USD).
Global Paper Straw Market Trends and Insights
Global bans on single-use plastics drive market transformation
Coordinated restrictions now cover major economies, obligating retailers and food outlets to remove non-degradable plastic straws from service. China's Plastic Pollution Control Action Plan and Hong Kong's 2024 prohibition have tightened compliance windows, while the EU Single-Use Plastics Directive supplies the enforcement template used by emerging markets. These statutes impose measurable waste-reduction targets, giving converters the confidence to finance new paper machines and coating lines. Regulatory visibility also reassures investors that long-term volumes in the paper straw market will rise even in low-margin quick-service segments.
Growing consumer preference for eco-friendly products reshapes procurement
Generation Z demands packaging that blends environmental credibility with functional rigor. Surveys show that this cohort rejects soggy or taste-altering straws, so converters are developing cellulose-nanocrystal and bio-polyester coatings to meet higher performance thresholds. Catering giants such as Compass Group integrate these specifications into contract bids, forcing suppliers across the paper straw industry to raise barrier standards. As QSR chains publicize renewable-content milestones, the consumer expectation loop tightens, accelerating innovation and uptake.
Higher unit cost than plastic straws constrains penetration
Plastic machines benefit from higher production speeds and cheaper feedstocks, keeping unit economics in their favor. When inflation lifts input costs for foodservice operators, procurement teams still scrutinize cents-per-serving, especially in emerging markets. The closure of a Fort Wayne paper straw plant underscores how tight margins can trigger capacity cuts. However, landfill levies and reputational risks tied to plastic are narrowing the gap, while new raw-material pathways such as reed-based substrates promise further cost relief.
Other drivers and restraints analyzed in the detailed report include:
- Fast-food and QSR sustainability pledges create demand anchors
- Extended Producer Responsibility mandates accelerate supply chain integration
- Functional performance limitations drive technology innovation
For complete list of drivers and restraints, kindly check the Table Of Contents.
Segment Analysis
Recycled paper generated 51.20% of paper straw market size in 2025 and is forecast to climb faster than any other substrate, posting a 22.96% CAGR through 2031. Cost advantages arise from maturing collection networks that now divert higher-quality recovered fiber into food-grade applications. EPR surcharges for virgin packaging further tilt procurement toward recycled input. Virgin paper retains relevance for premium aesthetics and complicated print colors, yet new soot-removal processes are closing that gap and making high-grade recycled pulp fit for upscale brand channels.
Conversion investments reflect this momentum. Stora Enso allocated EUR 1 billion to retrofit its Oulu mill for folding box board and coated kraft, supplies that can also feed food-contact straw laminations. As line speeds rise, throughput for recycled rolls is matching virgin lines, easing concerns on output differentials. Manufacturer alliances with municipal waste authorities secure stable fiber inflows, insulating plants from spot price volatility. Such integration raises entry barriers for late entrants and reinforces the advantage held by early recyclers in the paper straw market.
Unprinted straws kept 56.12% of market revenue in 2025 because quick-service restaurants prioritize unit cost. Printed designs, however, are growing at 24.12% CAGR as retailers treat straws as miniature billboards. Digital presses that handle water-based inks now allow sub-10,000-piece runs while retaining food-contact compliance, opening the customization field to boutique cafes. Mass chains use recurring campaigns tied to movie releases or sporting events to create collectable straw sets, a tactic that increases beverage attachment rates and captures premium pricing.
Printed-straw converters invest in seven-color flexo modules and automated plate-mounting to satisfy these briefs without excessive setup waste. The transition from petroleum-based inks to vegetable formulations also advances environmental credentials, harmonizing messaging across straw graphics and sustainability branding. As printing economics improve, market analysts expect printed options to narrow the price delta with plain white counterparts, amplifying their share of the paper straw market over the decade.
Complete Report Scope:
- By Material Type
- Virgin Paper
- Recycled Paper
- By Straw Product Type
- Non-printed
- Printed / Branded
- By End-Use Sector
- Foodservice (QSR, cafes, bars)
- Household Retail
- Institutional Catering (schools, hospitals, airlines)
- By Straw Diameter / Size
- Standard (6-7 mm)
- Wide / Bubble-tea (8-12 mm)
- Specialty (greater than 12 mm)
- By Sales Channel
- Offline B2B Distribution
- Online / E-commerce
- By Geography
- North America
- United States
- Canada
- Mexico
- Europe
- United Kingdom
- Germany
- France
- Italy
- Rest of Europe
- Asia-Pacific
- China
- Japan
- India
- South Korea
- Rest of Asia-Pacific
- Middle East
- Israel
- Saudi Arabia
- United Arab Emirates
- Turkey
- Rest of Middle East
- Africa
- South Africa
- Egypt
- Rest of Africa
- South America
- Brazil
- Argentina
- Rest of South America
- North America
Geography Analysis
Europe led with a 30.40% paper straw market share in 2025 thanks to an enforcement-heavy policy environment and mature recycling logistics. Germany, France, and the United Kingdom anchor demand as public institutions align procurement with the EU Single-Use Plastics Directive. Mill upgrades at Oulu, Finland, and dry-forming investments in Skene, Sweden, demonstrate European producers' confidence in long-term domestic consumption. Retailers favor regionally supplied straws to avoid carbon emissions from transcontinental shipping, reinforcing intra-European sourcing.
Asia-Pacific is growing at 20.58% CAGR to 2031, propelled by synchronized regulatory acts in China, Hong Kong, and Japan. Combined with the runaway popularity of bubble tea, these measures lock in multi-year demand for wide-diameter products. Lower conversion costs due to abundant fiber and labor pools allow Asian plants to compete on export tenders, positioning the region to surpass Europe in absolute volume during the forecast. Manufacturers are rapidly integrating automated inspection to meet Western food-contact standards, accelerating acceptance in premium markets.
North America delivers steady expansion as state-level bans spread from coastal regions toward the Midwest. McDonald's and Sysco's commitments guarantee baseline volume even where regulation remains patchwork. Large integrated producers like Packaging Corporation of America reported record 2025 revenue of USD 2.1 billion, spotlighting sustained end-market health. Venture funding targets niche materials such as seaweed or reed, underlining a diverse innovation scene that complements scaled paper assets.
- Aardvark Straws LLC (Hoffmaster Group Inc.)
- Huhtamaki Oyj
- Transcend Packaging Ltd
- Tembo Paper B.V.
- Tetra Pak International SA
- Fuling Global Inc.
- Uflex Ltd
- Canada Brown Eco Products Ltd
- Karat Packaging Inc.
- IPI Srl
- Footprint International Holdings Inc.
- Biopac UK Ltd
- Lollicup USA Inc.
- OkStraw Paper Straws
- Strawland Packaging Co. Ltd
- Vegware Ltd
- Ningbo Henvcon Package Co. Ltd
- Soton Daily Necessities Co. Ltd
- GP PRO (Georgia-Pacific LLC)
- U.S. Paper Straw
Additional Benefits:
- The market estimate (ME) sheet in Excel format
- 3 months of analyst support
TABLE OF CONTENTS
1 INTRODUCTION
- 1.1 Study Assumptions and Market Definition
- 1.2 Scope of the Study
2 RESEARCH METHODOLOGY
3 EXECUTIVE SUMMARY
4 MARKET LANDSCAPE
- 4.1 Market Overview
- 4.2 Market Drivers
- 4.2.1 Global bans on single-use plastics
- 4.2.2 Growing consumer preference for eco-friendly products
- 4.2.3 Fast-food and QSR sustainability pledges
- 4.2.4 Extended Producer Responsibility (EPR) mandates
- 4.2.5 Breakthrough hydrophobic paper-coating technologies
- 4.2.6 Retail private-label "green branding" initiatives
- 4.3 Market Restraints
- 4.3.1 Higher unit cost than plastic straws
- 4.3.2 Functional performance (sogginess, taste)
- 4.3.3 PFAS contamination scrutiny
- 4.3.4 Sustainable fiber supply bottlenecks
- 4.4 Value / Supply-Chain Analysis
- 4.5 Regulatory Landscape
- 4.6 Technological Outlook
- 4.7 Porter's Five Forces Analysis
- 4.7.1 Bargaining Power of Suppliers
- 4.7.2 Bargaining Power of Buyers
- 4.7.3 Threat of New Entrants
- 4.7.4 Threat of Substitutes
- 4.7.5 Competitive Rivalry
- 4.8 Industry Value-Chain Analysis
- 4.9 Geopolitical Impact Assessment
5 MARKET SIZE AND GROWTH FORECASTS (VALUE)
- 5.1 By Material Type
- 5.1.1 Virgin Paper
- 5.1.2 Recycled Paper
- 5.2 By Straw Product Type
- 5.2.1 Non-printed
- 5.2.2 Printed / Branded
- 5.3 By End-Use Sector
- 5.3.1 Foodservice (QSR, cafes, bars)
- 5.3.2 Household Retail
- 5.3.3 Institutional Catering (schools, hospitals, airlines)
- 5.4 By Straw Diameter / Size
- 5.4.1 Standard (6-7 mm)
- 5.4.2 Wide / Bubble-tea (8-12 mm)
- 5.4.3 Specialty (greater than 12 mm)
- 5.5 By Sales Channel
- 5.5.1 Offline B2B Distribution
- 5.5.2 Online / E-commerce
- 5.6 By Geography
- 5.6.1 North America
- 5.6.1.1 United States
- 5.6.1.2 Canada
- 5.6.1.3 Mexico
- 5.6.2 Europe
- 5.6.2.1 United Kingdom
- 5.6.2.2 Germany
- 5.6.2.3 France
- 5.6.2.4 Italy
- 5.6.2.5 Rest of Europe
- 5.6.3 Asia-Pacific
- 5.6.3.1 China
- 5.6.3.2 Japan
- 5.6.3.3 India
- 5.6.3.4 South Korea
- 5.6.3.5 Rest of Asia-Pacific
- 5.6.4 Middle East
- 5.6.4.1 Israel
- 5.6.4.2 Saudi Arabia
- 5.6.4.3 United Arab Emirates
- 5.6.4.4 Turkey
- 5.6.4.5 Rest of Middle East
- 5.6.5 Africa
- 5.6.5.1 South Africa
- 5.6.5.2 Egypt
- 5.6.5.3 Rest of Africa
- 5.6.6 South America
- 5.6.6.1 Brazil
- 5.6.6.2 Argentina
- 5.6.6.3 Rest of South America
- 5.6.1 North America
6 COMPETITIVE LANDSCAPE
- 6.1 Market Concentration
- 6.2 Strategic Moves
- 6.3 Market Share Analysis
- 6.4 Company Profiles (includes Global Overview, Market-Level Overview, Core Segments, Financials as available, Strategic Information, Market Rank/Share, Products and Services, Recent Developments)
- 6.4.1 Aardvark Straws LLC (Hoffmaster Group Inc.)
- 6.4.2 Huhtamaki Oyj
- 6.4.3 Transcend Packaging Ltd
- 6.4.4 Tembo Paper B.V.
- 6.4.5 Tetra Pak International SA
- 6.4.6 Fuling Global Inc.
- 6.4.7 Uflex Ltd
- 6.4.8 Canada Brown Eco Products Ltd
- 6.4.9 Karat Packaging Inc.
- 6.4.10 IPI Srl
- 6.4.11 Footprint International Holdings Inc.
- 6.4.12 Biopac UK Ltd
- 6.4.13 Lollicup USA Inc.
- 6.4.14 OkStraw Paper Straws
- 6.4.15 Strawland Packaging Co. Ltd
- 6.4.16 Vegware Ltd
- 6.4.17 Ningbo Henvcon Package Co. Ltd
- 6.4.18 Soton Daily Necessities Co. Ltd
- 6.4.19 GP PRO (Georgia-Pacific LLC)
- 6.4.20 U.S. Paper Straw
7 MARKET OPPORTUNITIES AND FUTURE OUTLOOK
- 7.1 White-space and Unmet-Need Assessment

 紙吸管市場:2026-2032年全球市場預測(按材料、產品類型、內徑、包裝、長度、印刷類型、最終用戶和分銷管道分類)秸稈炭化機械市場:按秸稈類型、機械類型、處理能力、技術、應用、最終用戶、銷售管道,全球預測,2026-2032年
 紙吸管市場規模、佔有率、成長及全球產業分析:按類型、應用和地區分類,並預測至2026-2034年
 2026年全球紙吸管市場報告
 紙吸管市場規模、佔有率和成長分析(按產品類型、材料、應用、分銷管道、最終用戶和地區分類)-2026-2033年產業預測
 紙吸管市場 - 全球產業規模、佔有率、趨勢、機會及預測(按產品、材料、最終用戶、地區和競爭對手分類),2021-2031年秸稈壓塊機市場按型號、動力來源、應用、最終用途和通路管道分類-2026年至2032年全球預測
 紙吸管市場規模、佔有率、趨勢分析報告:按材料、產品、長度、直徑、銷售管道、最終用途、地區、細分市場預測,2025-2030 年紙吸管市場規模(按材料、產品、最終用戶、區域範圍和預測)