


 |
市場調查報告書
商品編碼
2116343
電動車固態電池:市場佔有率分析、行業趨勢和統計數據以及成長預測(2026-2031 年)EV Solid-state Battery - Market Share Analysis, Industry Trends & Statistics, Growth Forecasts (2026 - 2031) |
||||||

※ 本網頁內容可能與最新版本有所差異。詳細情況請與我們聯繫。
根據 Mordor Intelligence 稱,電動車固態電池的市場規模預計在 2026 年達到 3.7209 億美元,高於 2025 年的 2.6 億美元,預計到 2031 年將達到 22.3 億美元。
預計從 2026 年到 2031 年,其複合年成長率將達到 43.11%。
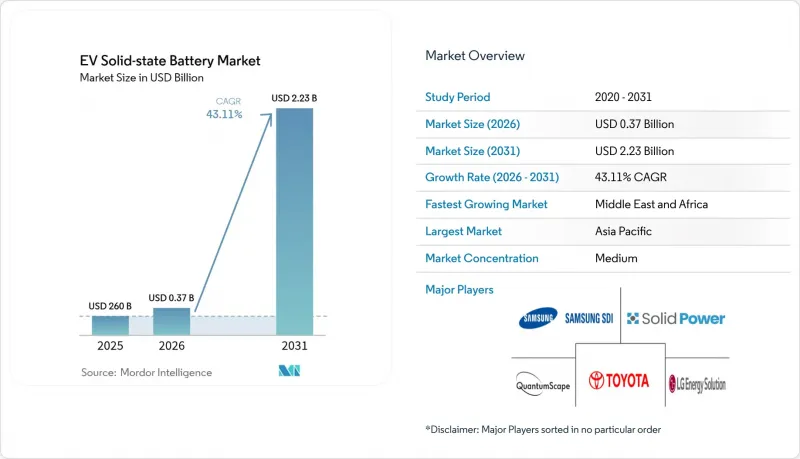
本報告按車輛類型(乘用車和商用車)、動力類型(電池式電動車、插電式混合動力汽車等)、固體電解質類型(硫化物基、氧化物基等)、陽極材料(鋰金屬等)、電池容量(小於20安時等)和地區進行細分。市場預測以美元計價。
全球電動車固態電池市場趨勢與洞察
全球電動車銷量快速成長
預計到2025年,全球電動車銷量將超過2,000萬輛,約2021年的三倍。這將促使汽車製造商更加專注於研發充電更快、續航里程更長的電池。亞洲電池製造商憑藉著規模經濟優勢,已率先受益,因為中國在電池生產領域佔據主導地位。同時,商用車車隊的電氣化正在擴大消費者以外的市場需求。電池組訂單的增加使供應商能夠提高試點生產線的運轉率,從而降低每度電的成本。這些趨勢,加上目標車型範圍的擴大以及買家更願意為技術溢價買單,正在推動固態電池市場的整體成長。儘管區域差異依然存在,但隨著人們對安全性和續航里程的擔憂逐漸減少,整體成長趨勢仍在持續。
與鋰離子電池相比,具有更高的能量密度和安全性
固態電池原型機的能量密度始終超過 500 Wh/kg,遠超過傳統鋰離子電池組 250-300 Wh/kg 的範圍。這正推動電動車固態電池市場的創新發展。近期實驗室研究也表明,硫化物電解質的離子電導率高達 5.7 mS/cm,即使在機械應力作用下也能保持結構完整性。由於無需使用易燃的液態電解質,熱失控的風險得以降低,而熱失控正日益成為監管機構和保險公司關注的重要考量。因此,汽車製造商可以縮小電池組的面積,從而釋放車內空間並減輕車輛重量。這些優勢使得車輛能夠延長續航里程,或者在實現相同續航里程的情況下使用更小的電池,這兩者都提供了設計柔軟性並降低了擁有成本。此外,該技術還相容於純鋰金屬負極,進一步擴大了性能差距,使其成為高階車輛和車隊平台的理想選擇。
生產成本高,成品率低
目前固態電池的成本為每千瓦時 400 至 500 美元,約為目前鋰離子電池組平均成本的四倍,這是由於固體介面對濕度控制和公差要求非常嚴格。許多試驗生產線正面臨兩位數的良率下降,導致初期生產階段單位成本增加。諸如沉澱鋰箔和無陽極層壓等製程創新可望將缺陷率降低一半,但其實用化檢驗仍在進行中。在這些改進從實驗室走向生產線之前,高昂的價格可能會阻礙其廣泛應用。
細分市場分析
預計到2025年,乘用車市場將佔總銷售量的73.52%,反映出高性能、具成本效益車型的早期普及,這些車型的性能和安全性足以支撐其溢價。雖然商用車市場佔有率較小,但預計到2031年將達到38.95%的複合年成長率,因為營運商優先考慮降低總擁有成本(TCO)和透過長壽命電池組減少停機時間。豐田計劃首先在其豪華小轎車中引入固態電池組,然後在成本降低後將其化學技術推廣到更多車型。相較之下,車隊管理者更注重快速充電和耐用性,因此如果電池的初始價格較高,但能夠降低維護成本,他們也更願意接受。
細分市場趨勢表明,市場引入將呈現兩階段曲線。首先,豪華乘用車將確立品牌和技術可靠性,隨後是優先考慮運轉率的輕型貨車和卡車。隨著保固數據的累積和單位成本的下降,從2028年起,普通乘用車市場將佔據大部分銷售量。這種轉變反映了高鎳鋰離子電池組的過程,並將成為其滲透大眾市場的立足點。
預計到2025年,純電動車(BEV)將佔汽車出貨量的69.45%,並在預測期內以38.60%的複合年成長率成長。純電動平台可以利用這種化學成分的高能量密度來延長續航里程,而無需增加電池組的尺寸,儘管這一優勢對於混合動力汽車而言並不那麼顯著。然而,插電式混合動力車(PHEV)將受益於快速充電技術的普及,這將提高純電動駕駛的比例,並改善車隊對排放氣體法規的遵守情況。
許多汽車製造商正將固態電池的藍圖與其旗艦電動車架構相匹配。這是因為高階車型的利潤率足以抵消高昂的初始電池成本。隨著成本的降低,更薄更輕的固態電池模組將被應用於插電式混合動力汽車(PHEV)和串聯混合動力汽車平台,從而釋放空間並實現更小的電池尺寸。同時,零排放的監管壓力正鞏固純電動車(BEV)作為最適合該技術的主要動力系統的地位。
區域分析
到2025年,亞太地區將憑藉日本在硫化鋰價值鏈方面的專業知識和韓國的試點生產線,以40.85%的市佔率引領固態電池市場。政府資金將支持電芯研發和早期車輛安裝項目,而成熟的鋰離子電池出口管道將縮短大規模生產的學習曲線。
在《通貨膨脹抑制法案》的稅額扣抵以及2030年電池年產能超過1200吉瓦時的目標的支持下,北美正在崛起成為下一個主要成長中心。大眾汽車計劃在聖托馬斯建設的超級工廠以及多家新創企業的試點生產線,都表明一個以國內採購義務為中心的生態系統正在形成。各公司正利用接近性在加拿大和美國鈷、鋰和鎳礦床的地理優勢,確保原料的穩定供應。
中東和非洲的複合年成長率最高,達35.40%,主要得益於綠氫能中心正快速轉型為固態電池技術。儘管這些中心規模較小,但由於安全性和耐用性方面的考慮,它們正在加速轉型。此外,電力公司規模的儲能試點計畫也推動了這項成長。在歐洲,德國的「FestBatt」舉措及其合作夥伴聯盟正穩步推進,目標是在本世紀末實現商業化生產。預計歐洲汽車製造商的整合將在未來推動需求成長,而公共和私人資金的共同投入正在加速材料科學領域的突破性進展。
其他好處:
- Excel格式的市場預測(ME)表
- 3個月的分析師支持
目錄
第1章:引言
- 研究假設和市場定義
- 調查範圍
第2章:調查方法
第3章執行摘要
第4章 市場狀況
- 市場概覽
- 市場促進因素
- 全球電動車銷量快速成長
- 能量密度和安全性均優於鋰離子電池
- 政府強制推廣零排放汽車,並為電池提供津貼。
- 汽車製造商的內部試驗生產線(豐田、福斯、BMW)
- 卷對卷硫化物電解成本效益的突破性進展。
- 保險業努力降低電池火災賠償責任
- 市場限制因素
- 生產成本高,成品率低
- 2028 年千兆級產能短缺
- 超高純度鋰金屬箔供應緊張
- 固體電解質的回收途徑尚不明確。
- 價值供應鏈分析
- 五力分析
- 新進入者的威脅
- 買方的議價能力
- 供應商的議價能力
- 替代品的威脅
- 競爭公司之間的競爭
- 投資和資金籌措趨勢
第5章 市場規模與成長預測
- 按車輛類型
- 搭乘用車
- 商用車輛
- 依推進類型
- 電池式電動車(BEV)
- 插電式混合動力車(PHEV)
- 混合動力電動車(HEV)
- 按固體電解質類型
- 硫化物基
- 氧化物基
- 聚合物體系
- 依材料分類的陽極材料
- 鋰金屬
- 矽複合材料
- 石墨複合材料
- 按電池容量
- 小於 20 安培時
- 20~100 Ah
- 100安時或更高
- 按地區
- 北美洲
- 美國
- 加拿大
- 其他北美國家
- 南美洲
- 歐洲
- 德國
- 英國
- 法國
- 西班牙
- 俄羅斯
- 其他歐洲國家
- 亞太地區
- 中國
- 日本
- 韓國
- 印度
- 澳洲
- 其他亞太國家
- 中東和非洲
- 沙烏地阿拉伯
- UAE
- 南非
- 埃及
- 奈及利亞
- 其他中東和非洲國家
- 北美洲
第6章 競爭情勢
- 市場集中度
- 策略趨勢
- 市佔率分析
- 公司簡介
- Toyota Motor Corporation
- Volkswagen AG
- Samsung SDI Co Ltd
- LG Energy Solution Ltd
- QuantumScape Corp
- CATL
- BYD Co Ltd
- Solid Power Inc
- Panasonic Holdings Corp
- ProLogium Technology Co Ltd
- Nissan Motor Co Ltd
- BMW AG
- Ford Motor Co
- Stellantis NV
- Hyundai Motor Co
第7章 市場機會與未來展望
According to Mordor Intelligence, EV solid-state battery market size in 2026 is estimated at USD 372.09 million, growing from 2025 value of USD 260 million with 2031 projections showing USD 2.23 billion, growing at 43.11% CAGR over 2026-2031.
This report is Segmented by Vehicle Type (Passenger Cars and Commercial Vehicles), Propulsion (Battery Electric Vehicle, Plug-In Hybrid Electric Vehicle (PHEV), and More), Solid Electrolyte Type (Sulfide-Based, Oxide-Based, and More), Anode Material (Lithium-Metal, and More), Battery Capacity (Below 20 Ah, and More), and Geography. The Market Forecasts are Provided in Terms of Value (USD).
Global EV Solid-state Battery Market Trends and Insights
Rapid growth in global EV sales volumes
Global electric-vehicle sales are expected to top 20 million units in 2025, roughly triple 2021 levels, intensifying automakers' search for batteries that charge faster and go farther. China's production dominance gives Asian cell makers early-scale advantages, while commercial-fleet electrification widens demand beyond consumer segments. Larger pack orders allow suppliers to push pilot lines toward higher equipment utilisation, in turn lowering per-kilowatt-hour costs. These dynamics collectively lift the solid-state battery market by expanding both the addressable vehicle pool and the willingness of buyers to pay technology premiums. Regional variations persist, but the overall trajectory remains upward as safety and range anxieties decline.
Energy-density and safety edge over Li-ion packs
Solid-state prototypes routinely exceed 500 Wh/kg, far above the 250-300 Wh/kg range of conventional lithium-ion packs, driving innovation in the EV Solid-state Battery Market, and recent laboratory work reports ionic conductivities of 5.7 mS/cm for sulfide electrolytes while retaining structural integrity under mechanical stress. Removing flammable liquid electrolytes lowers thermal-runaway risk, an increasingly important criterion for regulators and insurers. Automakers can therefore shrink pack footprints, recapture cabin space, and trim vehicle mass. These benefits translate into longer driving ranges or smaller batteries for the same range, both of which unlock design flexibility and cost-of-ownership gains. The technology's tolerance for pure lithium-metal anodes further widens the performance gap, creating a compelling pull for high-end and fleet platforms.
High production cost and low manufacturing yield
Present solid-state cells cost USD 400-500 per kWh, roughly four times the average cost of today's lithium-ion packs, due to strict moisture controls and tight tolerances at solid-solid interfaces. Yield losses reach double-digit percentages on many pilot lines, amplifying unit costs during early runs. Process innovations, such as vapour-deposited lithium foils and anode-free stacking, show promise in halving defect rates, yet industrial validation is still underway. Until these improvements move from lab to line, price premiums will restrain widespread rollout.
Other drivers and restraints analyzed in the detailed report include:
- Government ZEV mandates and battery incentives
- Automaker in-house pilot lines (Toyota, VW, BMW)
- Limited gigascale capacity before 2028
For complete list of drivers and restraints, kindly check the Table Of Contents.
Segment Analysis
The passenger-car segment generated 73.52% of 2025 revenue, reflecting early deployments in high-value models where performance and safety command price premiums. Commercial fleets trail in share yet post a 38.95% CAGR to 2031 as operators weigh total-cost-of-ownership savings from longer-lasting packs and reduced downtime. Toyota plans to launch solid-state packs first in luxury coupes, then cascade the chemistry to broader line-ups once costs fall. Fleet managers, by contrast, prioritise rapid charging and durability, making them receptive to higher upfront battery prices that cut maintenance.
The segment pattern indicates a two-wave adoption curve: personal-luxury vehicles establish brand credibility and engineering reliability, followed by light-duty vans and trucks that prize utilisation rates. As warranty data accumulate and unit costs slide, mainstream passenger segments will account for the bulk of unit volumes post-2028. This shift mirrors the historical rollout of high-nickel lithium-ion packs and creates a stepping-stone to mass-market penetration.
BEVs absorbed 69.45% of shipments in 2025 and are forecast to grow at 38.60% CAGR over the outlook period. Pure-electric platforms exploit the chemistry's high energy density to extend range without enlarging packs, an advantage less critical to hybrids. PHEVs nonetheless gain from faster charge acceptance, which raises electric-only driving fractions and improves fleet emissions compliance.
Most automakers align their solid-state roadmaps with flagship electric architectures because premium margins can cover early cell premiums. As costs decline, PHEV and series-hybrid platforms will adopt thinner, lighter solid-state modules that free up packaging space or allow battery downsizing. In parallel, regulatory pressure for zero tailpipe emissions cements BEVs as the dominant propulsion fit for the technology.
Complete Report Scope:
- By Vehicle Type
- Passenger Cars
- Commercial Vehicles
- By Propulsion
- Battery Electric Vehicle (BEV)
- Plug-in Hybrid Electric Vehicle (PHEV)
- Hybrid Electric Vehicle (HEV)
- By Solid Electrolyte Type
- Sulfide-based
- Oxide-based
- Polymer-based
- By Anode Material
- Lithium-Metal
- Silicon-Composite
- Graphite-Composite
- By Battery Capacity
- Below 20 Ah
- 20 to 100 Ah
- Above 100 Ah
- By Geography
- North America
- United States
- Canada
- Rest of North America
- South America
- Europe
- Germany
- United Kingdom
- France
- Spain
- Russia
- Rest of Europe
- Asia-Pacific
- China
- Japan
- South Korea
- India
- Australia
- Rest of Asia-Pacific
- Middle East and Africa
- Saudi Arabia
- UAE
- South Africa
- Egypt
- Nigeria
- Rest of Middle East and Africa
- North America
Geography Analysis
Asia-Pacific led the solid-state battery market with 40.85% share in 2025, anchored by Japan's lithium-sulfide value chain and South Korea's pilot-line expertise. Government funding underpins cell R&D and early vehicle integration projects, while established lithium-ion export corridors shorten scale-up learning curves.
North America, supported by Inflation Reduction Act credits and a target of more than 1,200 GWh annual cell capacity by 2030, emerges as the next major growth pole. Volkswagen's planned St. Thomas gigafactory and multiple start-up pilot lines point to an ecosystem forming around domestic supply mandates. Companies leverage proximity to cobalt, lithium, and nickel deposits in Canada and the United States to secure raw-material resilience.
The Middle East and Africa register the highest CAGR at 35.40%, albeit from a small base, driven by green-hydrogen hubs and utility-scale storage pilots that leapfrog to solid-state chemistries for safety and durability reasons. Europe maintains steady progress with Germany's FestBatt initiative and multi-partner consortia targeting commercial output by decade's end. European automakers' integration efforts ensure eventual demand pull, while public-private funding pools accelerate material science breakthroughs.
- Toyota Motor Corporation
- Volkswagen AG
- Samsung SDI Co Ltd
- LG Energy Solution Ltd
- QuantumScape Corp
- CATL
- BYD Co Ltd
- Solid Power Inc
- Panasonic Holdings Corp
- ProLogium Technology Co Ltd
- Nissan Motor Co Ltd
- BMW AG
- Ford Motor Co
- Stellantis NV
- Hyundai Motor Co
Additional Benefits:
- The market estimate (ME) sheet in Excel format
- 3 months of analyst support
TABLE OF CONTENTS
1 Introduction
- 1.1 Study Assumptions and Market Definition
- 1.2 Scope of the Study
2 Research Methodology
3 Executive Summary
4 Market Landscape
- 4.1 Market Overview
- 4.2 Market Drivers
- 4.2.1 Rapid growth in global EV sales volumes
- 4.2.2 Energy-density and safety edge over Li-ion packs
- 4.2.3 Government ZEV mandates and battery incentives
- 4.2.4 Automaker in-house pilot lines (Toyota, VW, BMW)
- 4.2.5 Roll-to-roll sulfide electrolyte cost break-throughs
- 4.2.6 Insurance-sector push to cut battery-fire liabilities
- 4.3 Market Restraints
- 4.3.1 High production cost and low manufacturing yield
- 4.3.2 Limited gigascale capacity before 2028
- 4.3.3 Supply pinch in ultra-pure lithium-metal foils
- 4.3.4 Uncertain recycling pathways for solid electrolytes
- 4.4 Value / Supply-Chain Analysis
- 4.5 Porter,s Five Forces Analysis
- 4.5.1 Threat of New Entrants
- 4.5.2 Bargaining Power of Buyers
- 4.5.3 Bargaining Power of Suppliers
- 4.5.4 Threat of Substitutes
- 4.5.5 Intensity of Competitive Rivalry
- 4.6 Investment and Funding Landscape
5 Market Size and Growth Forecasts
- 5.1 By Vehicle Type
- 5.1.1 Passenger Cars
- 5.1.2 Commercial Vehicles
- 5.2 By Propulsion
- 5.2.1 Battery Electric Vehicle (BEV)
- 5.2.2 Plug-in Hybrid Electric Vehicle (PHEV)
- 5.2.3 Hybrid Electric Vehicle (HEV)
- 5.3 By Solid Electrolyte Type
- 5.3.1 Sulfide-based
- 5.3.2 Oxide-based
- 5.3.3 Polymer-based
- 5.4 By Anode Material
- 5.4.1 Lithium-Metal
- 5.4.2 Silicon-Composite
- 5.4.3 Graphite-Composite
- 5.5 By Battery Capacity
- 5.5.1 Below 20 Ah
- 5.5.2 20 to 100 Ah
- 5.5.3 Above 100 Ah
- 5.6 By Geography
- 5.6.1 North America
- 5.6.1.1 United States
- 5.6.1.2 Canada
- 5.6.1.3 Rest of North America
- 5.6.2 South America
- 5.6.3 Europe
- 5.6.3.1 Germany
- 5.6.3.2 United Kingdom
- 5.6.3.3 France
- 5.6.3.4 Spain
- 5.6.3.5 Russia
- 5.6.3.6 Rest of Europe
- 5.6.4 Asia-Pacific
- 5.6.4.1 China
- 5.6.4.2 Japan
- 5.6.4.3 South Korea
- 5.6.4.4 India
- 5.6.4.5 Australia
- 5.6.4.6 Rest of Asia-Pacific
- 5.6.5 Middle East and Africa
- 5.6.5.1 Saudi Arabia
- 5.6.5.2 UAE
- 5.6.5.3 South Africa
- 5.6.5.4 Egypt
- 5.6.5.5 Nigeria
- 5.6.5.6 Rest of Middle East and Africa
- 5.6.1 North America
6 Competitive Landscape
- 6.1 Market Concentration
- 6.2 Strategic Moves
- 6.3 Market Share Analysis
- 6.4 Company Profiles (includes Global Level Overview, Market Level Overview, Core Segments, Financials as Available, Strategic Information, Market Rank/Share for Key Companies, Products and Services, SWOT Analysis, and Recent Developments)
- 6.4.1 Toyota Motor Corporation
- 6.4.2 Volkswagen AG
- 6.4.3 Samsung SDI Co Ltd
- 6.4.4 LG Energy Solution Ltd
- 6.4.5 QuantumScape Corp
- 6.4.6 CATL
- 6.4.7 BYD Co Ltd
- 6.4.8 Solid Power Inc
- 6.4.9 Panasonic Holdings Corp
- 6.4.10 ProLogium Technology Co Ltd
- 6.4.11 Nissan Motor Co Ltd
- 6.4.12 BMW AG
- 6.4.13 Ford Motor Co
- 6.4.14 Stellantis NV
- 6.4.15 Hyundai Motor Co
7 Market Opportunities and Future Outlook

 全球固態電池市場規模、佔有率、趨勢和成長分析報告(2026-2034)
 固態固態電池市場預測至2034年—按電池類型、電解液材料、容量、應用、最終用戶和地區分類的全球分析固態電池市場規模、佔有率、成長、全球產業分析、區域趨勢及2026年至2034年預測。
 固態電池市場:2026-2032年全球市場預測(按產品類型、電解液類型、容量、電池形式、功率容量、可充電性、應用和分銷管道分類)
 2026 年至 2035 年電動車 (EV) 新一代固態固態電池的市場機會、成長要素、產業趨勢與預測。
 全球固態電池市場:按應用、產品和地區分類的分析和預測(2026-2035 年)
 全固體鋰離子電池的專利監測固態電池市場預測至2034年—全球電池類型、電解液類型、容量、技術、應用、最終用戶和區域分析
 全固態電池市場:按應用、容量、電池類型和地區分類全球固態電池市場(2026-2036)